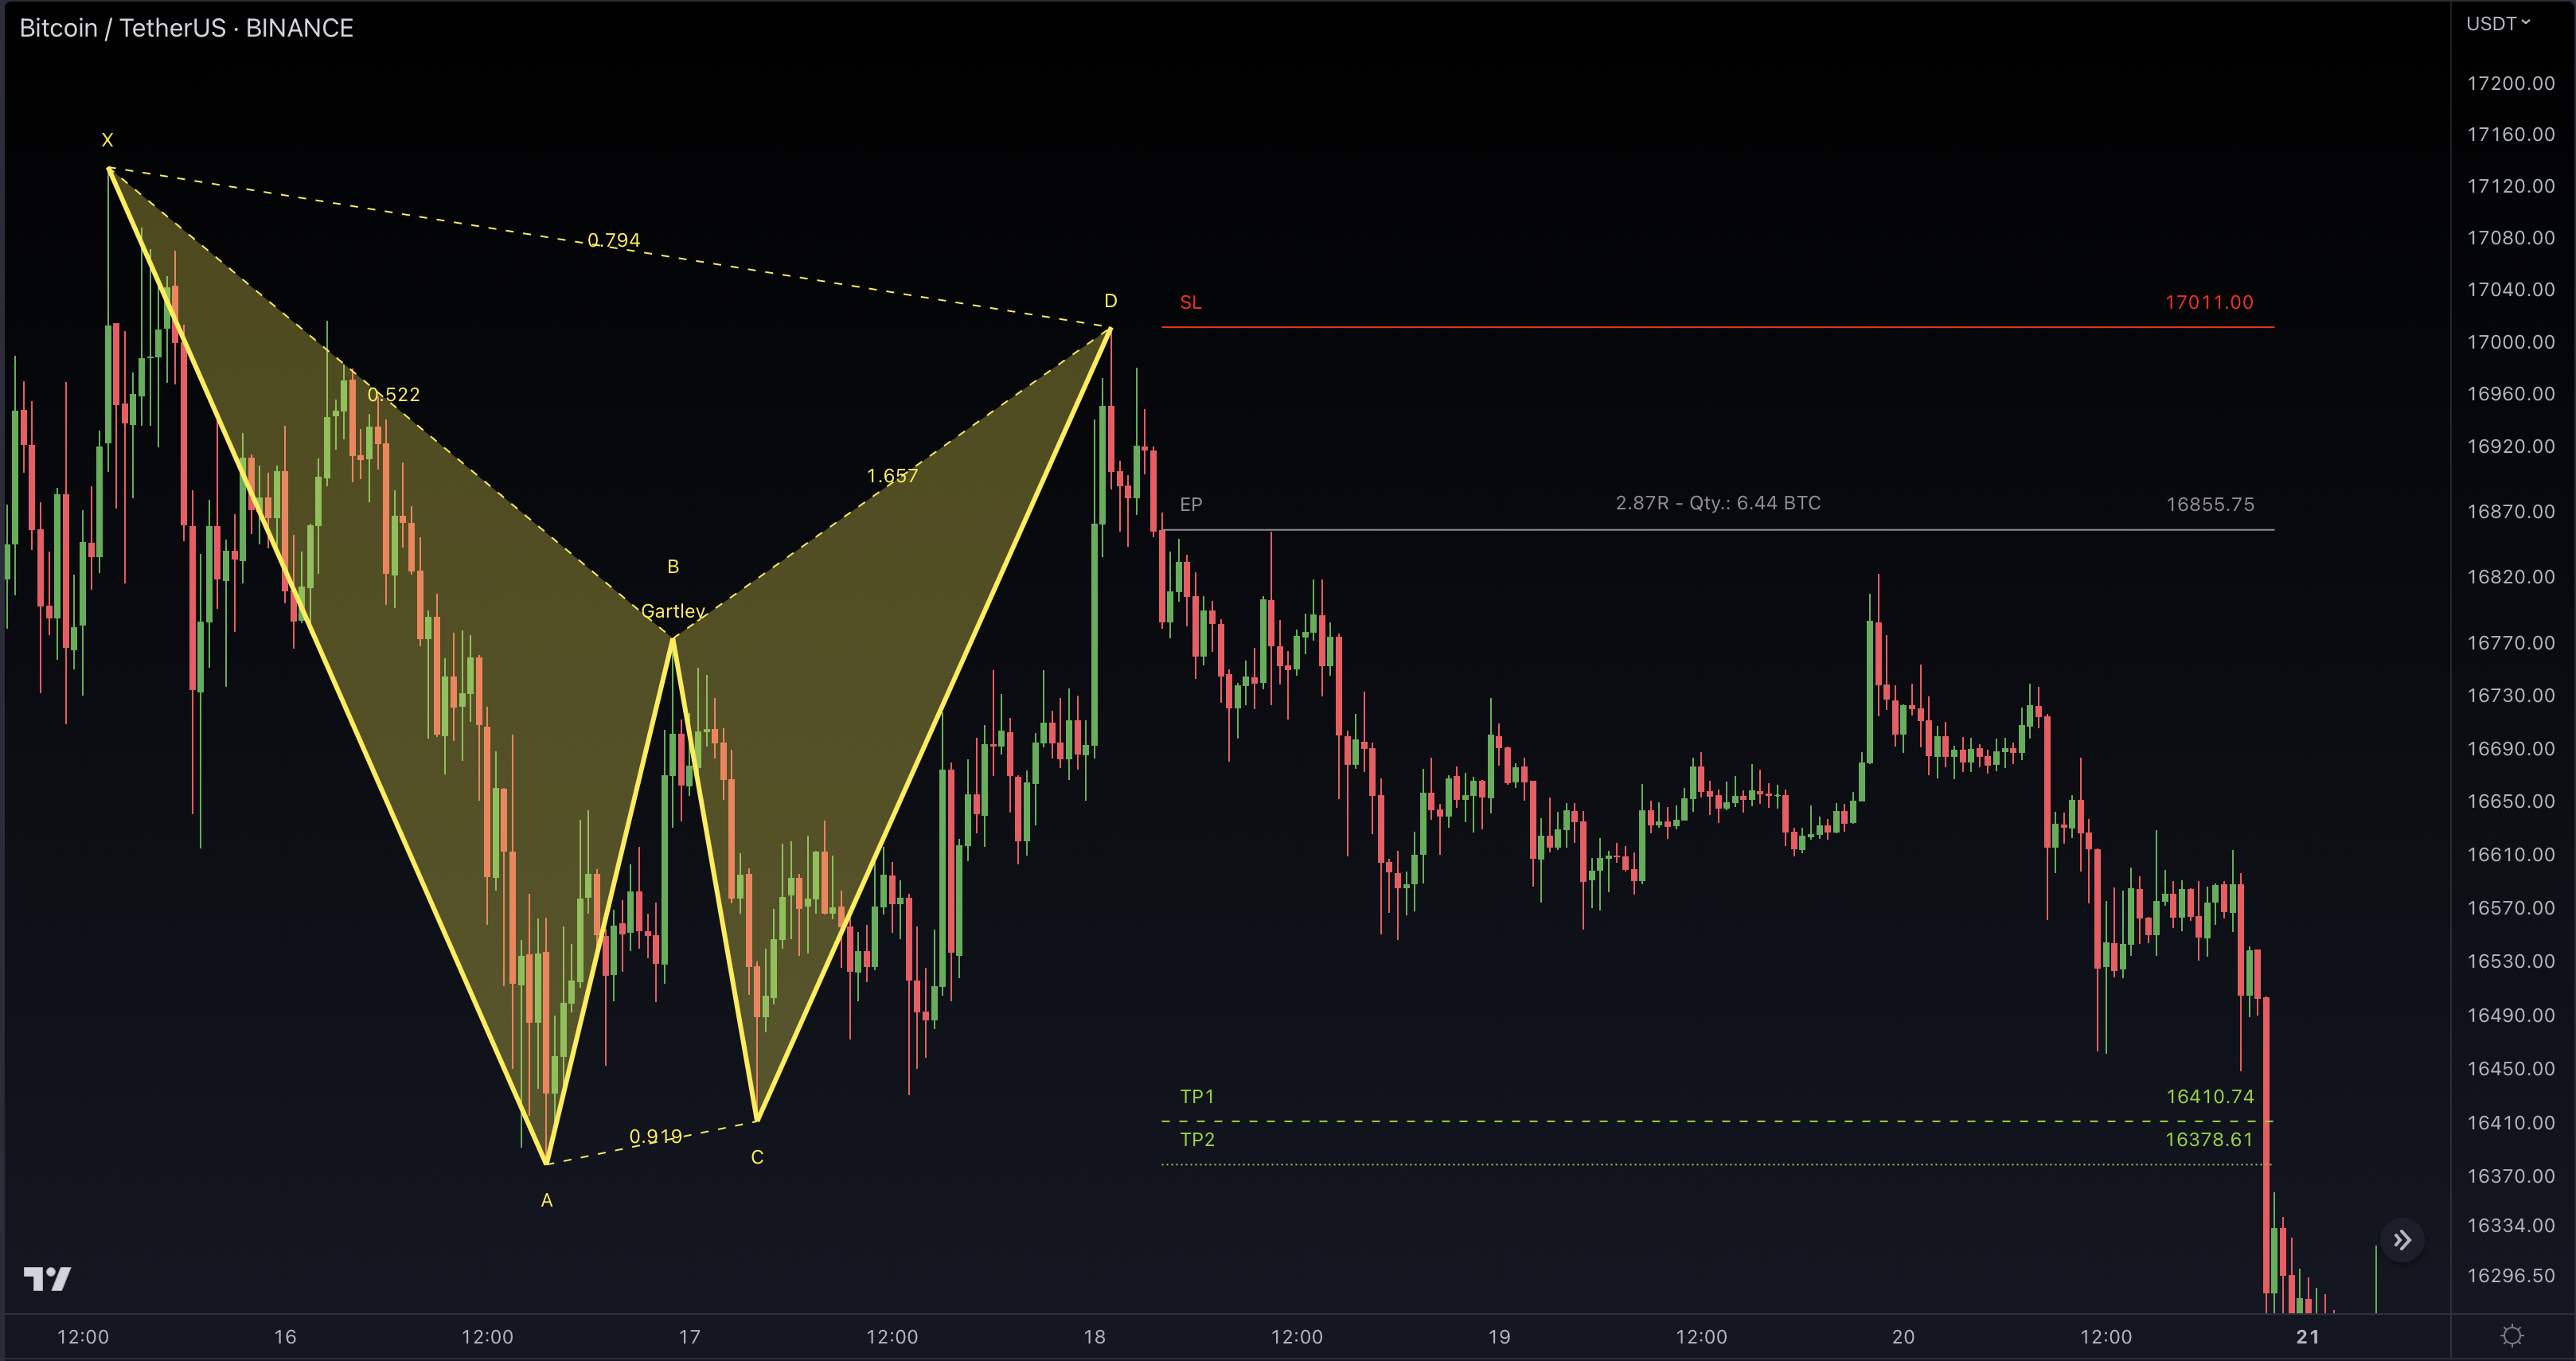
How To Trade With Harmonic Patterns Suite

The procedure for trading with the Harmonic Patterns Suite is identical for all harmonic patterns and nobody wants to read the same texts over and over again. For this reason, the procedure is described using the Gartley pattern as a representative example for all harmonic chart patterns included in the Harmonic Patterns Suite.
1. Choose Breakout Conditions
Choose one out of 7 breakout conditions. Based on the breakout condition you choose, the entry point (EP) will be calculated for you automatically. If you use the default settings, "Trend Bars Pro Signal + Trend" is preset as the breakout condition.
If you want to know more about the breakout conditions, go to our Breakout Conditions section to learn all about this feature.
2. Identify The Pattern
Add Harmonic Patterns Suite to your chart and look for harmonic chart patterns on the asset and timeframe of your choice.
You can also use the alerts to easy getting notified when a pattern is in the making or gets confirmed on the Symbol and timeframe of your choice. Please check out our Alerts section to learn how to use them.
With our Market Scanner you can search for harmonic patterns on up to 40 different symbols at the same time. Just get notified when a pattern is found, breaks out or is confirmed.
Visit our Chart Pattern Scanner section and learn how it works.
3. Place Your Order
When the price has reached the reversal zone and a reversal gets confirmed, place your order near the price level of the grey entry point line (EP) above point D if a bullish pattern got confirmed or under point D if a bearish pattern got confirmed (like in the figure above).
Our Pattern Statistics make it easy for you to see how successful a Pattern is on the Asset and timeframe you are watching. You should always check them out before entering a trade. Visit our Pattern Statistics to learn how to use and adjust them correctly.
4. Set Stop-Loss And Take-Profit
Set your stop-loss at the price level of the red stop-loss line (SL). Set your take-profit at the price level of one of the green take-profit-lines (TP1, TP2,). Take into account that your risk/reward ratio (R) was calculated on the basis of TP1.
Enhance the precision and effectiveness of your stop-loss and take-profit orders by leveraging the Swing Statistics feature in our Swing Suite tool. Visit our How To Use Statistics section to gain valuable insights on how to utilize this tool to its full potential.
Use our build in risk management feature to optimize your trade. Check out our Risk Management section if you want to know how it works.
5. Monitor Your Trade
Once you've entered the trade, monitor it closely. Adjust your stop loss and profit target as the price moves, and consider exiting the trade if the price starts to move against you.
Utilize the Trend Bars Pro to effectively monitor your trades. Discover the inner workings of this tool by referring to the designated section How To Use Trend Bars Pro.