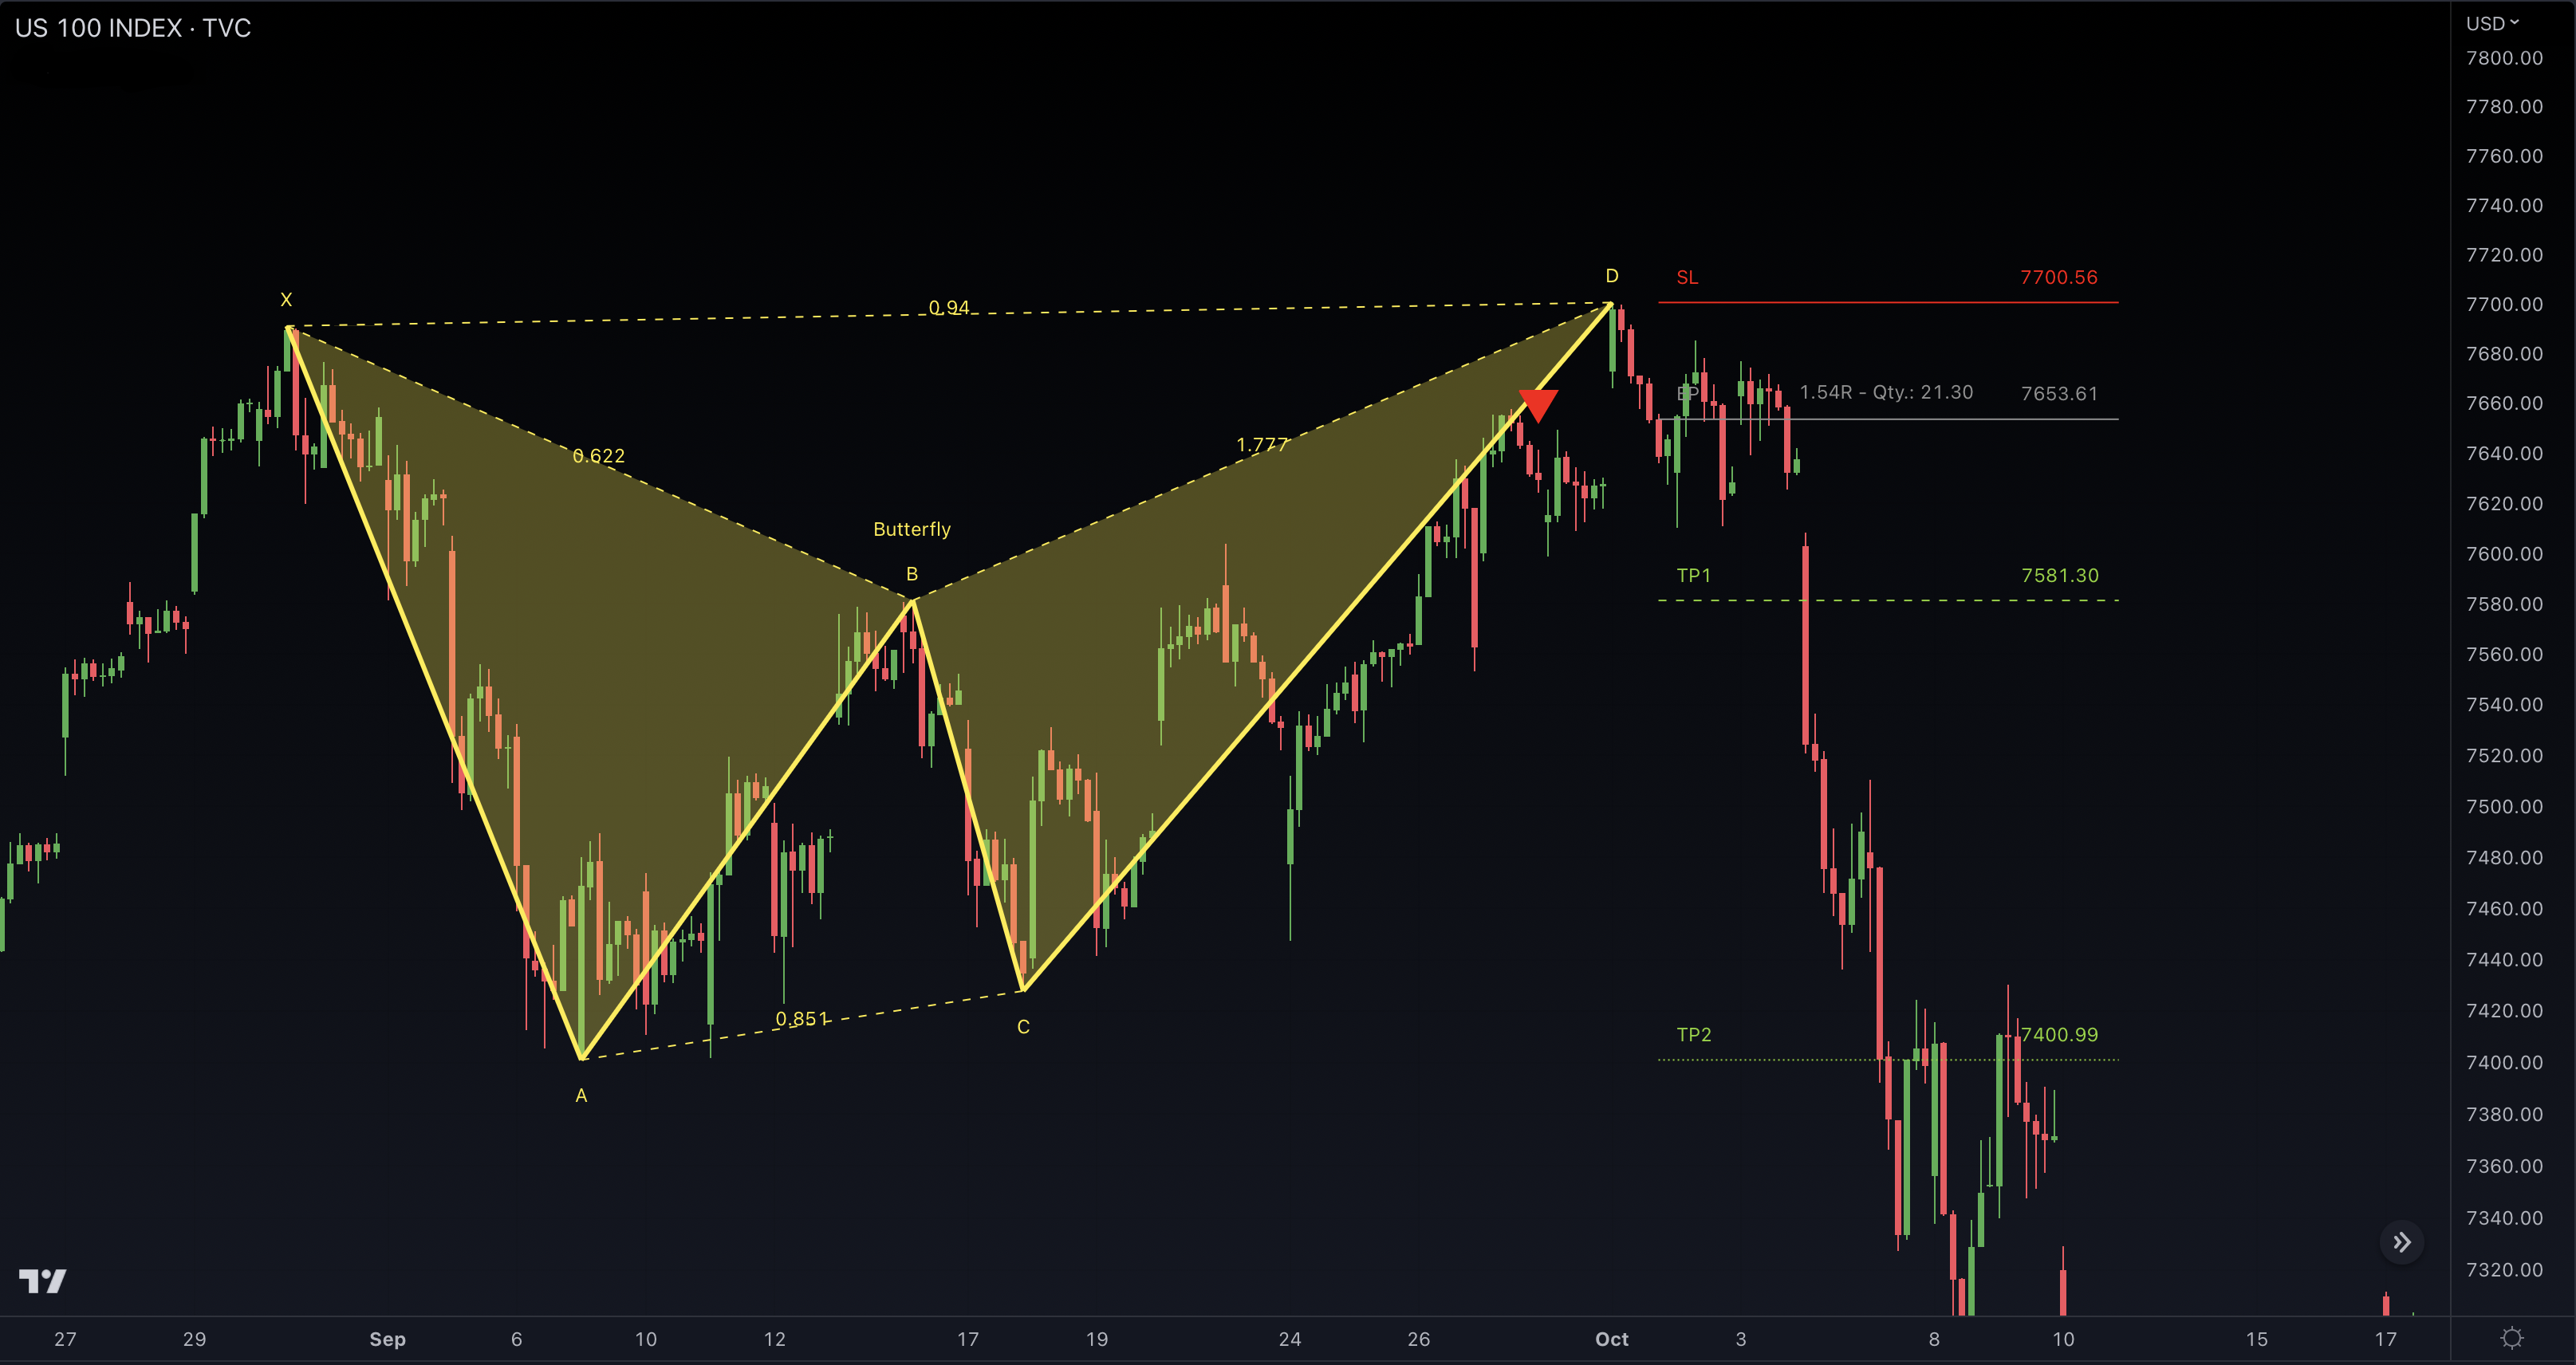
Butterfly Pattern

The Butterfly pattern is a popular harmonic chart pattern used by traders to identify potential trend reversals in financial markets. This pattern is named after its unique shape, which closely resembles the wings of a Butterfly.
The Butterfly pattern consists of distinct price movements. It begins with an initial impulse leg, followed by a retracement that establishes the X point. Subsequently, another leg forms to create the A point, succeeded by a deeper retracement that constitutes the B point. The C point materializes with a retracement to either the 0.786 or 0.886 Fibonacci level of the initial impulse leg. Finally, the pattern concludes at the D point, which forms with a retracement to the 1.272 or 1.618 Fibonacci level of the XA leg.
Once identified, the Butterfly pattern can be used to pinpoint potential entry and exit points in the market. Additionally, the pattern can be utilized to set stop-loss and take-profit levels to manage risk and maximize profits.