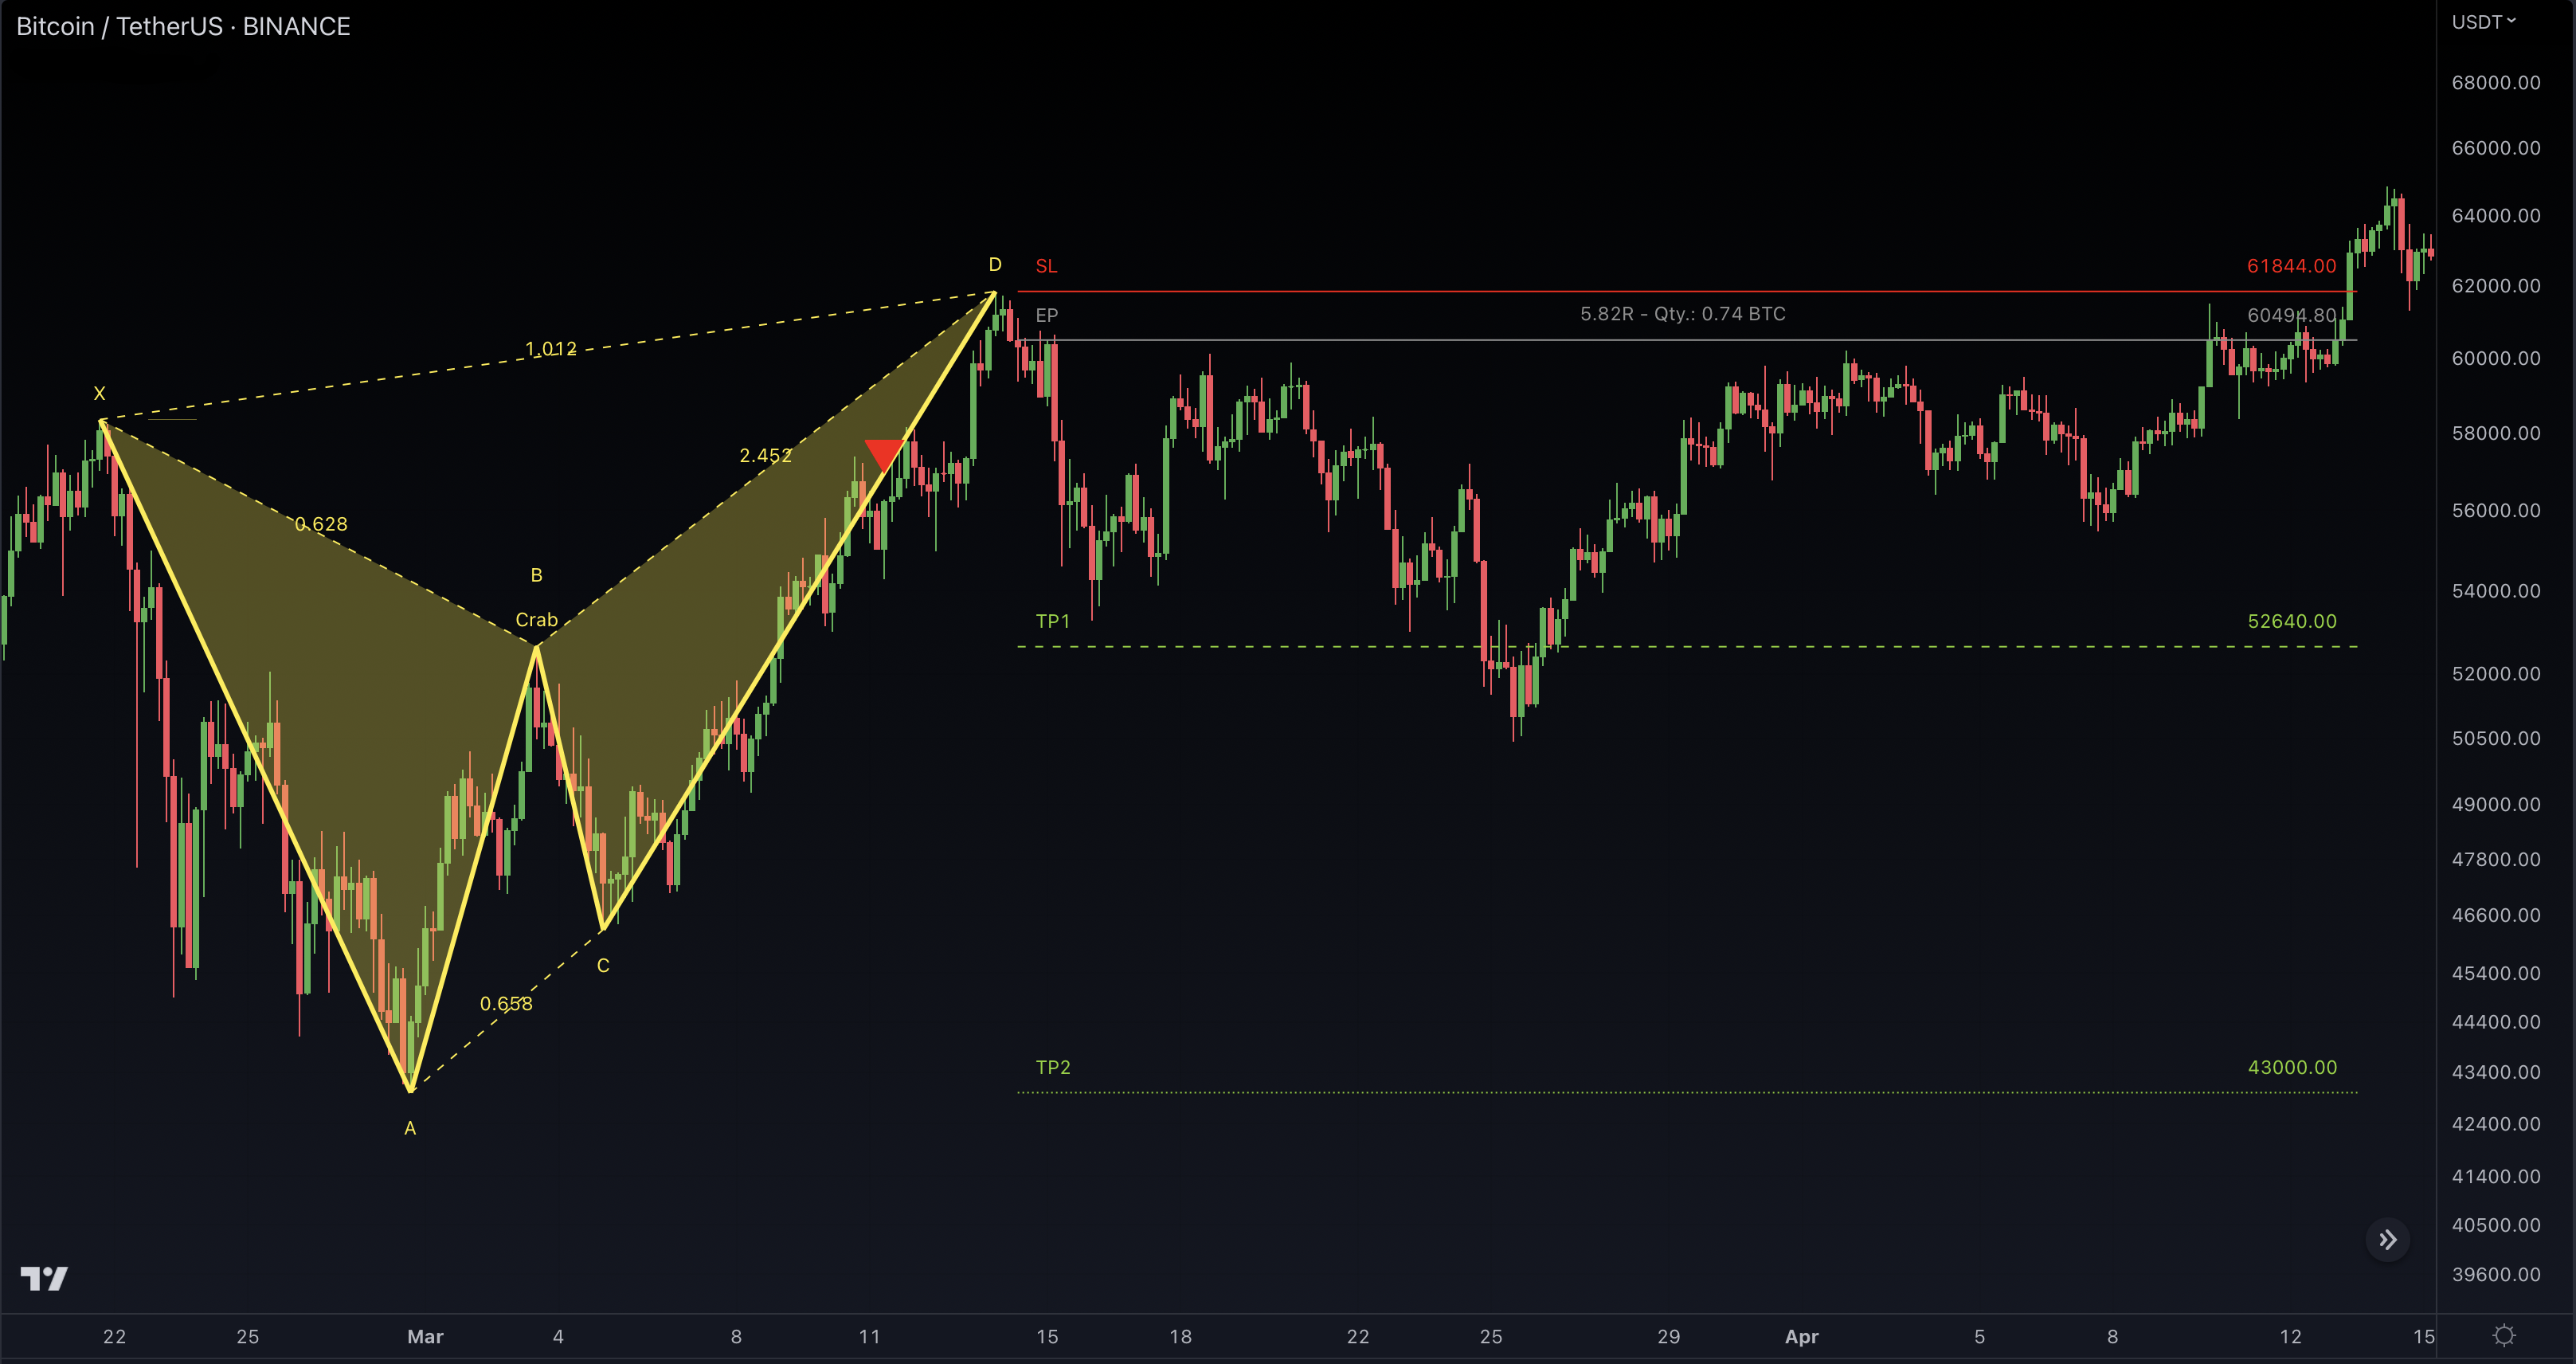
Crab Pattern

The Crab pattern is a widely used harmonic chart pattern. It is named after its resemblance to the sideways movement of a Crab, where the price action moves horizontally for an extended period before resuming its trend.
The Crab pattern emerges through a distinctive series of price movements. It commences with an initial impulse leg, accompanied by a retracement that establishes the X point. Subsequently, another leg develops to form the A point, followed by a deeper retracement that defines the B point. The C point materializes with a retracement to either the 0.382 or 0.886 Fibonacci level of the XA leg. Finally, the pattern culminates at the D point, which emerges with a retracement to the 2.24 or 3.618 Fibonacci level of the BC leg.
Proficient traders who possess the ability to recognize the Crab pattern can leverage it to identify potential market entry and exit points, as well as establish appropriate stop-loss and take-profit levels. It is worth noting, however, that the Crab pattern is relatively less prevalent compared to other harmonic patterns like the Gartley and Butterfly patterns. Accurately identifying the Crab pattern may necessitate a higher level of skill and expertise. Fortunately, with Harmonic Patterns Suite, this task is alleviated as the platform handles the intricate work on your behalf.