Swing Suite Introduction
The TRN Swing Suite is a powerful technical analysis tool designed to identify and highlight significant price movements in the market. It helps traders visualize price action and identify key turning points with precision.
Features
How Does Swing Suite Work?

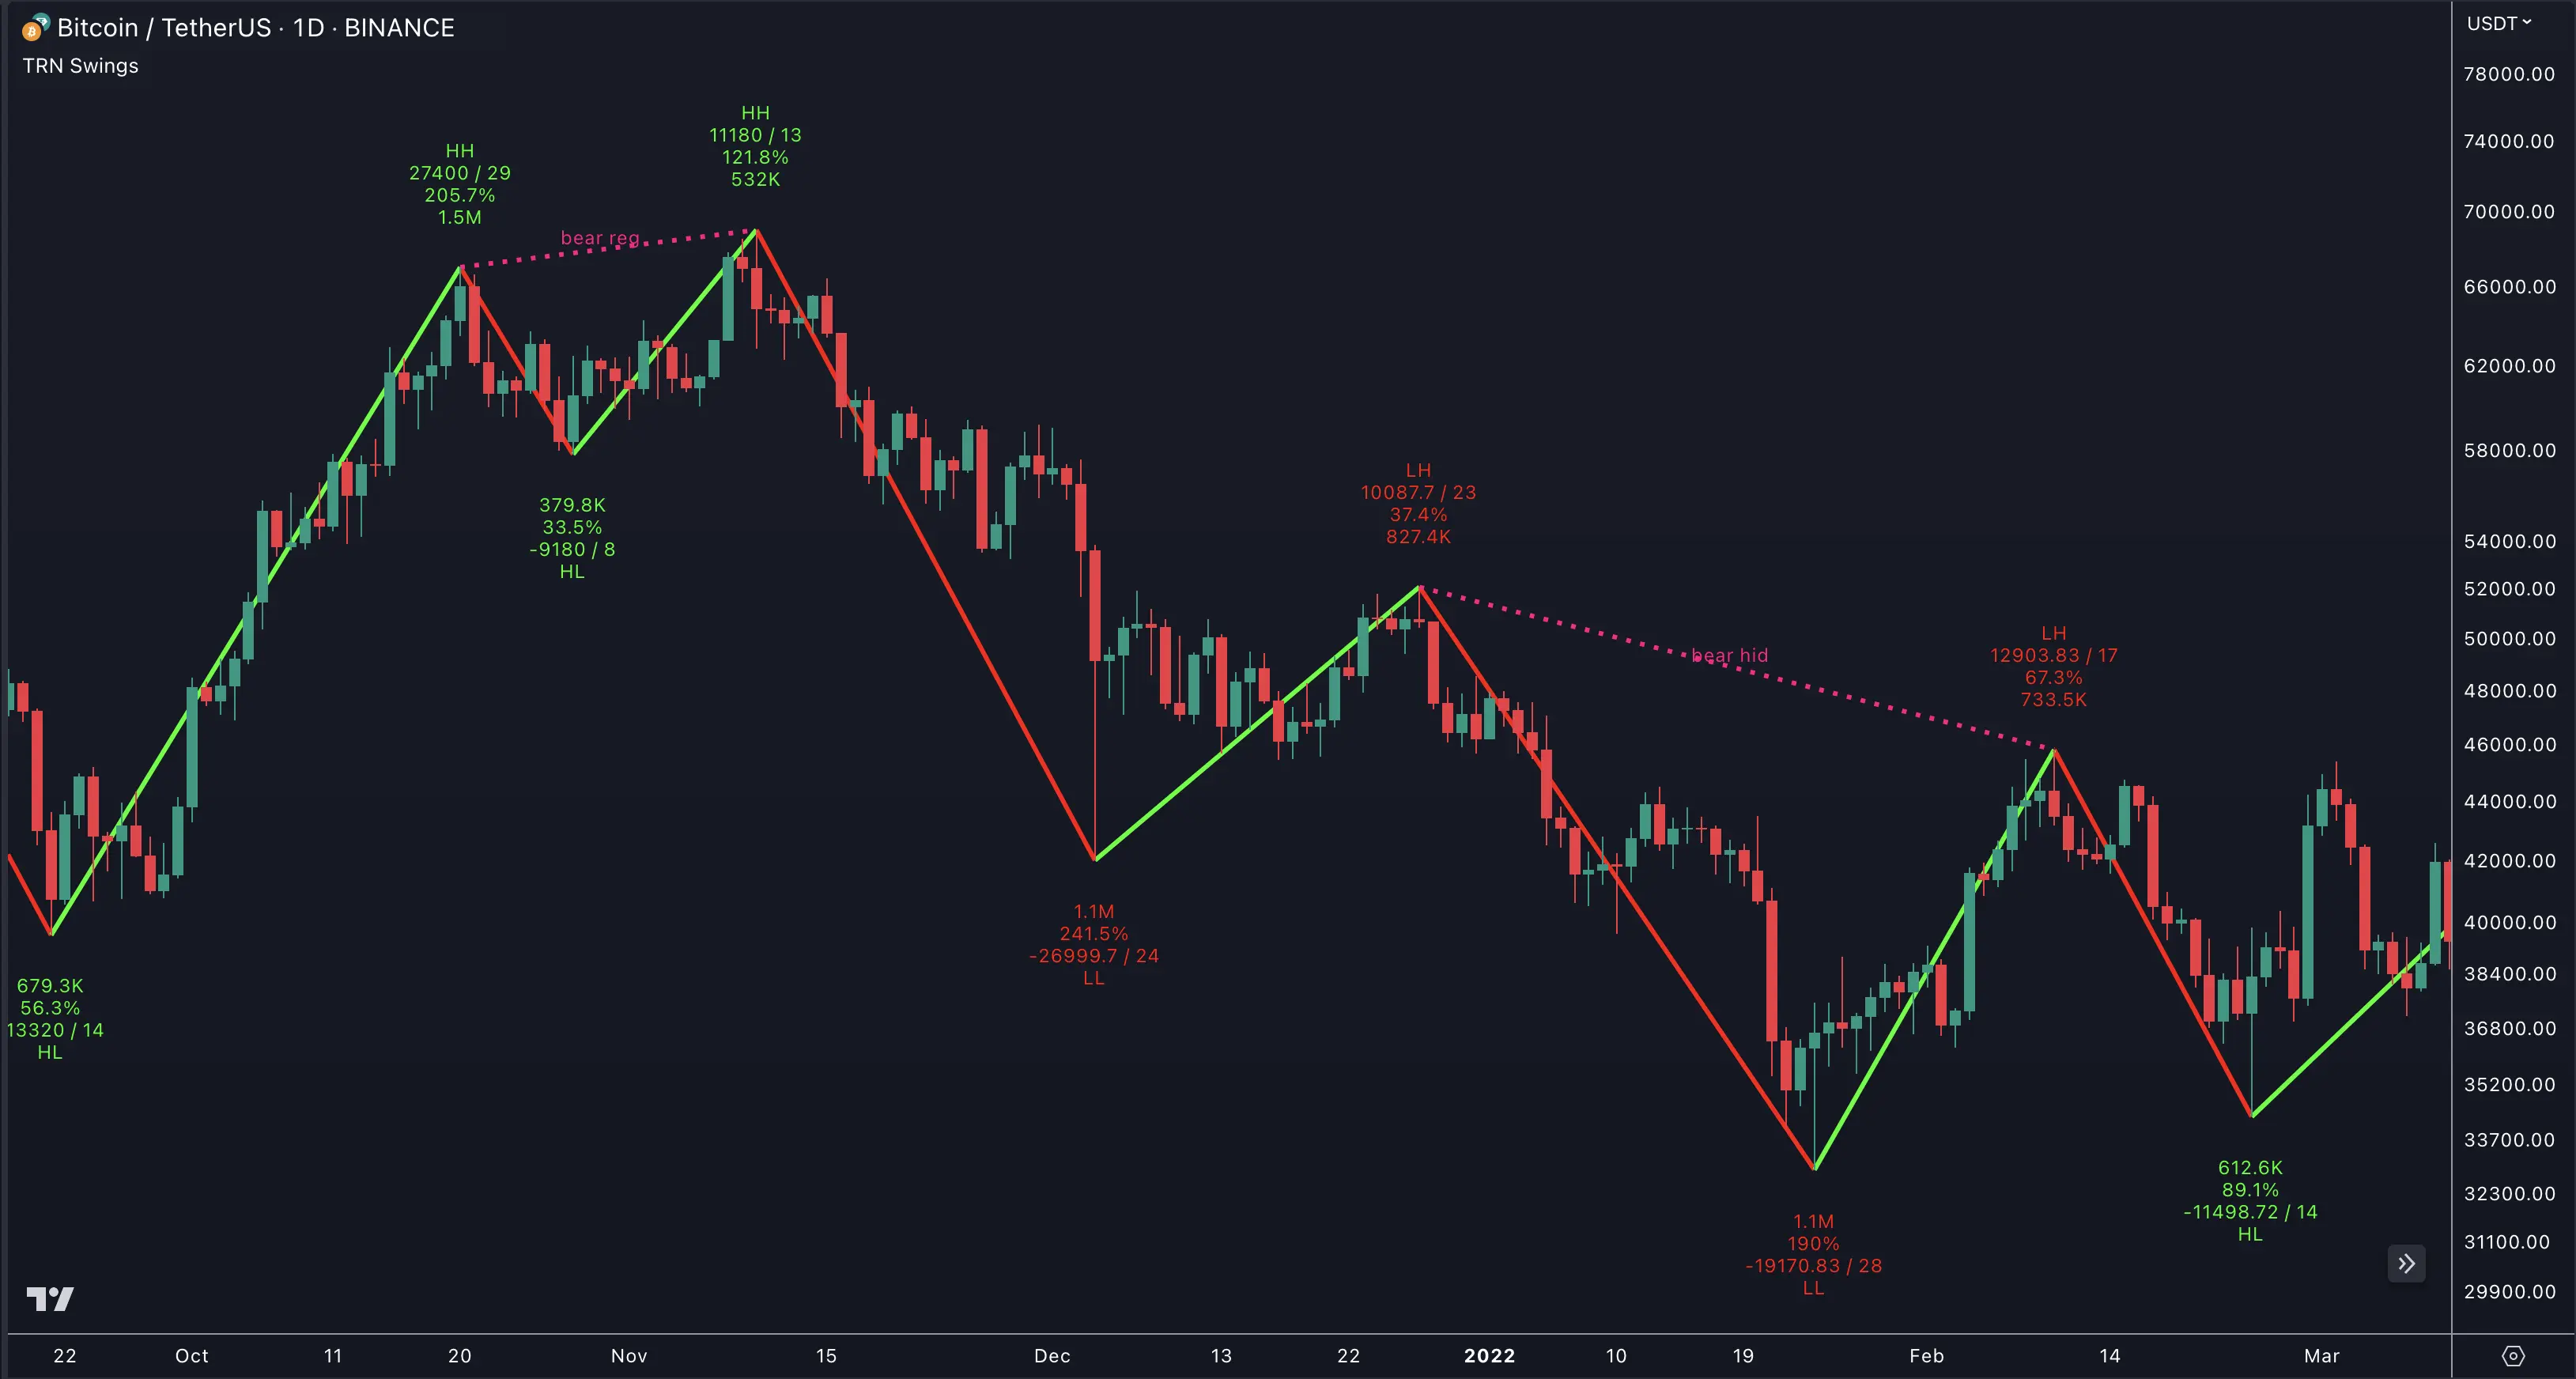
The indicator typically plots lines or markers on a price chart to indicate the swings. It marks the swing highs (peaks) and swing lows (troughs) to create a visual representation of the price movement.
Here are some key features and uses of SMT/Divergence Suite:
Swing Highs And Lows
The indicator identifies and marks the swing highs and lows on a price chart, allowing traders to visually see the turning points in the market. Swing highs are peaks where the price temporarily stops rising and starts declining, while swing lows are troughs where the price temporarily stops falling and starts rising.
Trend Identification
By connecting the swing highs and lows, traders can identify and analyze the prevailing trend in the market. An uptrend is characterized by higher swing highs and higher swing lows, while a downtrend is characterized by lower swing highs and lower swing lows. The indicator helps traders visually assess the strength and continuity of the trend.
Support And Resistance Levels
The swing highs and lows can act as support and resistance levels. Swing highs may act as resistance levels where selling pressure increases, while swing lows may act as support levels where buying pressure increases. Traders often pay attention to these levels as potential areas for trade entries, exits, or placing stop-loss orders.
Pattern Recognition
The swings identified by the indicator can help traders recognize chart patterns, such as double tops, double bottoms, head and shoulders, or triangles. These patterns can provide insights into potential trend reversals or continuation patterns.
Trade Entry And Exit
Traders may use TRN Swing to determine potential trade entry and exit points. For example, in an uptrend, traders may look for opportunities to enter long positions near swing lows or on pullbacks to support levels. Conversely, in a downtrend, traders may consider short positions near swing highs or on retracements to resistance levels.
It's important to note that Swing Suite is a visual tool and does not provide specific buy or sell signals. It serves as a guide for traders to analyze the price structure and make informed trading decisions based on their trading strategy and additional technical analysis techniques as for example our TRN Chart Patterns or the Trend Bars Pro.
Combine Swing Suite signals with Trend Bars Pro for enhanced trading decisions.
FAQ
How accurate are the swing points identified by the Suite?
The Swing Suite uses advanced algorithms to identify swing points with high accuracy. However, it's recommended to confirm signals with other technical tools like Chart Patterns for better results.
Which timeframes work best with the Swing Suite?
The Swing Suite works effectively across all timeframes, from 1-minute to monthly charts. However, higher timeframes (4H, Daily) typically provide more reliable swing points for trend trading.
Can I integrate Swing Suite with other TRN indicators?
Yes! The Swing Suite works seamlessly with other TRN tools like Trend Bars Pro and Price Action Suite for comprehensive market analysis.