Rectangle Pattern Introduction
The consolidation and range pattern (rectangle pattern) is a powerful pattern in any market condition. Our indicator helps you spot high-probability trading opportunities with precision.
What Are Rectangle Patterns?
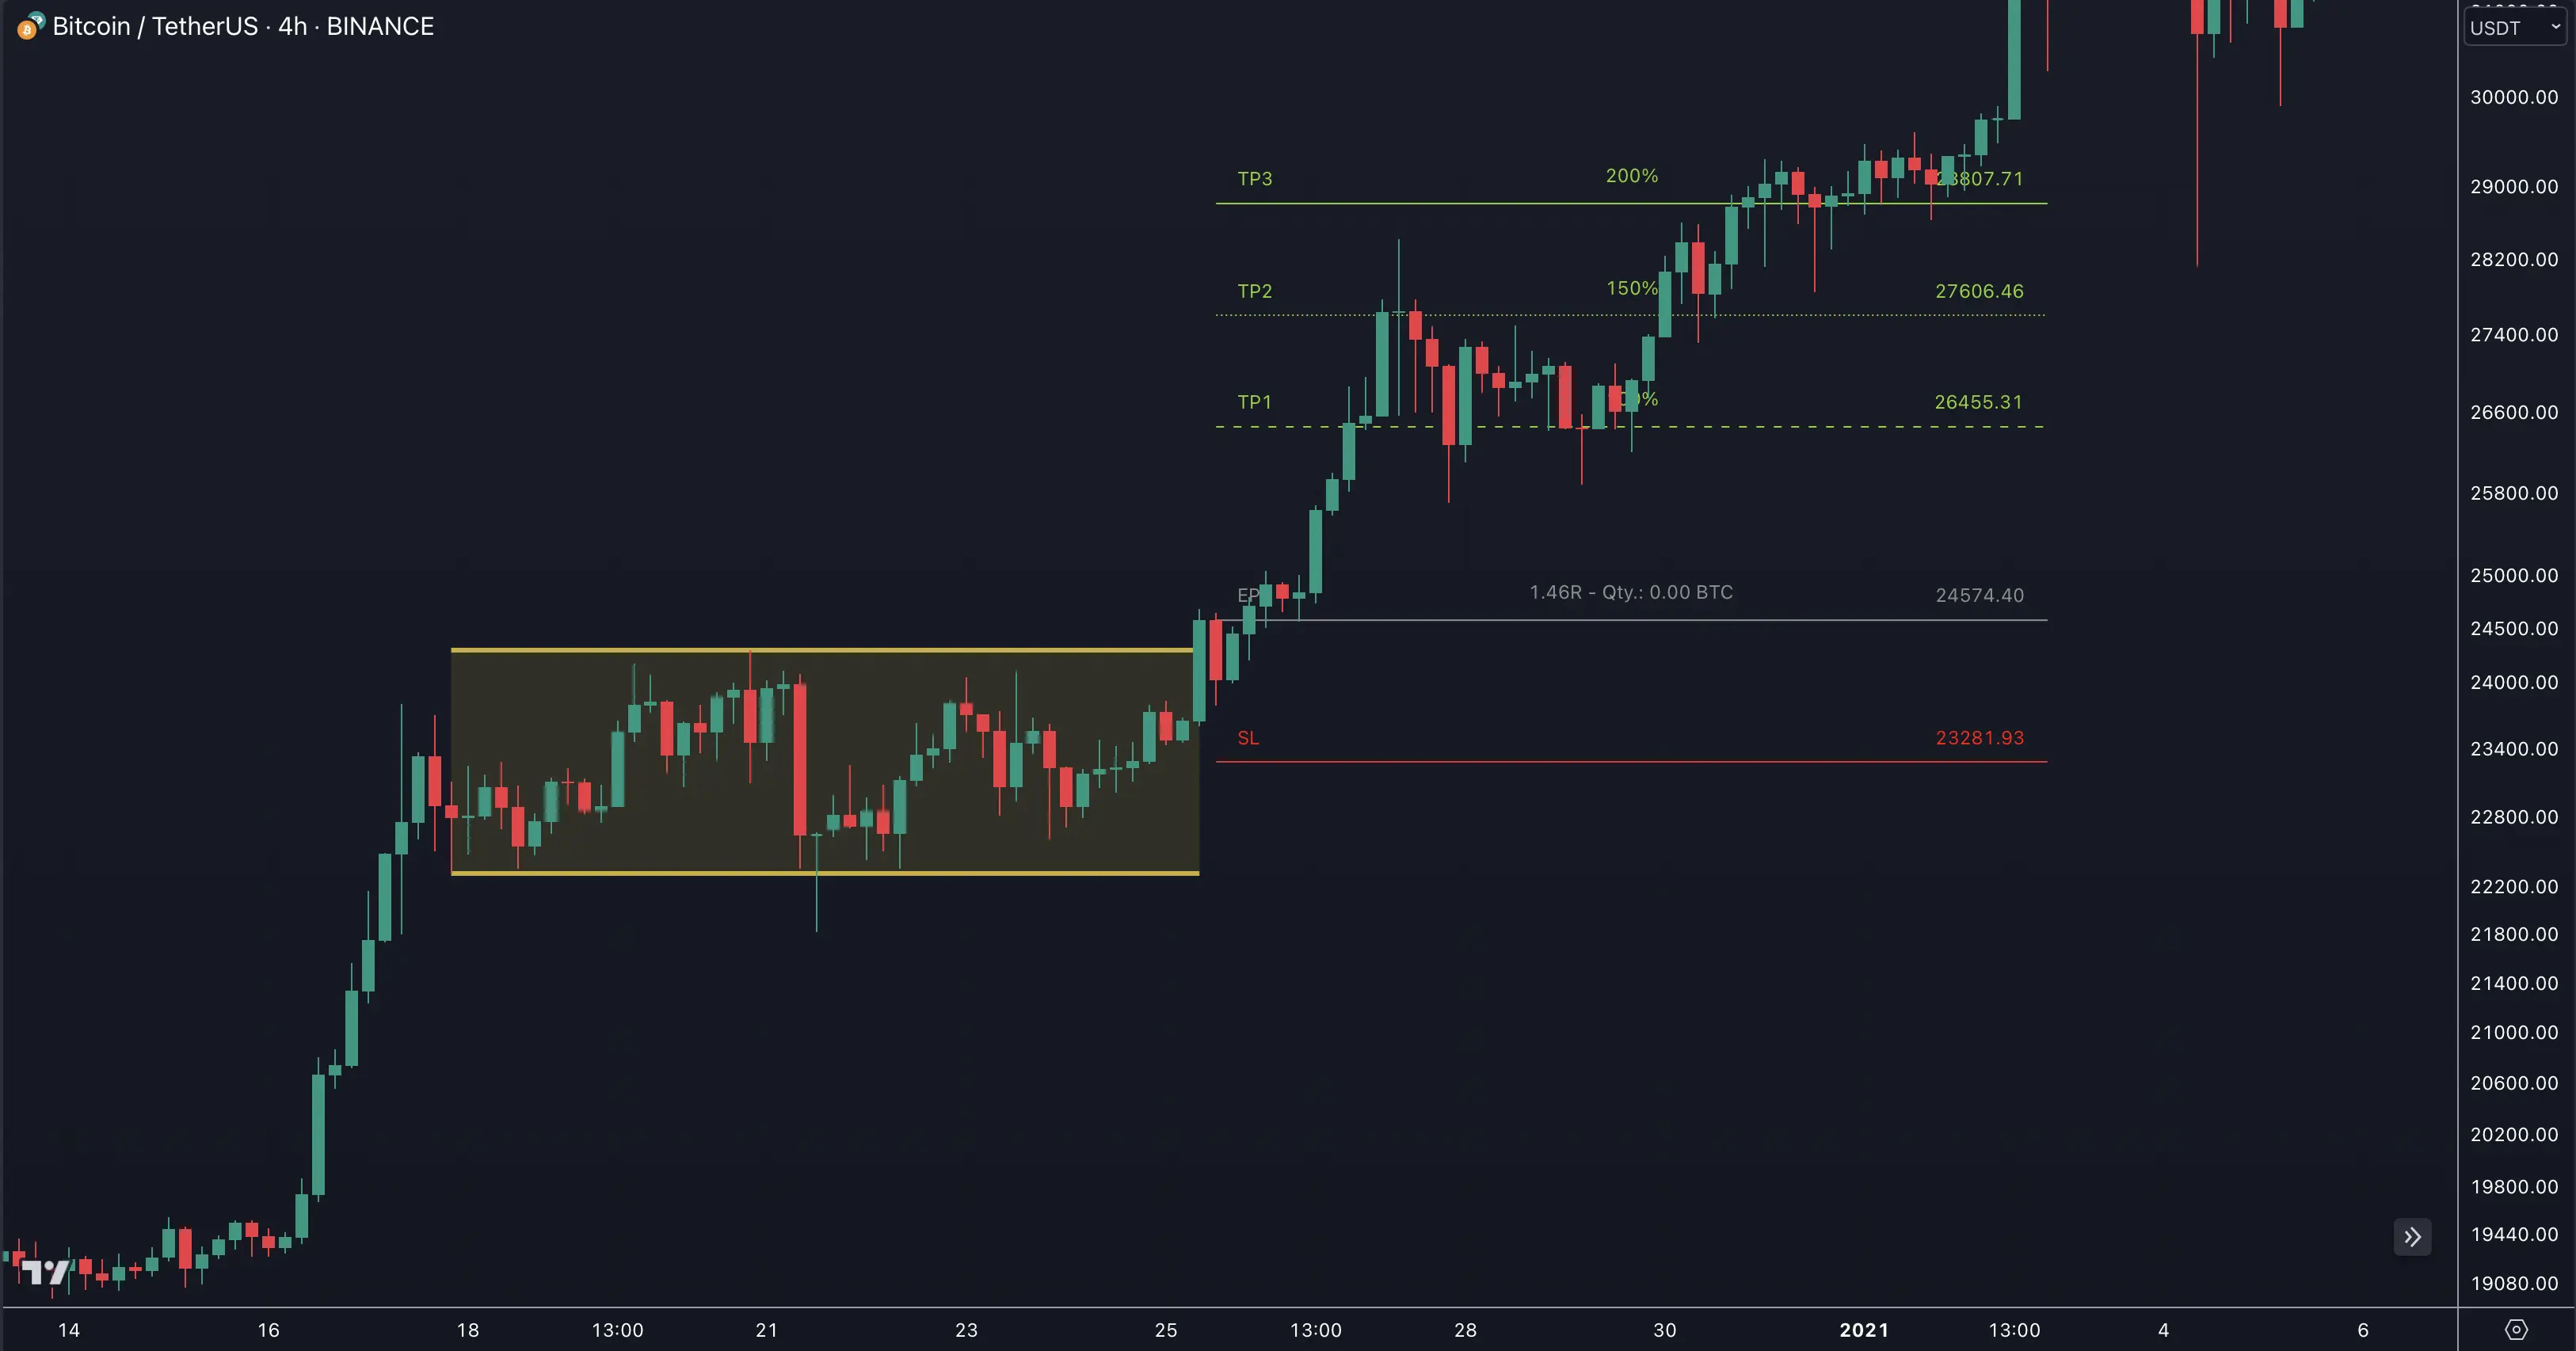
A rectangle pattern, also known as a trading range or consolidation pattern, appears when price moves between parallel support and resistance levels. These patterns signal market indecision and potential breakout opportunities.

Key Features
Quick Setup Guide
Our indicator uses two different swing sizes to identify rectangle patterns with precision:
Default Settings
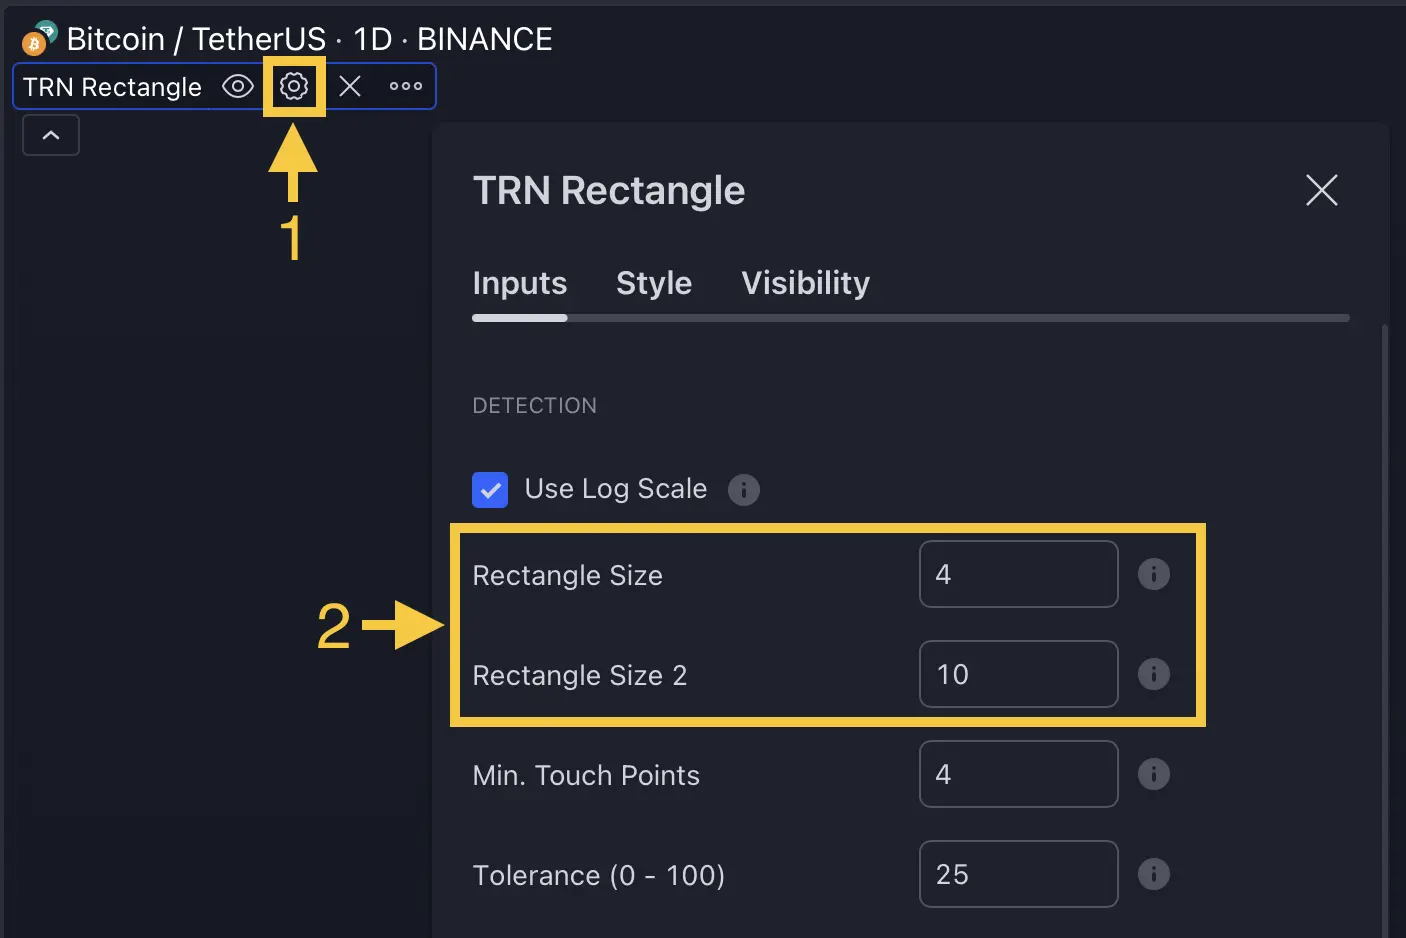
- Rectangle size 1: 4 (Shorter-term patterns)
- Rectangle size 2: 10 (Longer-term patterns)

Adjust swing sizes based on your trading timeframe - larger values for longer-term patterns, smaller for short-term trades.
Configuration Steps
- Open indicator settings (1)
- Navigate to "Detection" section (2)
- Adjust swing sizes according to your strategy
FAQ
What are the recommended settings for different timeframes?
For daily charts, start with the default settings. For intraday, consider reducing swing sizes to 2-6, and for weekly charts, increase to 8-15.
Can I combine this with other TRN tools?
Yes! Check our combinations guide for powerful setups using Trend Bars Pro and other tools.
How can I set up alerts for breakouts?
Visit our detailed alerts configuration guide to set up custom notifications for pattern breakouts and breakdowns.