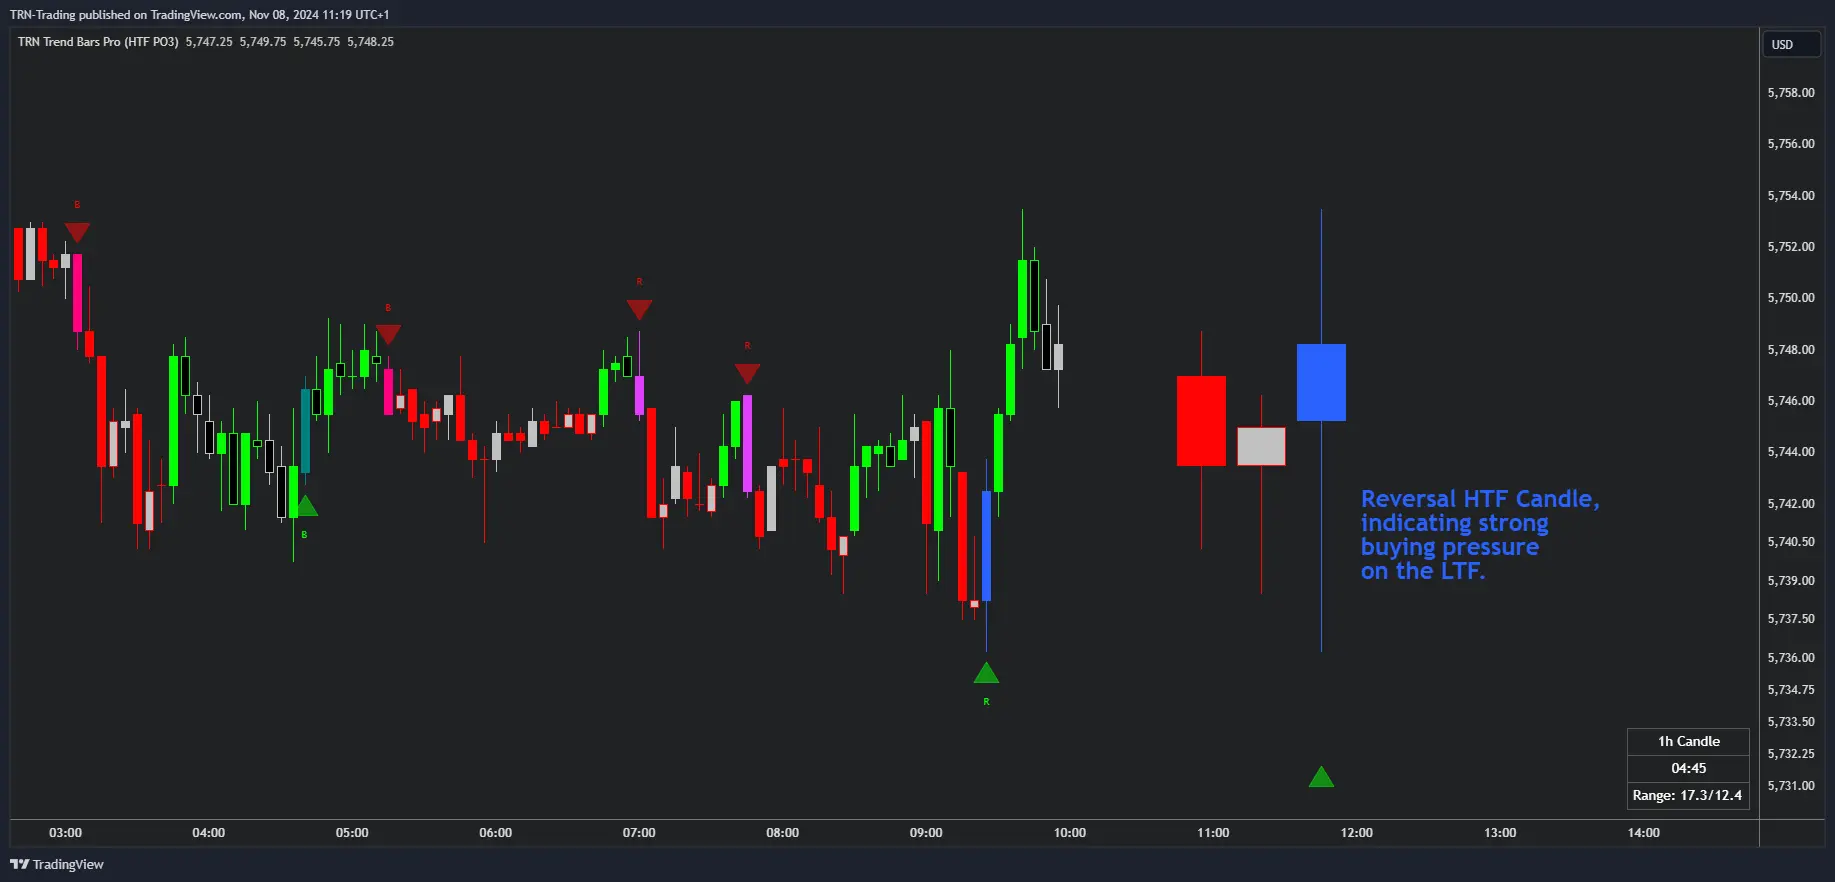
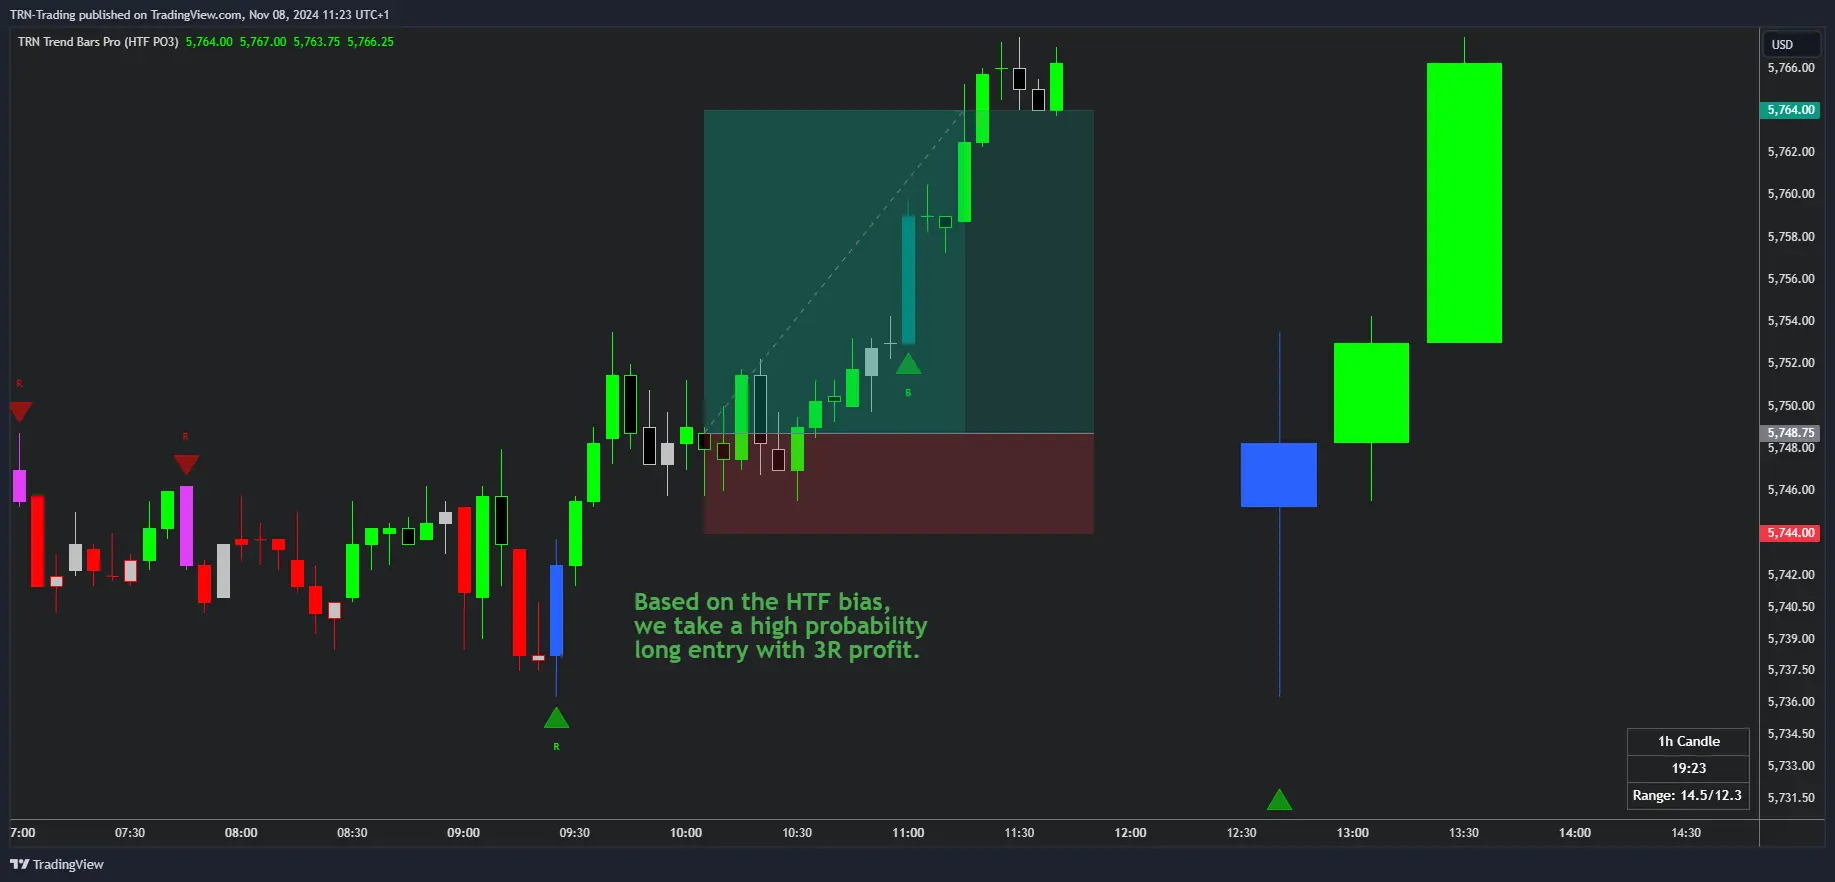
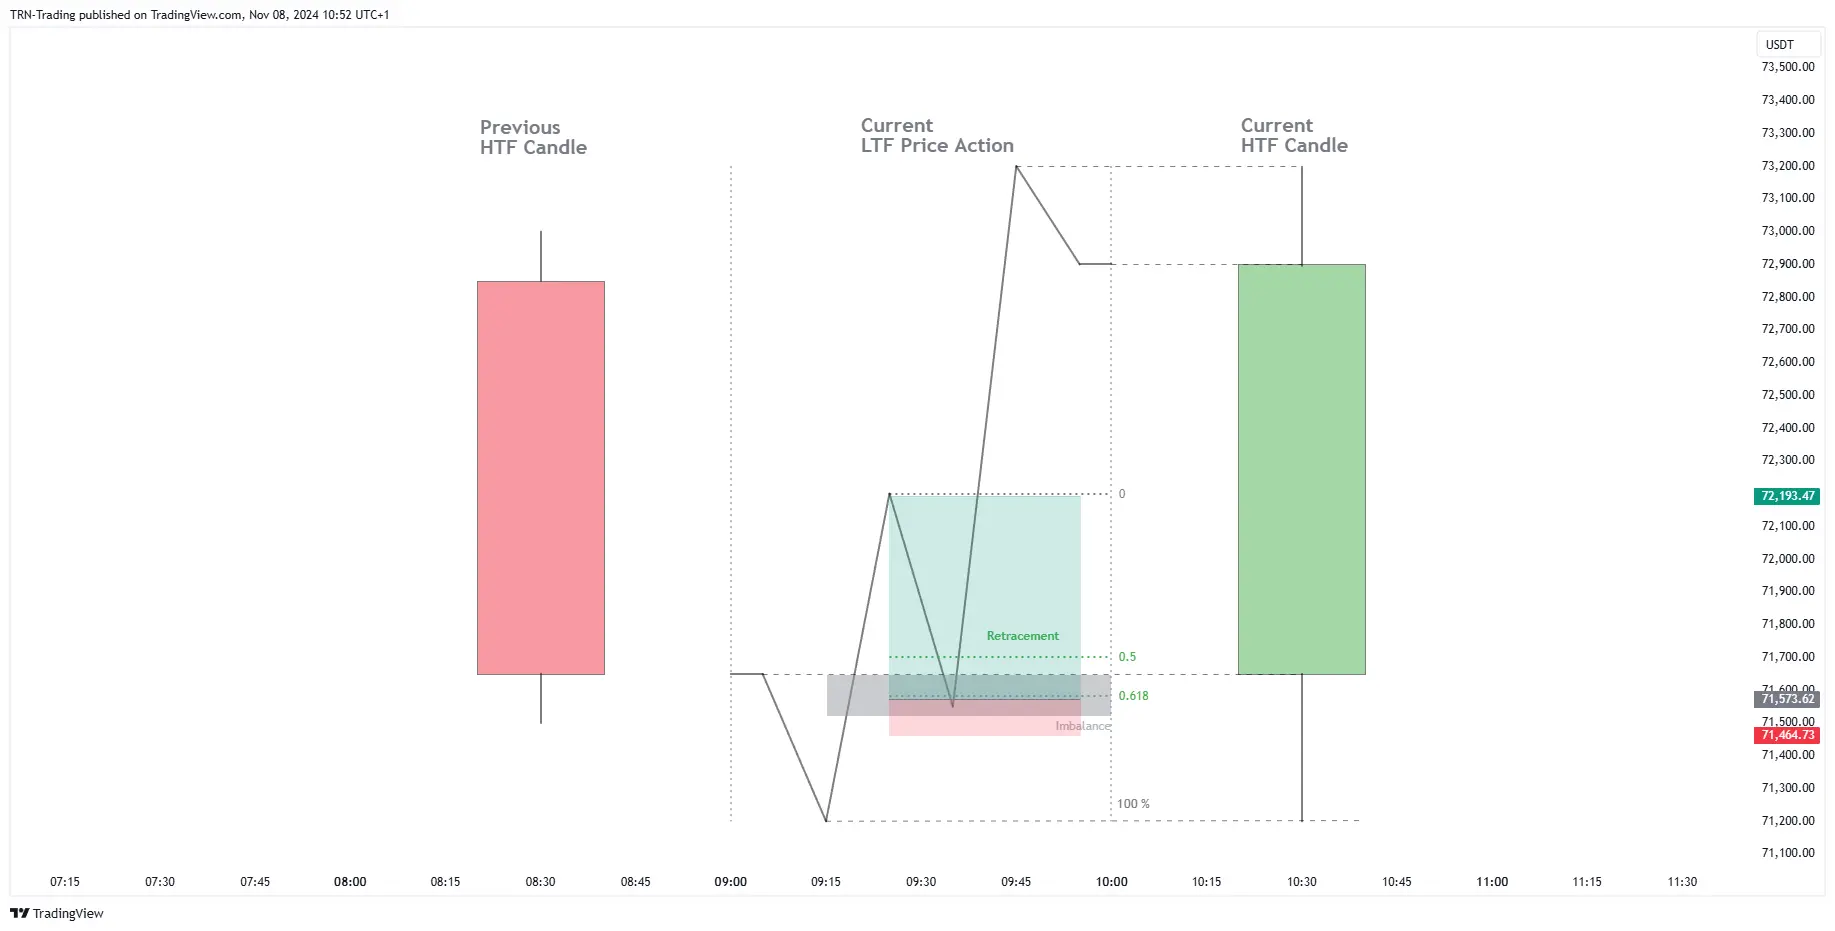
HTF PO3 Trading Strategy
The HTF PO3 (High Time Frame Power of Three) feature combines advanced trend analysis with institutional trading concepts. This powerful integration helps traders identify market direction and high-probability setups with unprecedented accuracy.
Market Bias Formation

Learn to form a directional bias using HTF PO3's unique combination of:
- Power of Three cycle analysis
- Advanced trend identification
- Institutional level recognition
High-Probability Trade Execution

Maximize your trading success by aligning:
- HTF PO3 market bias
- Trend and signal bar confirmation
- Optimal entry timing
Understanding HTF PO3
The High Time Frame Power of Three framework identifies the Smart Money Cycle through three distinct phases:
1. Accumulation Phase
- Market consolidation during off-peak hours
- Liquidity building process
- Institutional positioning
2. Manipulation Phase
- False breakout generation
- Stop-loss hunting
- Liquidity creation for distribution
3. Distribution Phase
- Primary directional moves
- Peak trading hour activity
- Higher volume and volatility patterns
Advanced Features
Real-Time Analysis Tools
-
HTF Candle Tracking
- Live higher timeframe monitoring
- Real-time pattern recognition
-
Multi-Timeframe Integration
- Stack up to 3 HTF instances
- Comprehensive market view
-
Advanced Visualization
- Display up to 20 HTF candles
- Clear trend identification
Strategic Tools
-
Trend Analysis
- HTF signal detection
- Trend strength measurement
-
Time Management
- HTF countdown timer
- Optimal entry timing
-
Risk Management
- HTF range analysis
- Average range calculations
Customization Options
-
Visual Preferences
- Adjustable candle sizing
- Custom chart layouts
-
Strategy Testing
- PO3 backtesting capability
- TradingView Replay integration
Trading Strategy Implementation

Long Trading Setup
-
Trend Identification
- Confirm uptrend using trend bars
- Validate HTF direction
-
Entry Strategy
- Wait for pullback completion
- Identify clear structure shifts
-
Risk Management
- Place stops below key levels
- Target 3:1 reward-to-risk ratio
FAQ
What's the best timeframe for HTF PO3 analysis?
HTF PO3 works best when analyzing 4H or daily charts for bias, then dropping to lower timeframes like 15M or 1H for entries.
Can I combine HTF PO3 with other indicators?
Yes! HTF PO3 works exceptionally well when combined with Dynamic Trend and Signal Bars for comprehensive analysis.
What's the key to success with HTF PO3?
Patience and discipline in waiting for all three phases (Accumulation, Manipulation, Distribution) to align before taking trades.