Dynamic Trend
The Dynamic Trend represents a revolutionary approach to trend analysis, combining elements from standard trend strength indicators (DI-, DI+, Parabolic SAR) with volatility indicators (ATR, Standard Deviation). This unique integration produces an adaptive moving average that responds dynamically to market volatility, offering superior precision compared to traditional moving averages.
Understanding Trend Strength

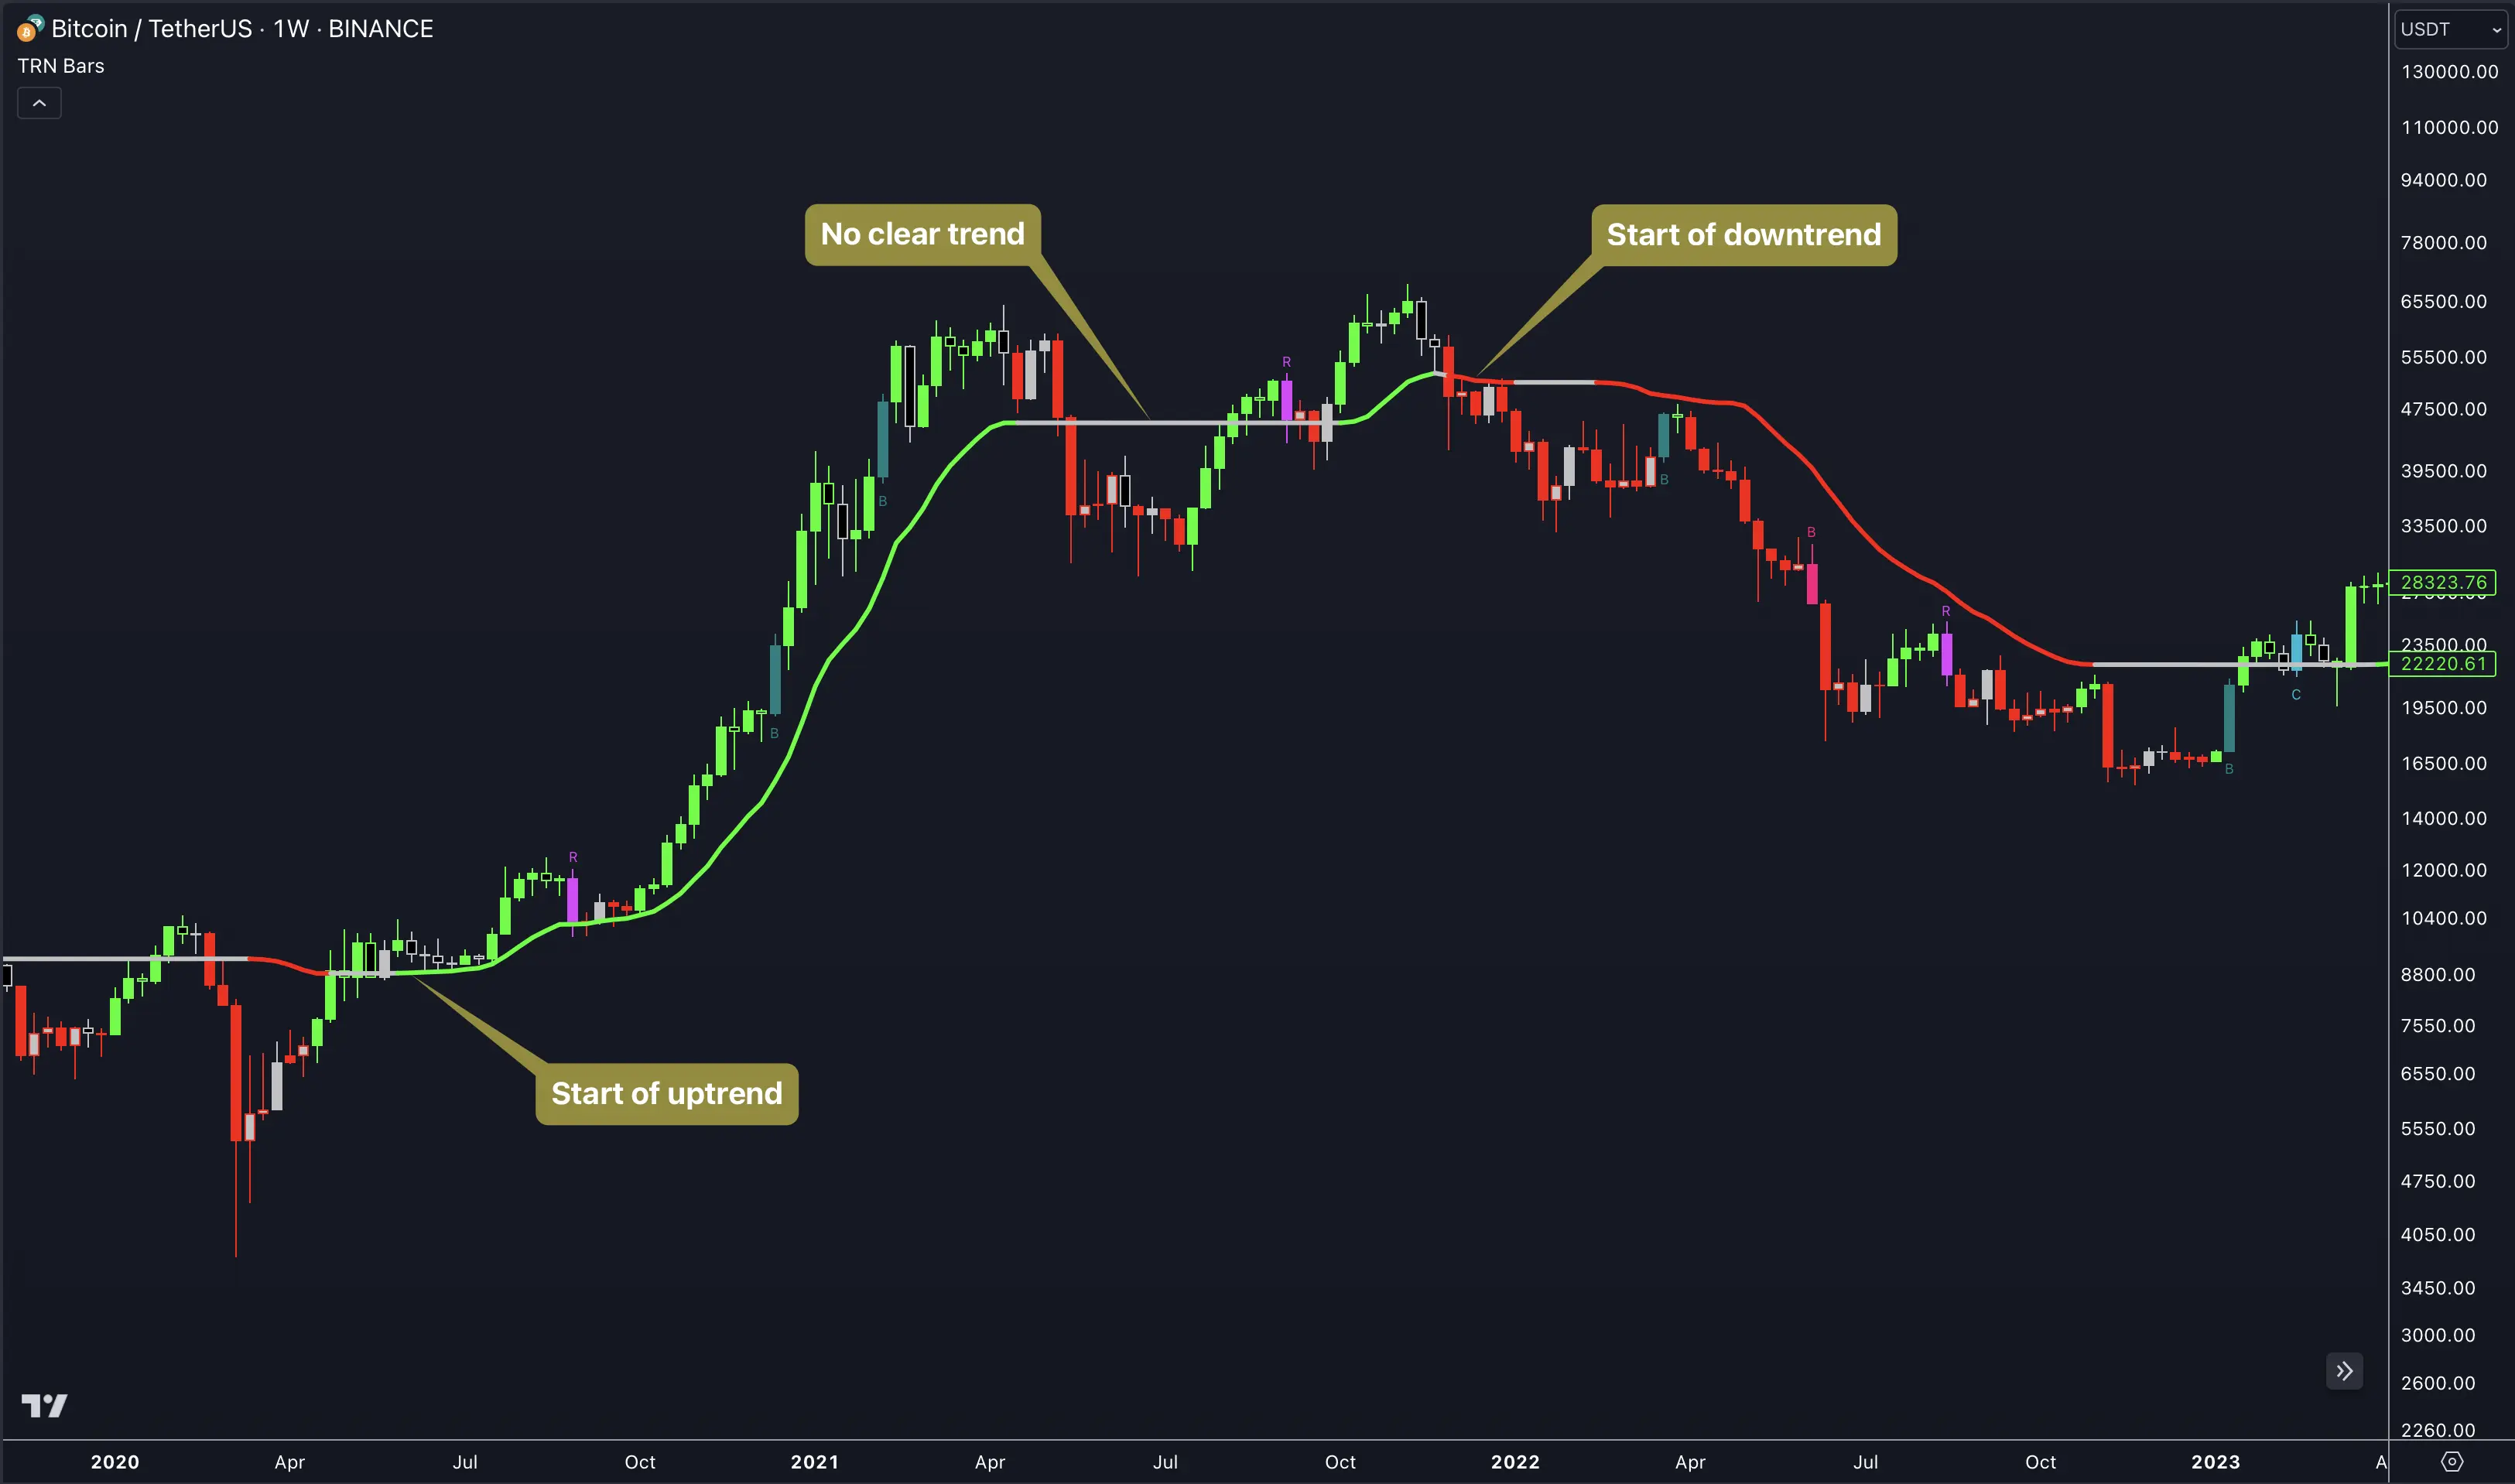
The Dynamic Trend provides clear visual signals:
- Green Line Rising: Indicates strong uptrend
- Red Line Falling: Signals sharp downtrend
- Gray Line: Represents neutral market conditions or low volatility
Trading Strategies
1. Trend Identification and Pullback Trading
Key signals to watch for:
- Bullish Pullbacks: Price retracement to green Dynamic Trend
- Bearish Pullbacks: Price retracement to red Dynamic Trend
- Signal Confirmation: Combine with TRN Signal Bars for stronger validation
2. Price Crossovers

Critical trading signals:
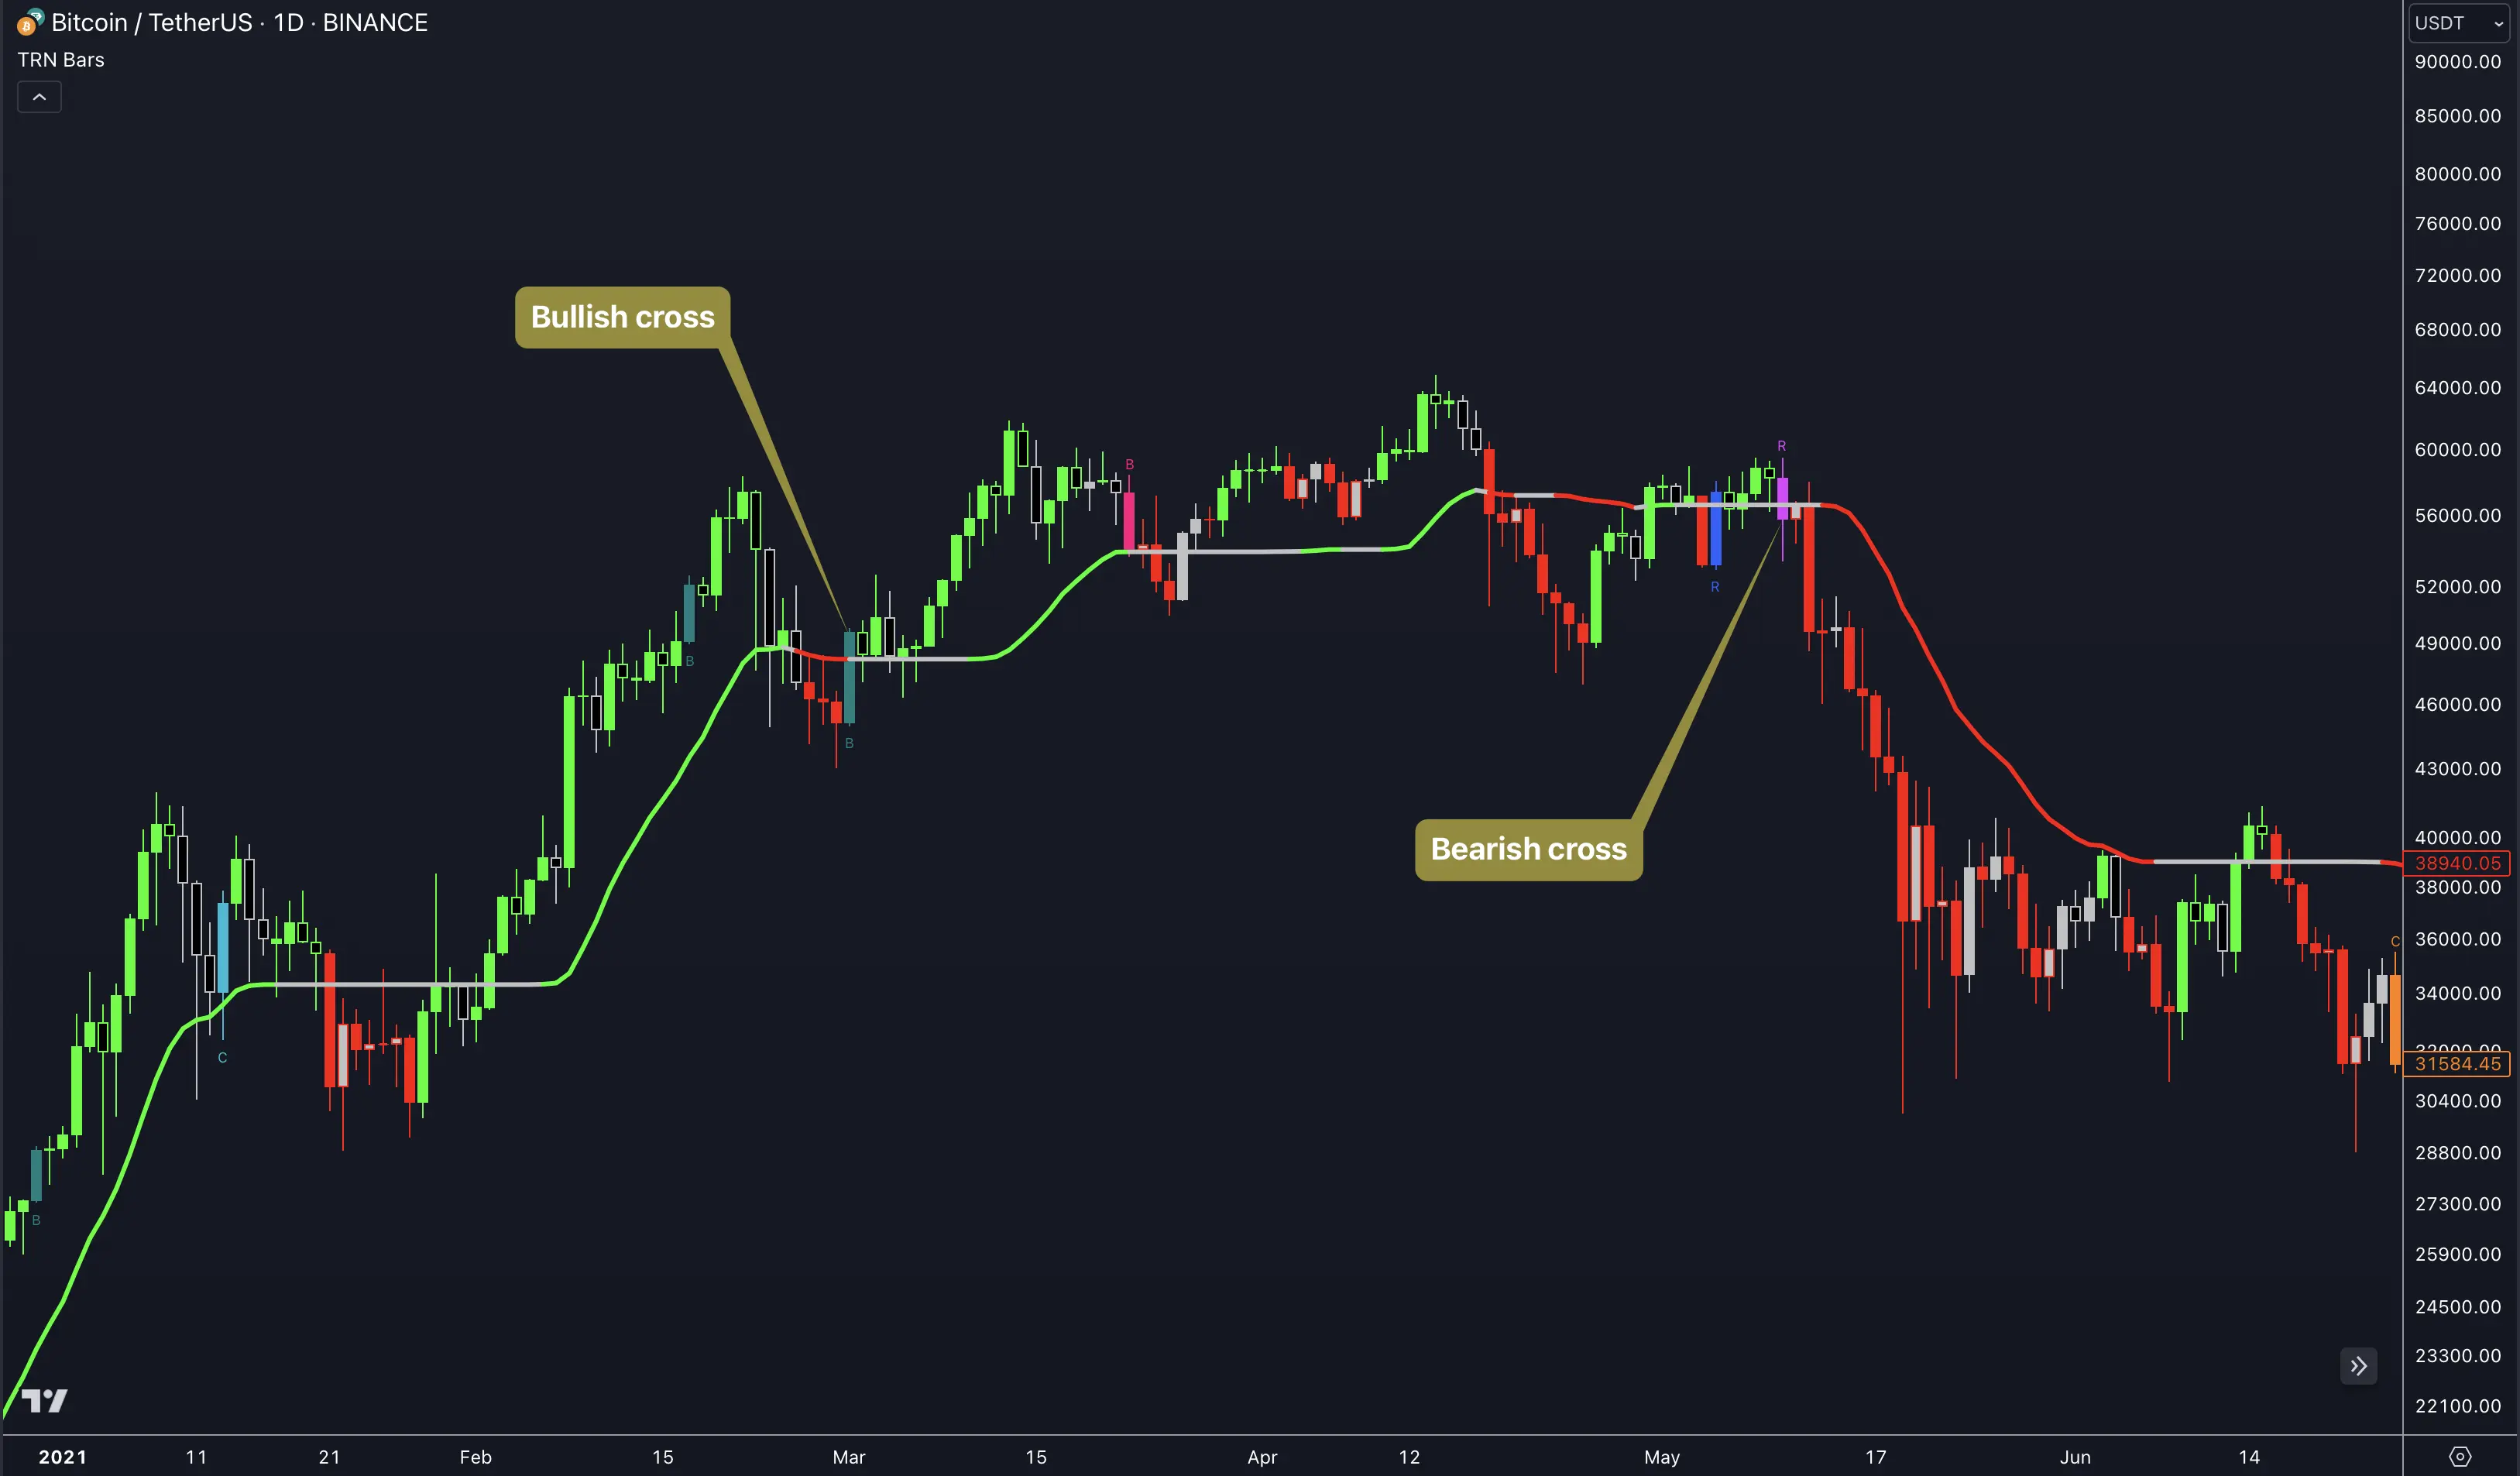
- Bullish Crossover: Price crossing above Dynamic Trend
- Bearish Crossover: Price crossing below Dynamic Trend
Use crossovers as potential exit signals for existing positions. For example, a bearish crossover can signal the right time to close a long position.
3. Market Noise Filtering
The Dynamic Trend excels at:
- Identifying choppy markets (gray coloring)
- Highlighting consolidation phases
- Suggesting optimal trade entry timing
4. Dynamic Stop Loss Strategy
Implement protective measures:
- Use as trailing stop loss
- Adjust position size based on trend strength
- Monitor color changes for risk management
FAQ
How is Dynamic Trend different from regular moving averages?
Unlike standard moving averages, Dynamic Trend adapts to market volatility and incorporates trend strength, providing more precise signals and reducing false breakouts.
Which timeframes work best with Dynamic Trend?
Dynamic Trend is effective across all timeframes but particularly shines in daily and 4-hour charts for swing trading, and 5-15 minute charts for day trading.
Can I combine Dynamic Trend with other indicators?
Yes! Dynamic Trend works exceptionally well when combined with Signal Bars and HTF PO3 for comprehensive market analysis.