Support and Resistance (Swing Suite)
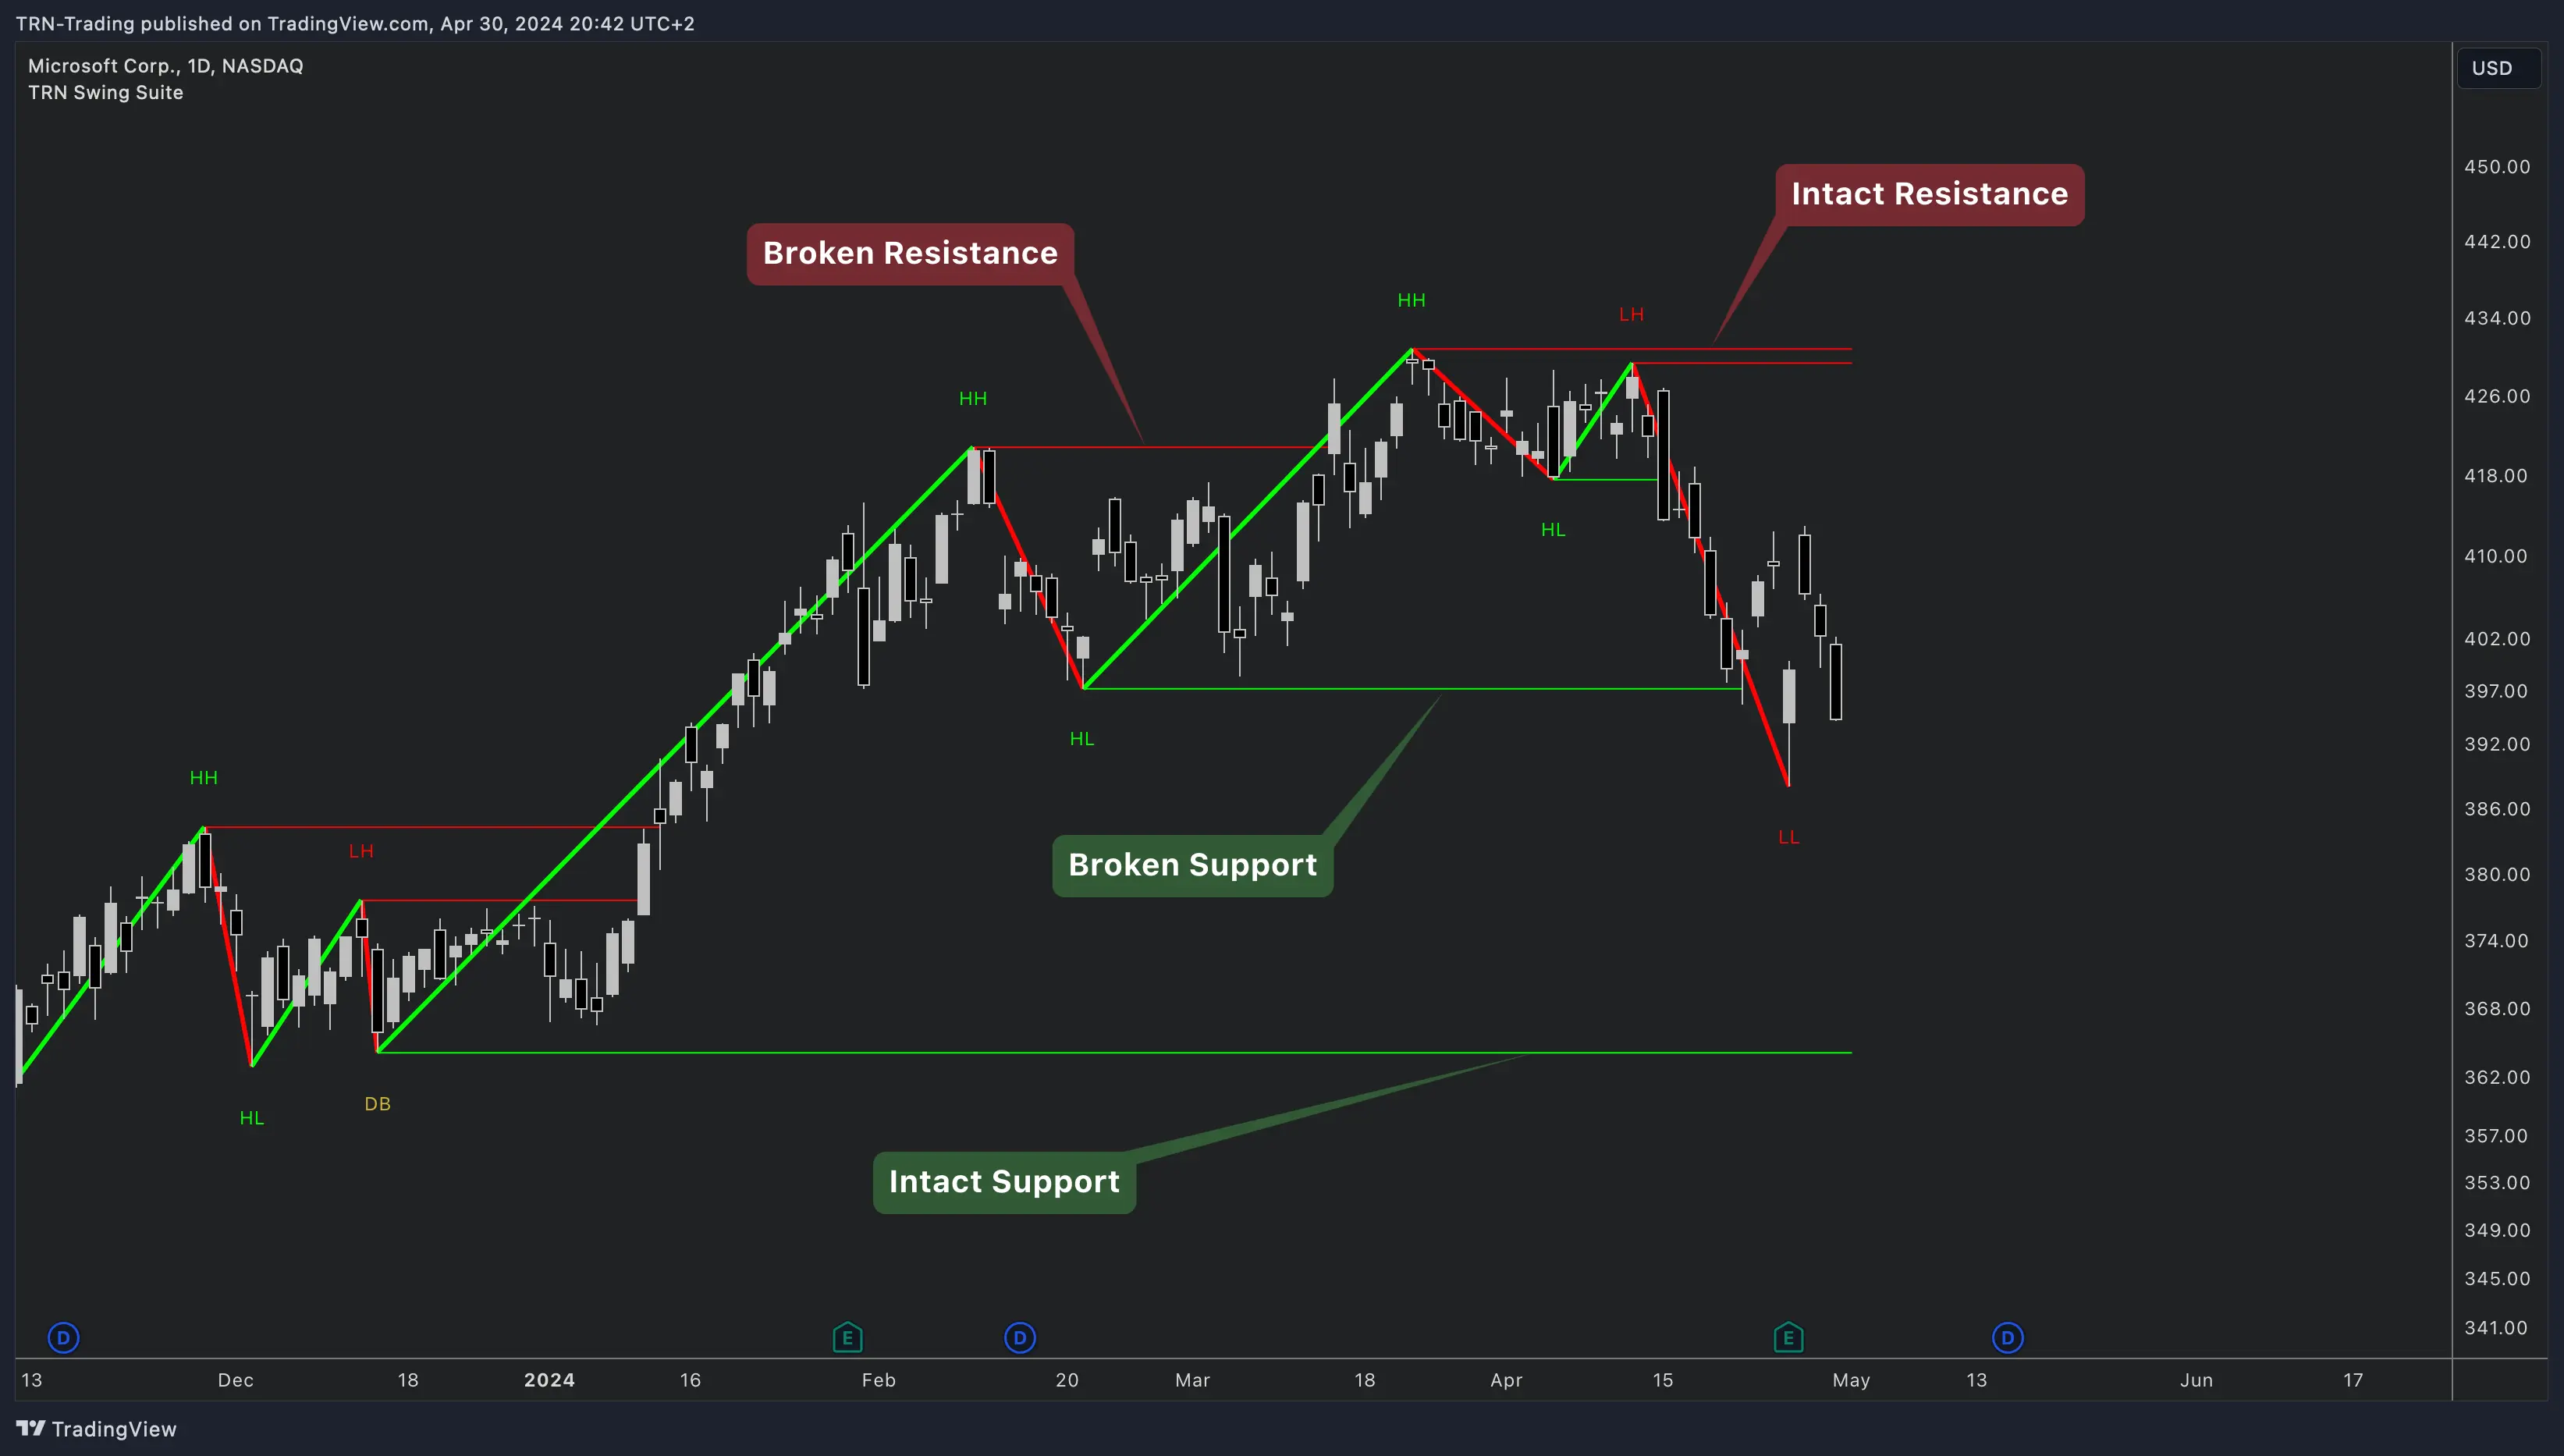
The Support and Resistance feature in the TRN Swing Suite provides powerful tools for identifying and trading key support and resistance levels. These levels are crucial for understanding market structure and making informed trading decisions.
Swing Support and Resistance Levels

Swing support and resistance levels are horizontal lines drawn from swing highs and lows. These lines represent key price barriers where the market tends to react. Historical swing highs and lows often contain significant liquidity. For instance, at a swing high:
- Traders may place stop-loss orders just above it.
- Breakout traders might enter long positions once price surpasses it.
- Turtle soup (reverse) traders could initiate short positions above it.
Multi-Timeframe Trend Analysis

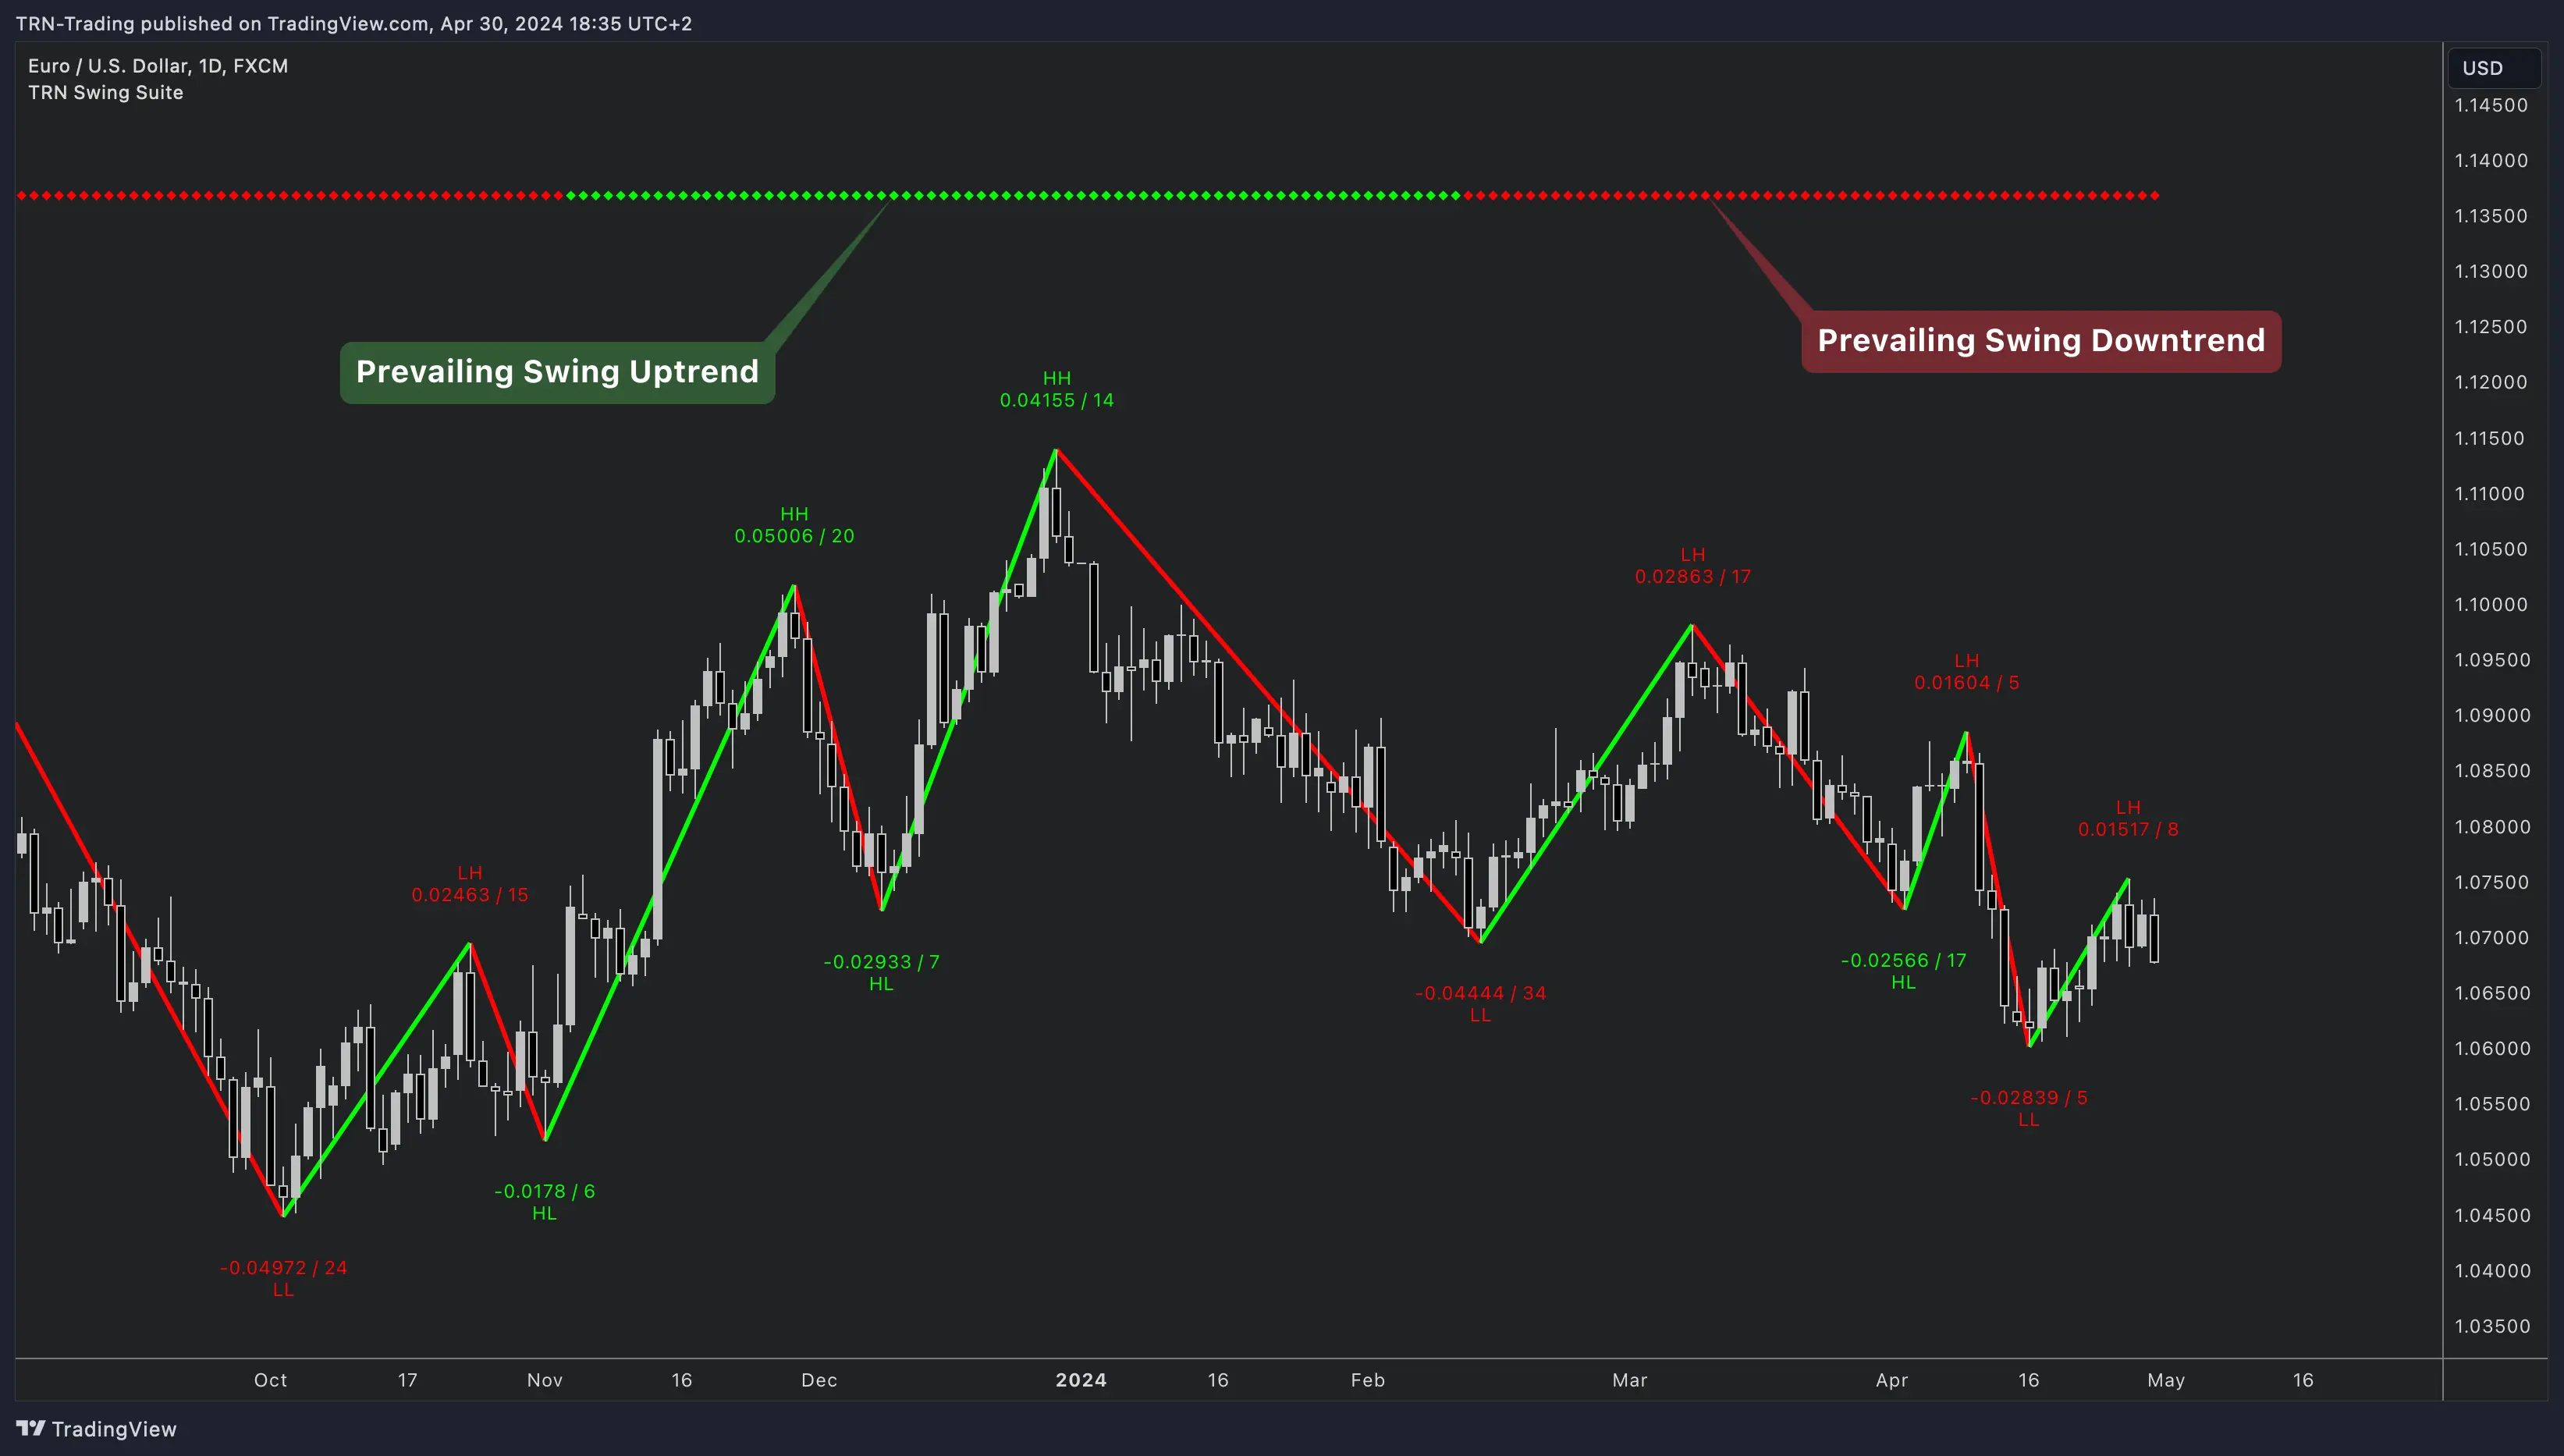
The TRN Swing Suite can display current swing trends of various sizes—medium and larger—either at the top or bottom of the chart. By offering a clear, multi-level perspective of the prevailing trend, this feature helps traders quickly assess market structure and identify potential trading opportunities.
Combine support/resistance levels with Order Blocks for enhanced trade entries and exits.
FAQ
How can I determine the strength of a support/resistance level?
The strength of a level is determined by multiple factors: the number of times price has reacted to it, the volume at those reactions, and whether it aligns with other technical tools like Market Structure.
Which timeframes work best for identifying support/resistance?
Higher timeframes (4H+) typically provide more reliable support/resistance levels. However, combining multiple timeframes helps identify the most significant levels where institutional traders are likely to be active.
How should I trade breakouts from these levels?
Wait for a clear breakout confirmation using Trend Bars Pro and volume analysis. False breakouts are common, so consider using the statistics feature to validate the probability of successful breakouts.