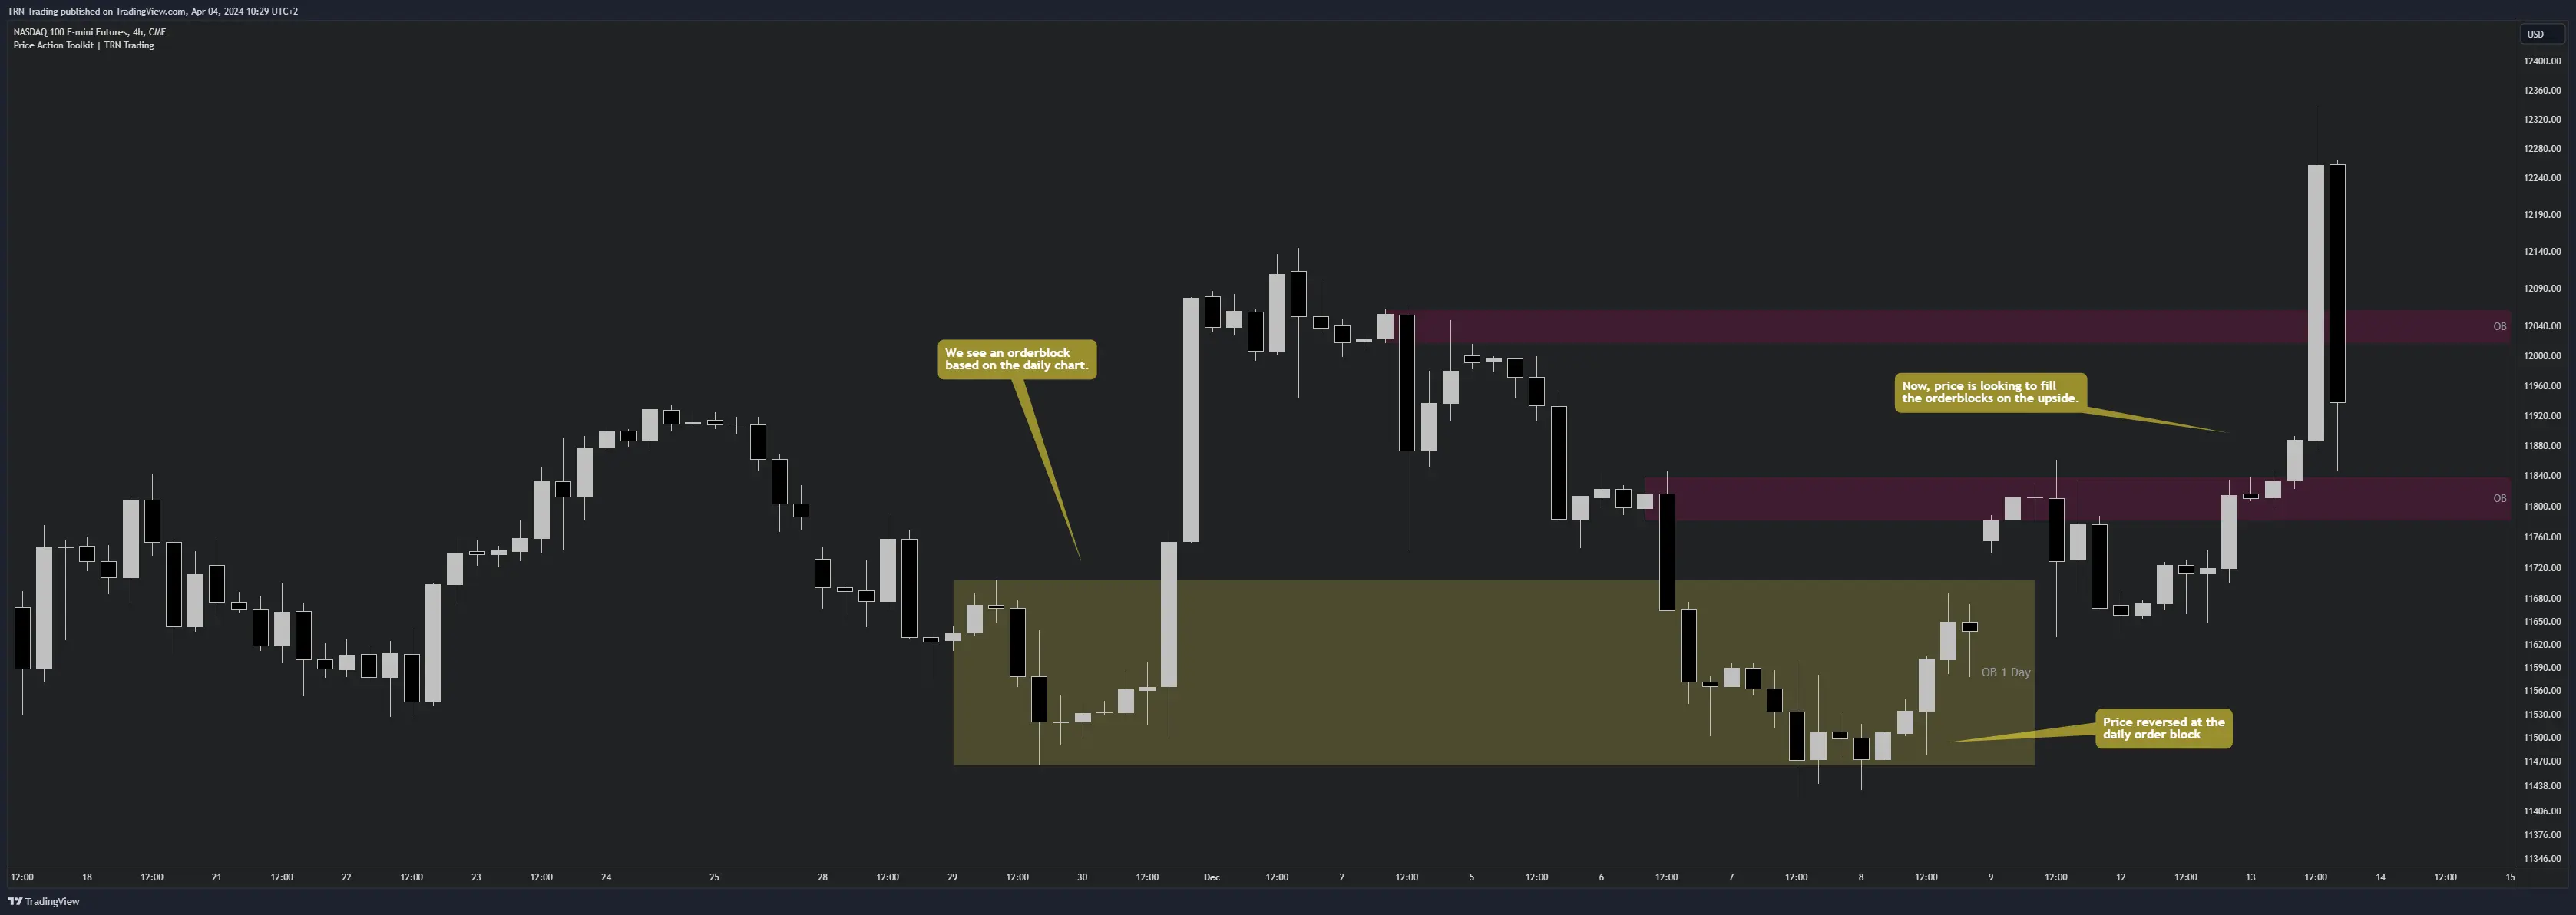
Order Blocks (OBs) with CVD
Order Blocks (OBs) represent zones where significant institutional orders were previously placed. These areas often act as support or resistance, reflecting underlying supply and demand imbalances in the market.

Understanding Order Blocks
Order Blocks serve as critical market structure elements:
-
Bullish Order Blocks
- Last bearish candle before upward move
- Potential support zones
- Buy-side liquidity pools
-
Bearish Order Blocks
- Last bullish candle before downward move
- Potential resistance zones
- Sell-side liquidity pools
Cumulative Volume Delta Integration
The integration of Cumulative Volume Delta (CVD) enhances OB analysis by:
- Measuring institutional order flow
- Confirming block validity
- Predicting price reactions
By integrating Cumulative Volume Delta (CVD) into the analysis of OBs, traders gain valuable insight into the strength and intent behind these zones. CVD measures the net difference between buying and selling volume, adding depth to OB interpretation. On each OB, the indicator displays two bars on the left side to represent cumulative buying volume in green and cumulative selling volume in red, while the ratio on the right side highlights the relative balance of buying and selling pressure. A ratio above 1 suggests a market favoring buyers, while a ratio below 1 indicates selling dominance. These details help traders confirm the validity of an OB and anticipate potential price movements with greater accuracy.
Volume Analysis Components
Each Order Block displays:
- Left side: Buy volume (green) and sell volume (red) bars
- Right side: Buy/sell volume ratio
Volume ratio interpretation:
- Ratio > 1: Institutional buying pressure
- Ratio < 1: Institutional selling pressure
Multi-Timeframe Analysis
Configure higher timeframe analysis through:
- Timeframe 1 settings (e.g., 4H)
- Timeframe 2 settings (e.g., 1D)
Combine Order Blocks with Fair Value Gaps for stronger trade confirmation.
FAQ
What exactly is an Order Block?
An Order Block is a zone where significant institutional orders were placed, typically the last opposing candle before a strong move. These areas often act as support/resistance and can trigger reversals or continuations.
How does CVD enhance Order Block trading?
CVD helps validate Order Blocks by showing the net institutional order flow. High volume ratios indicate strong institutional presence, while the buy/sell balance helps predict potential price reactions.
What's the best timeframe for Order Block trading?
While Order Blocks work on any timeframe, higher timeframe OBs (4H, Daily) tend to be more significant. Combining multiple timeframe OBs often provides the strongest trading opportunities.