Divergence Detection (Swing Suite)
The TRN Swing Suite is a powerful tool for identifying divergences between price and technical indicators. It works with any given indicator, even custom ones, and includes 11 built-in oscillators for maximum flexibility.
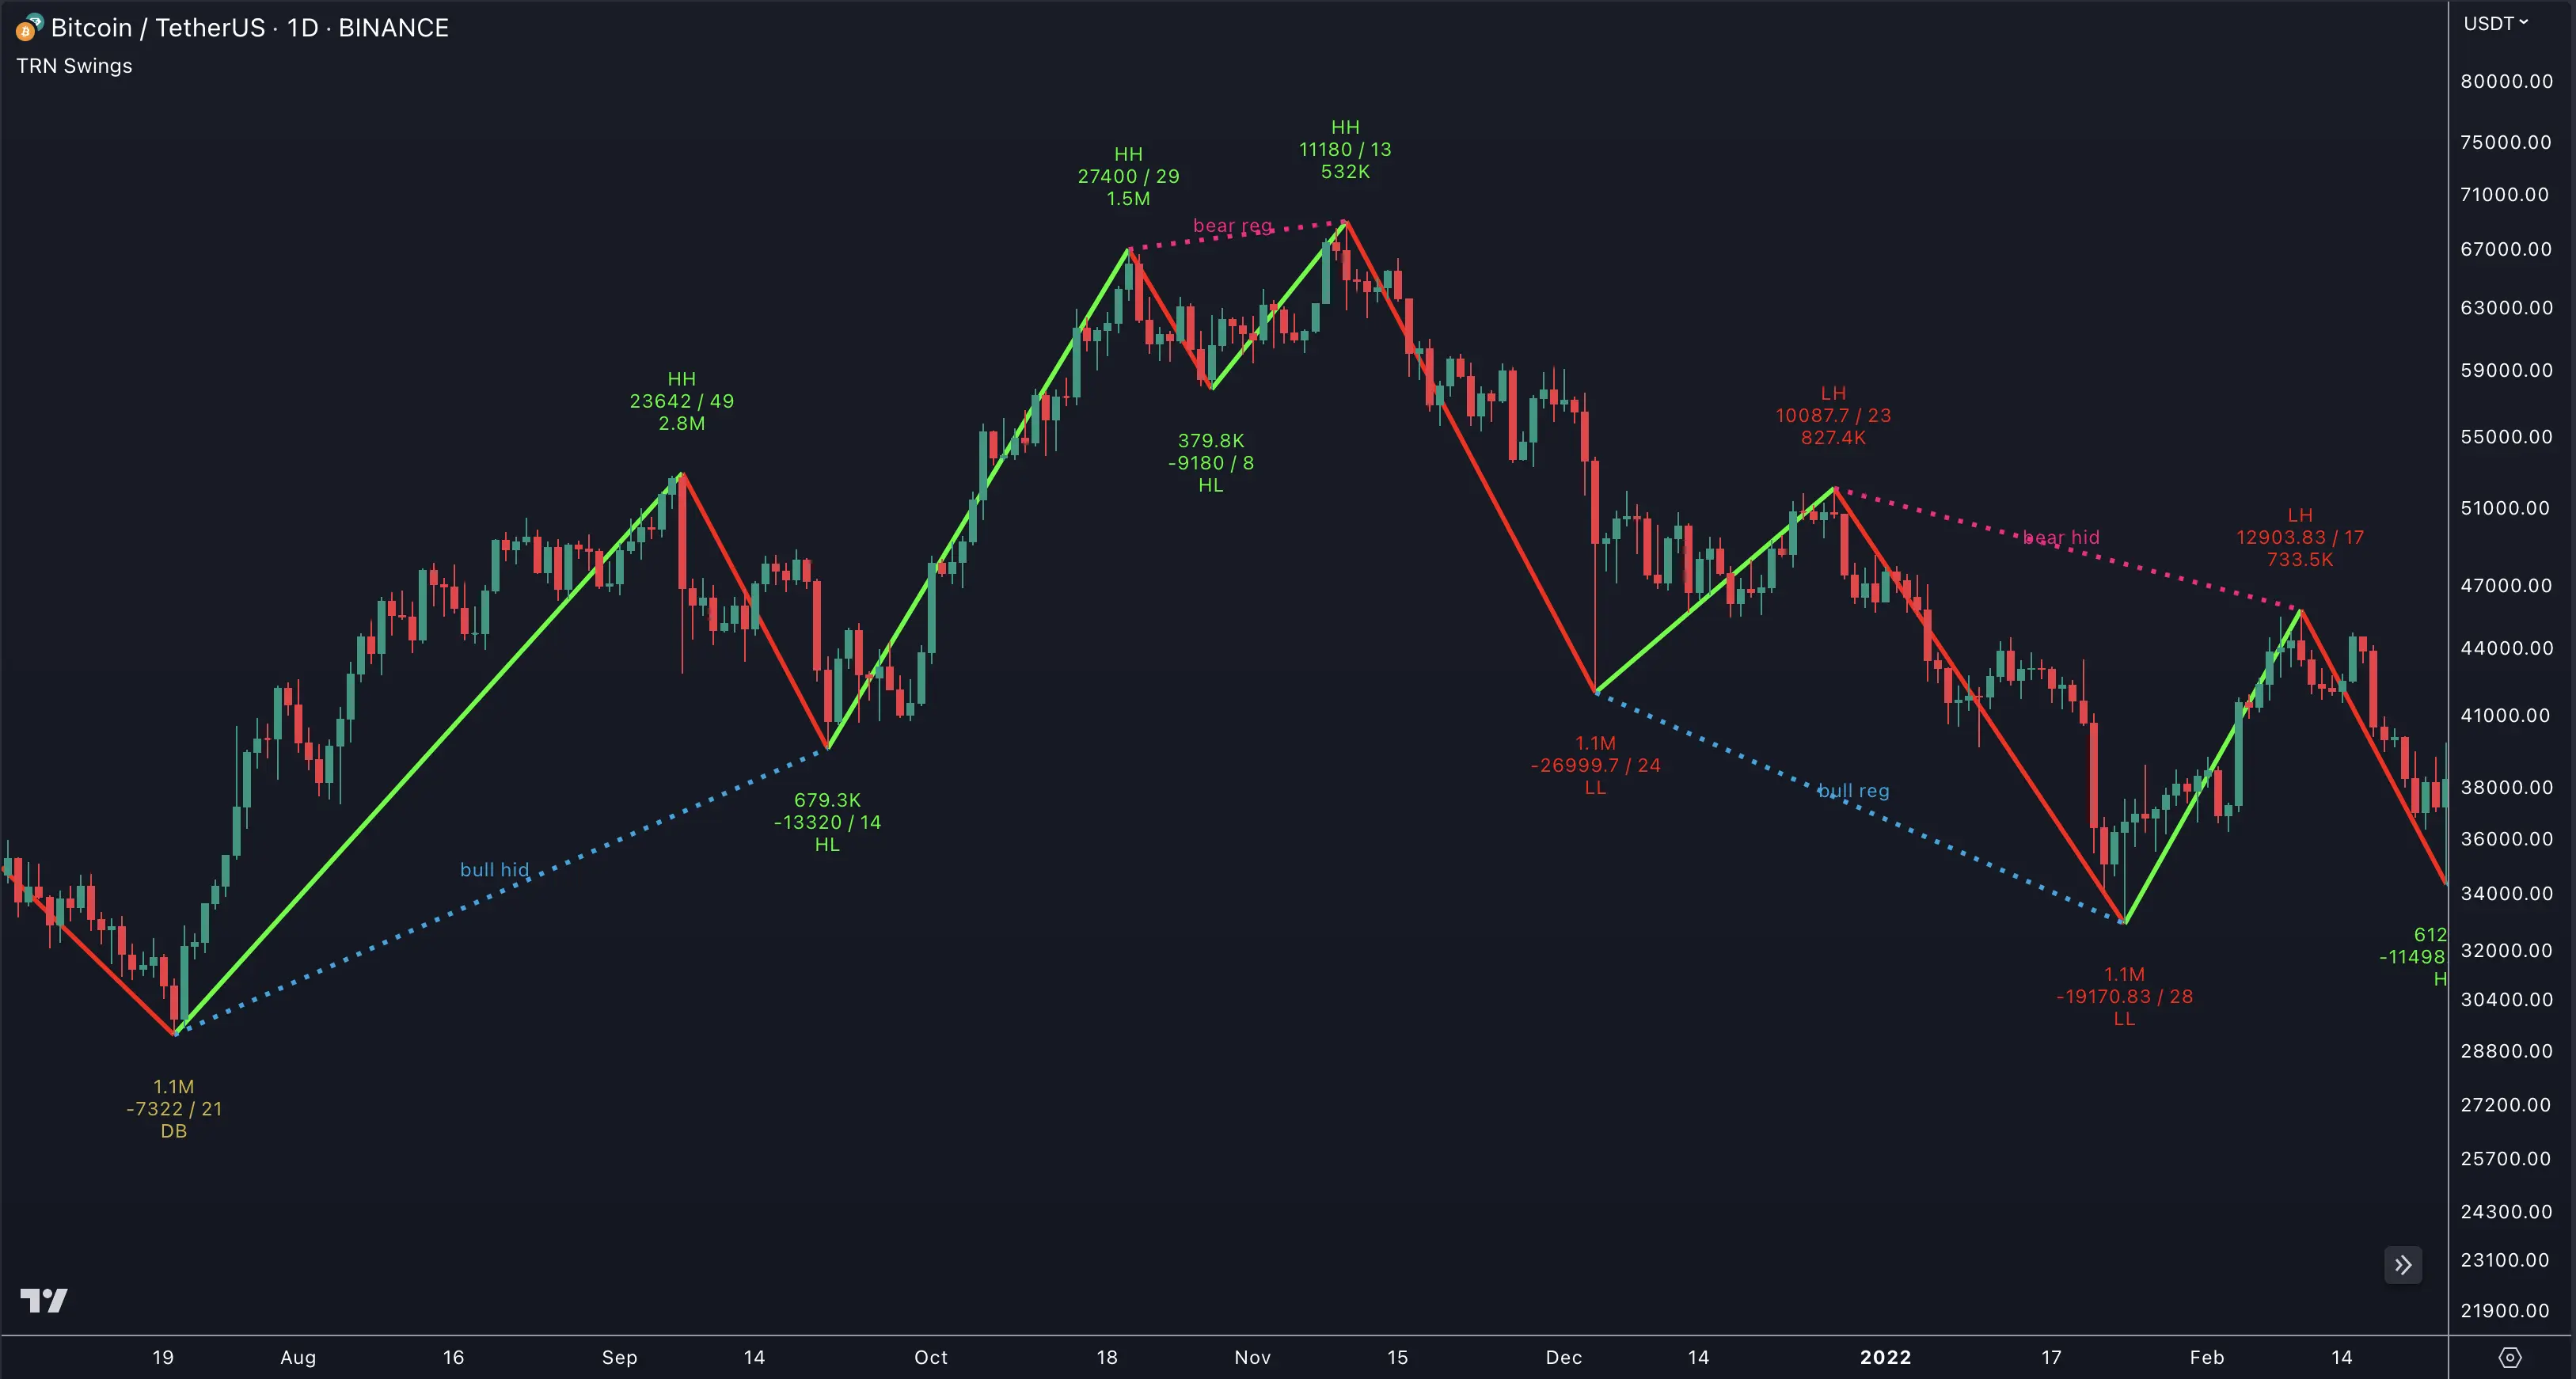
The TRN Swing Suite works with any given indicator, even custom ones. In addition, there are 11 built-in indicators. We have chosen a selection of different momentum, trend following and volume oscillators that gives you maximum flexibility. Most noticeable is the cumulative delta indicator, which works astonishingly well as a divergence indicator.
Following is the full list of the build in indicators/oscillators:
- AO
- CDV
- RSI
- W%R
- MFI
- Stochastic
- MACD
- CCI
- ADX
- ATR
- Cumulative Delta
The 11 divergence indicators are the same ones build in our tool SMT/Divergence Suite. Visit our 11 Oscillators And Just One Tool section to learn more about them.
What Are Divergences?
When the price of an asset moves in one direction, but its indicators move in the opposite direction, this is called a divergence. Divergences can be a powerful signal that a trend reversal is about to occur.
Regular Divergences
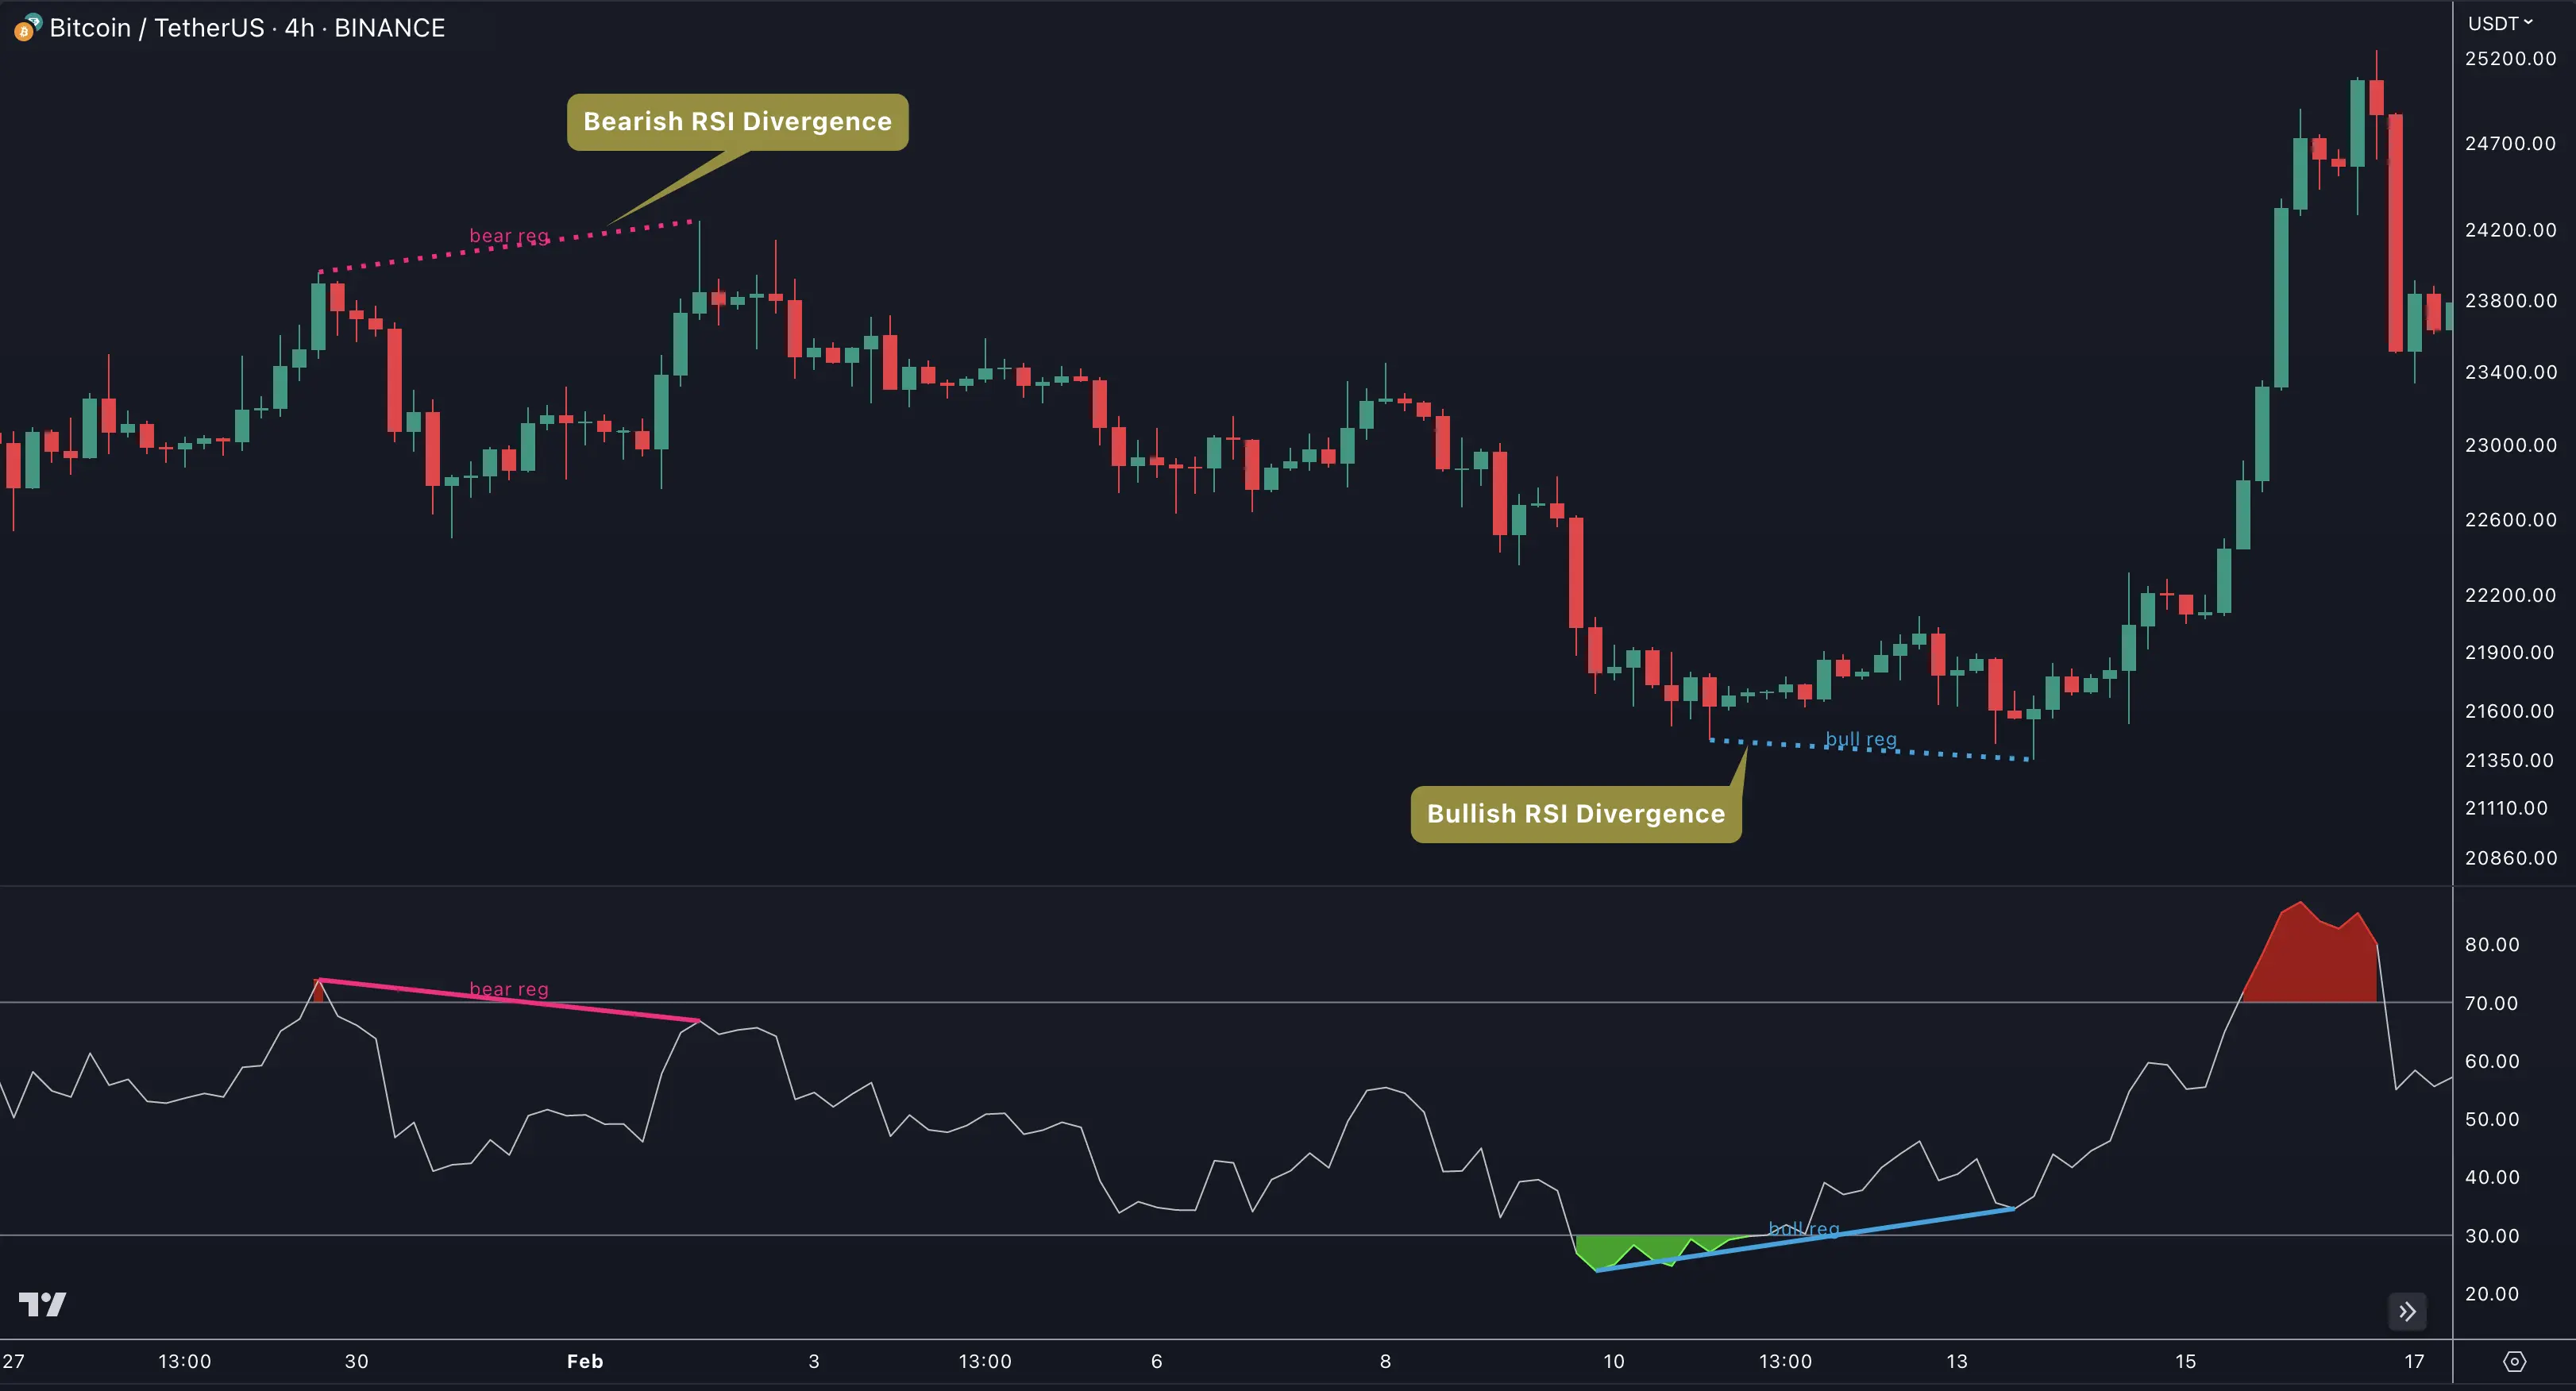
There are two types of regular divergences: bullish and bearish. A bullish divergence occurs when the price of an asset makes a lower low, but its indicators make a higher low. This can be a sign that the asset is oversold and that a reversal is imminent. A bearish divergence, on the other hand, occurs when the price of an asset makes a higher high, but its indicators (such as Relative Strength Index - RSI) make a lower high. This can be a sign that the asset is overbought and that a reversal is imminent.
Hidden Divergences
Beside regular divergences there are other types of divergences like hidden divergences.
In trading, hidden bearish and hidden bullish divergences are patterns that traders often look for on price charts to identify potential trend reversals or continuation patterns. These divergences occur when the price of an asset moves in the opposite direction of an indicator, suggesting a possible shift in the underlying trend.
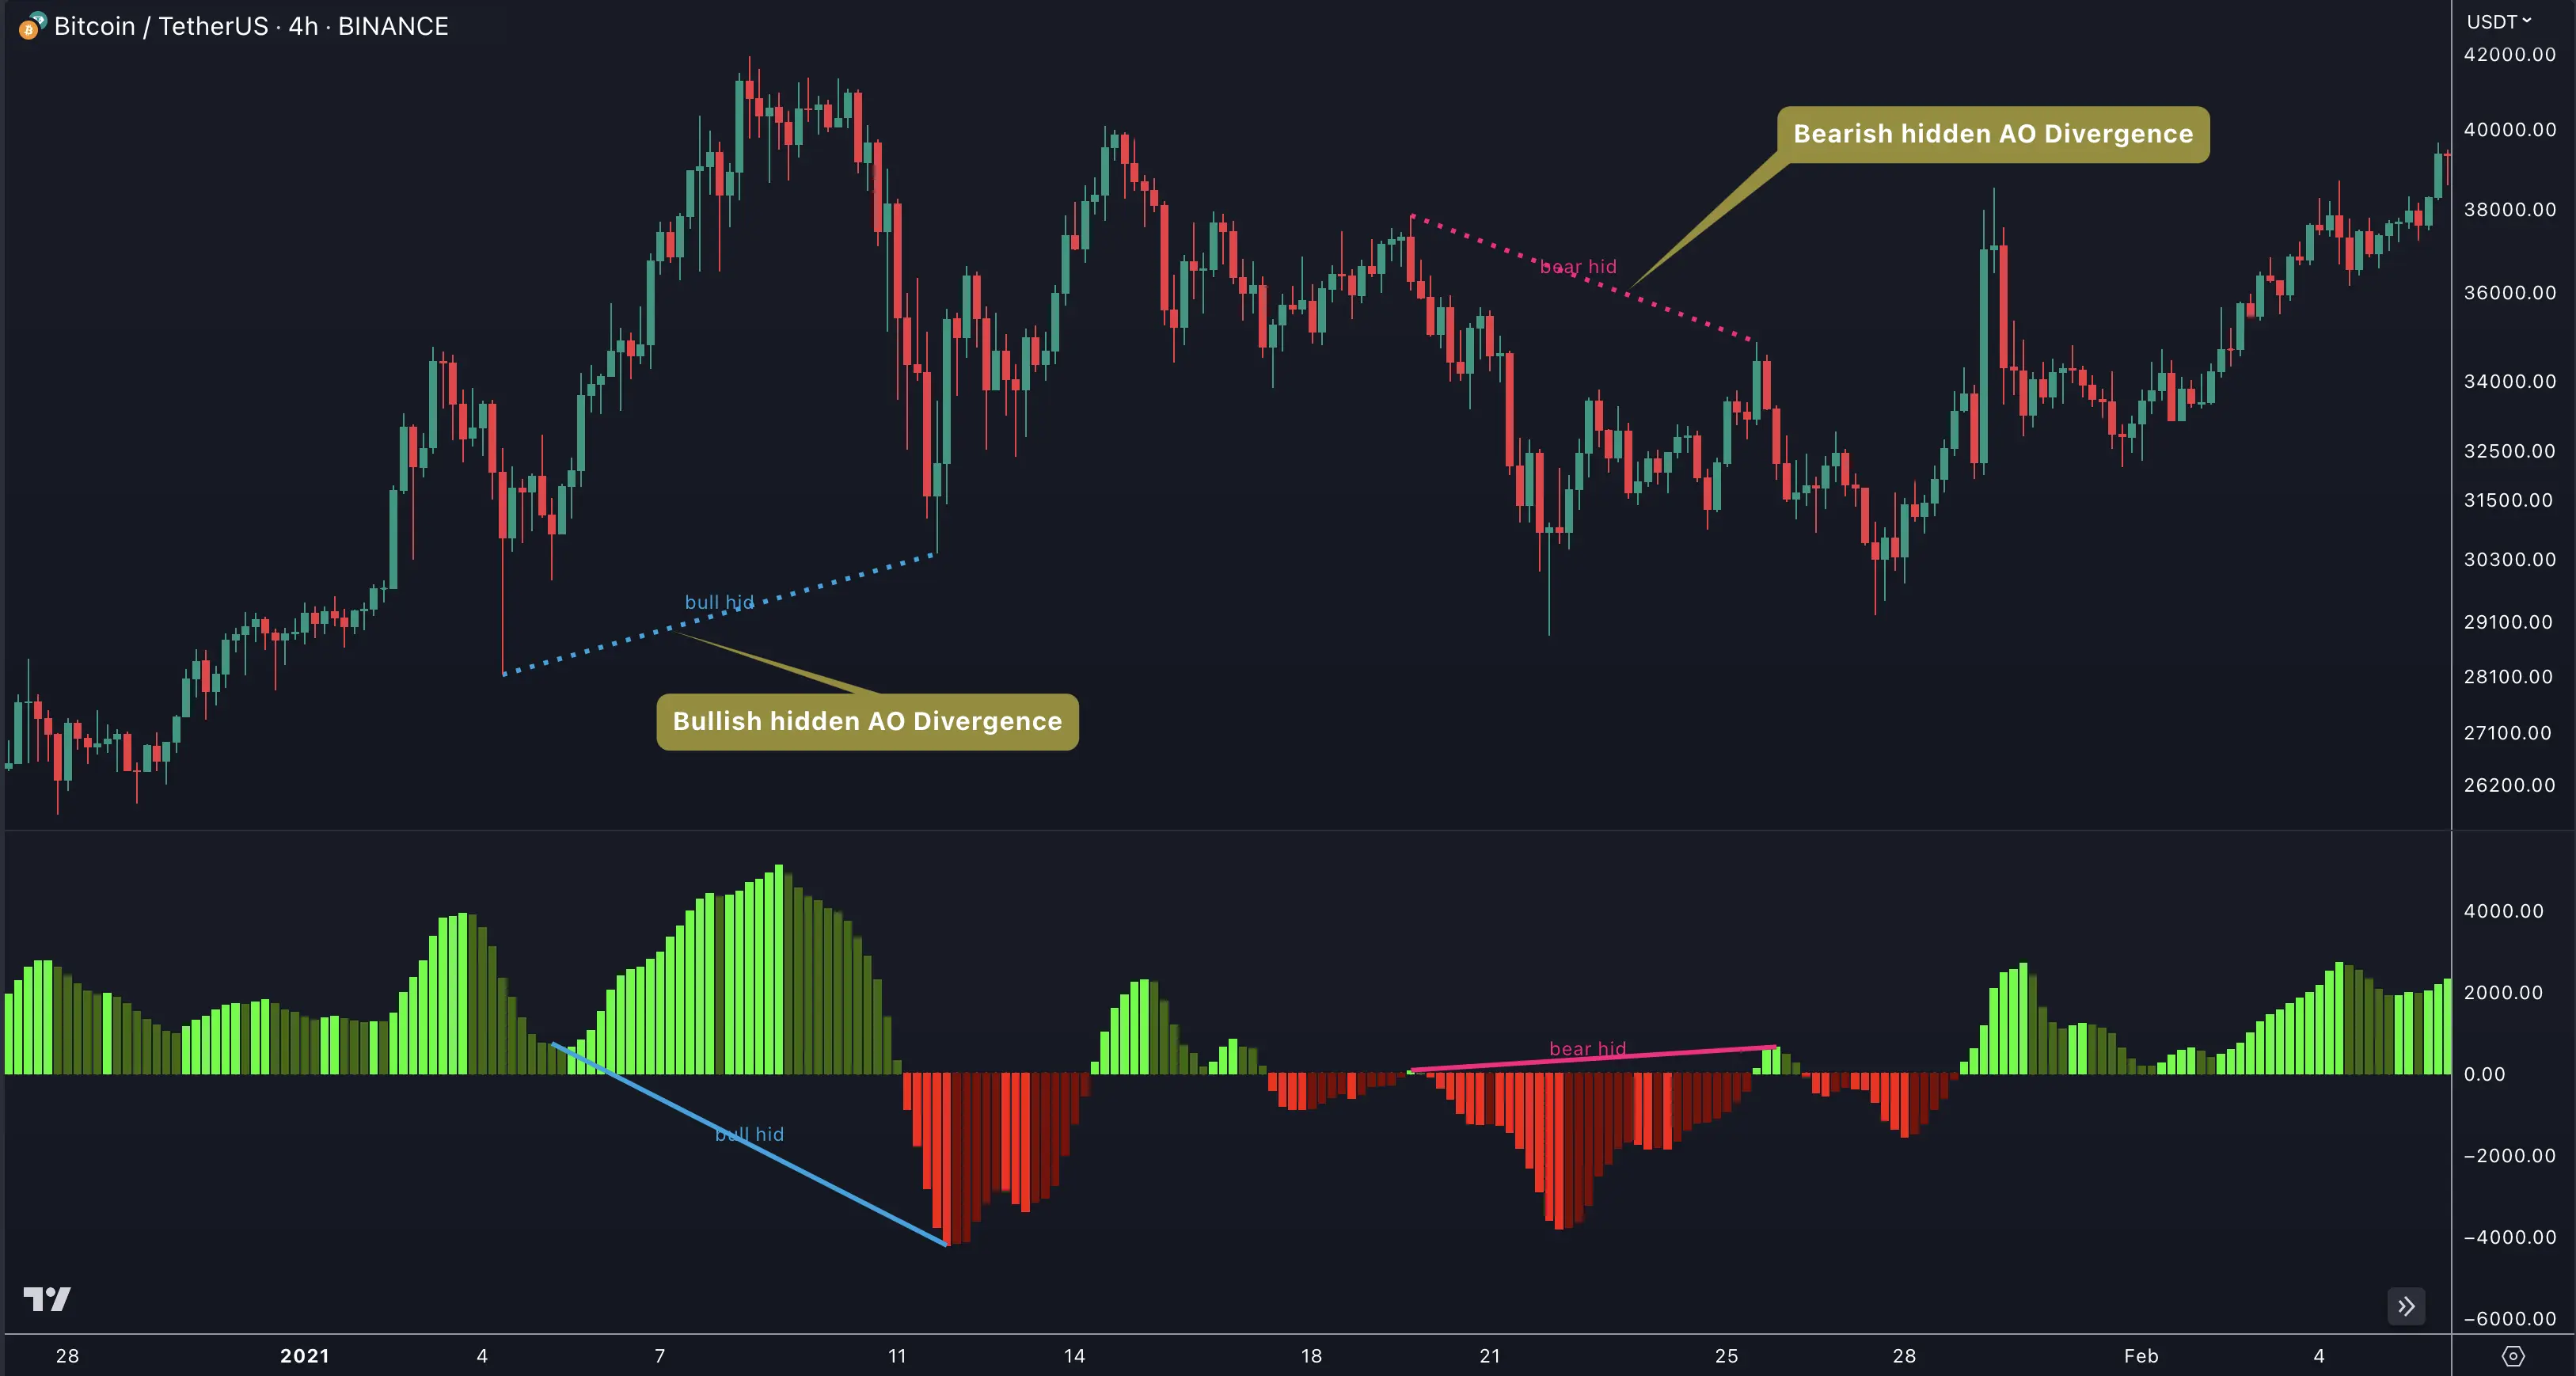
Hidden Bearish Divergence
A hidden bearish divergence occurs when the price of an asset forms a higher high, but the corresponding indicator (such as the Awesome Oscillator - AO) forms a lower high. This indicates that the upward momentum is weakening, and a potential trend reversal or continuation of a downtrend is likely.
Hidden Bullish Divergence
On the other hand, a hidden bullish divergence takes place when the price forms a lower low, but the indicator forms a higher low. This suggests that the downward momentum is weakening, and a potential trend reversal or continuation of an uptrend is possible.
Parameters and Usage
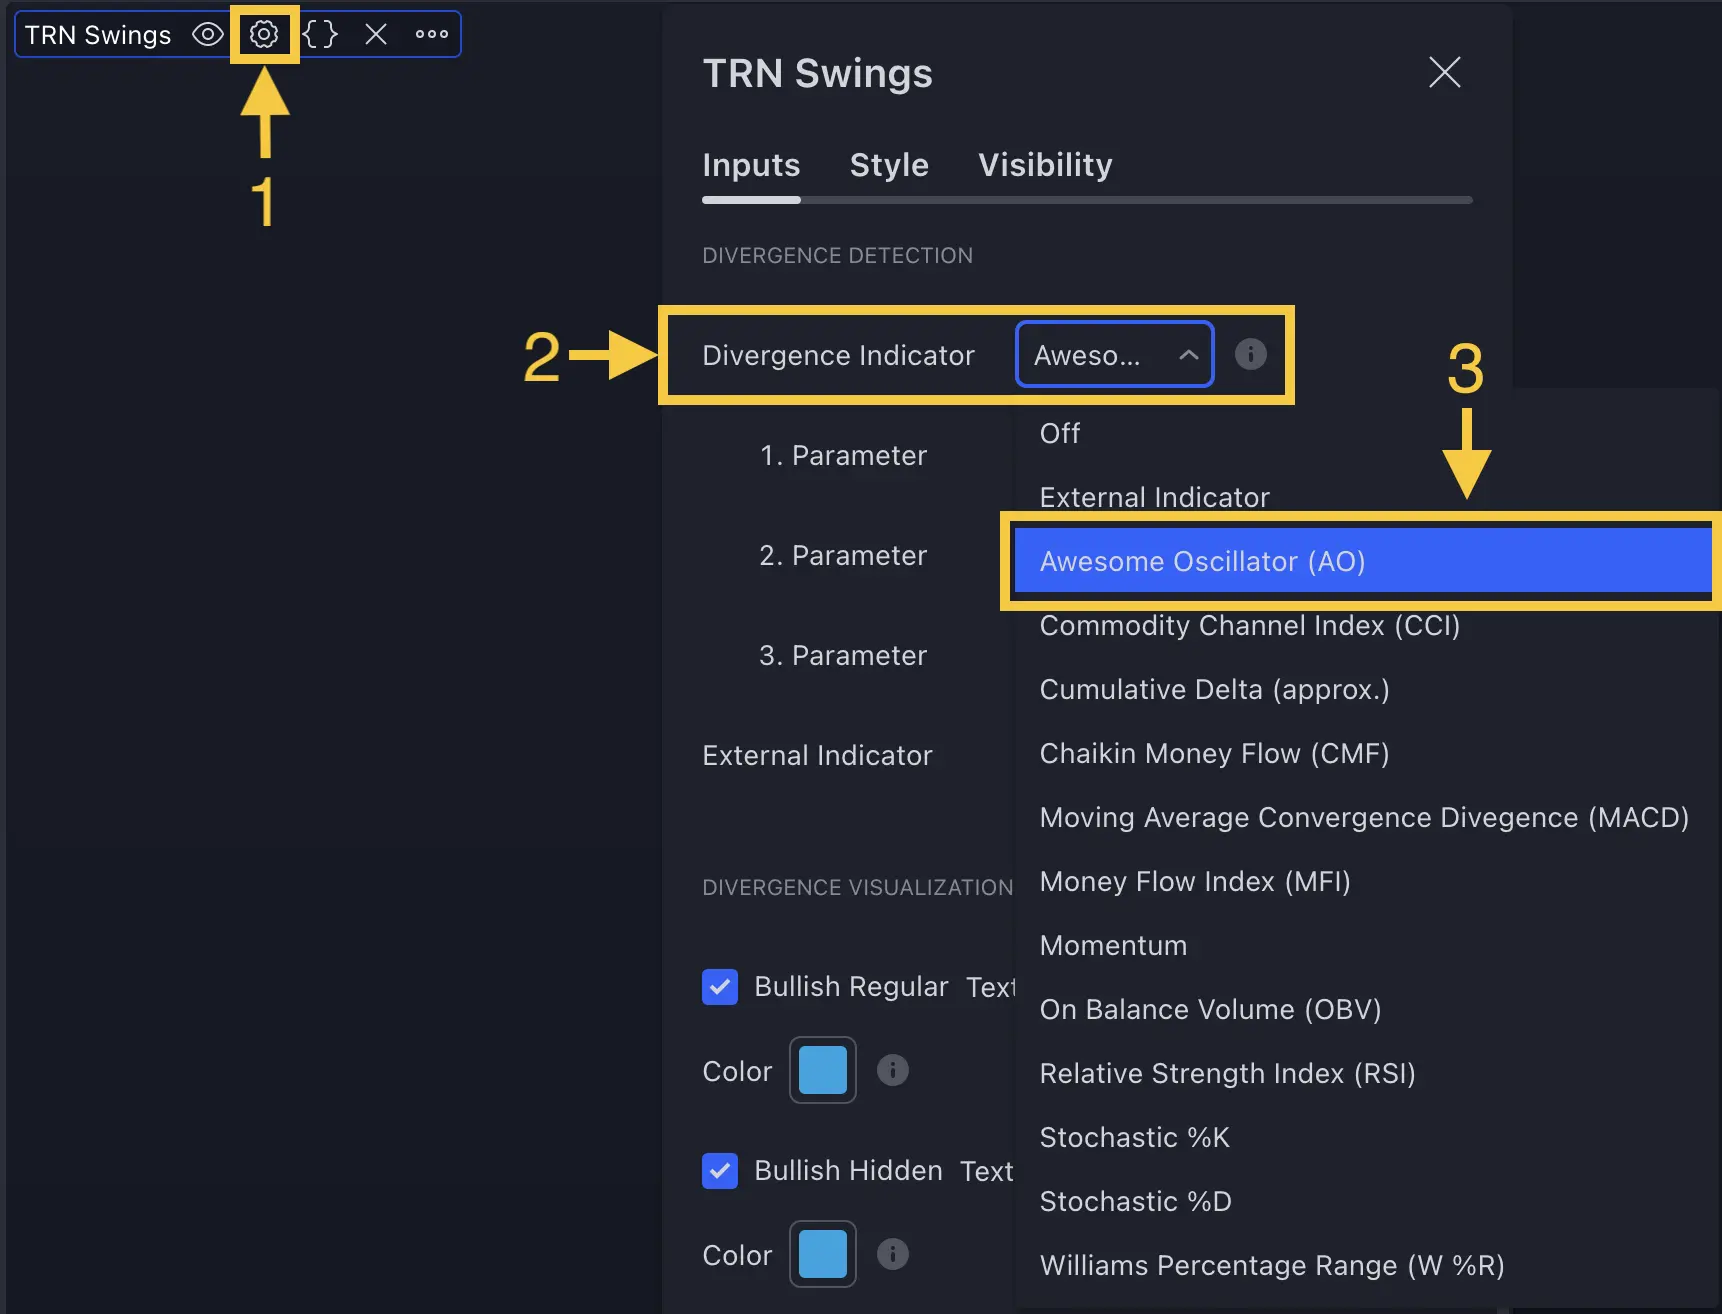
To get started, open the indicator settings (1) and locate the "Parameters" section (2) where you can fine-tune the tool's behavior.
How To Use the Divergence Detector
The divergence detector in the Swing Suite compares the price of an asset to one of the 11 built-in oscillators (e.g., RSI, MACD) to identify potential trend reversals.
1. Set Up the Divergence Detector
Open the indicator settings (1) and navigate to the "Parameters" section under the "Inputs" menu item (2). Choose one of the provided oscillators, such as the RSI (3) (see figure below).
By default, the first oscillator you will see when you add the Swing Suite to your chart is the Awesome Oscillator (AO).
2. Identify Divergences
The indicator searches for divergences between price and your selected oscillator on the chosen asset and timeframe, marking any detected divergences directly on your chart. Blue lines indicate bullish divergences and red lines indicate bearish divergences.

When a divergence appears, these colored lines serve as a visual cue that a trend reversal may be imminent. Traders can leverage this information to make informed decisions—such as entering or exiting a trade—based on a signal from Trend Bars Pro or one of the TRN Chart Patterns.
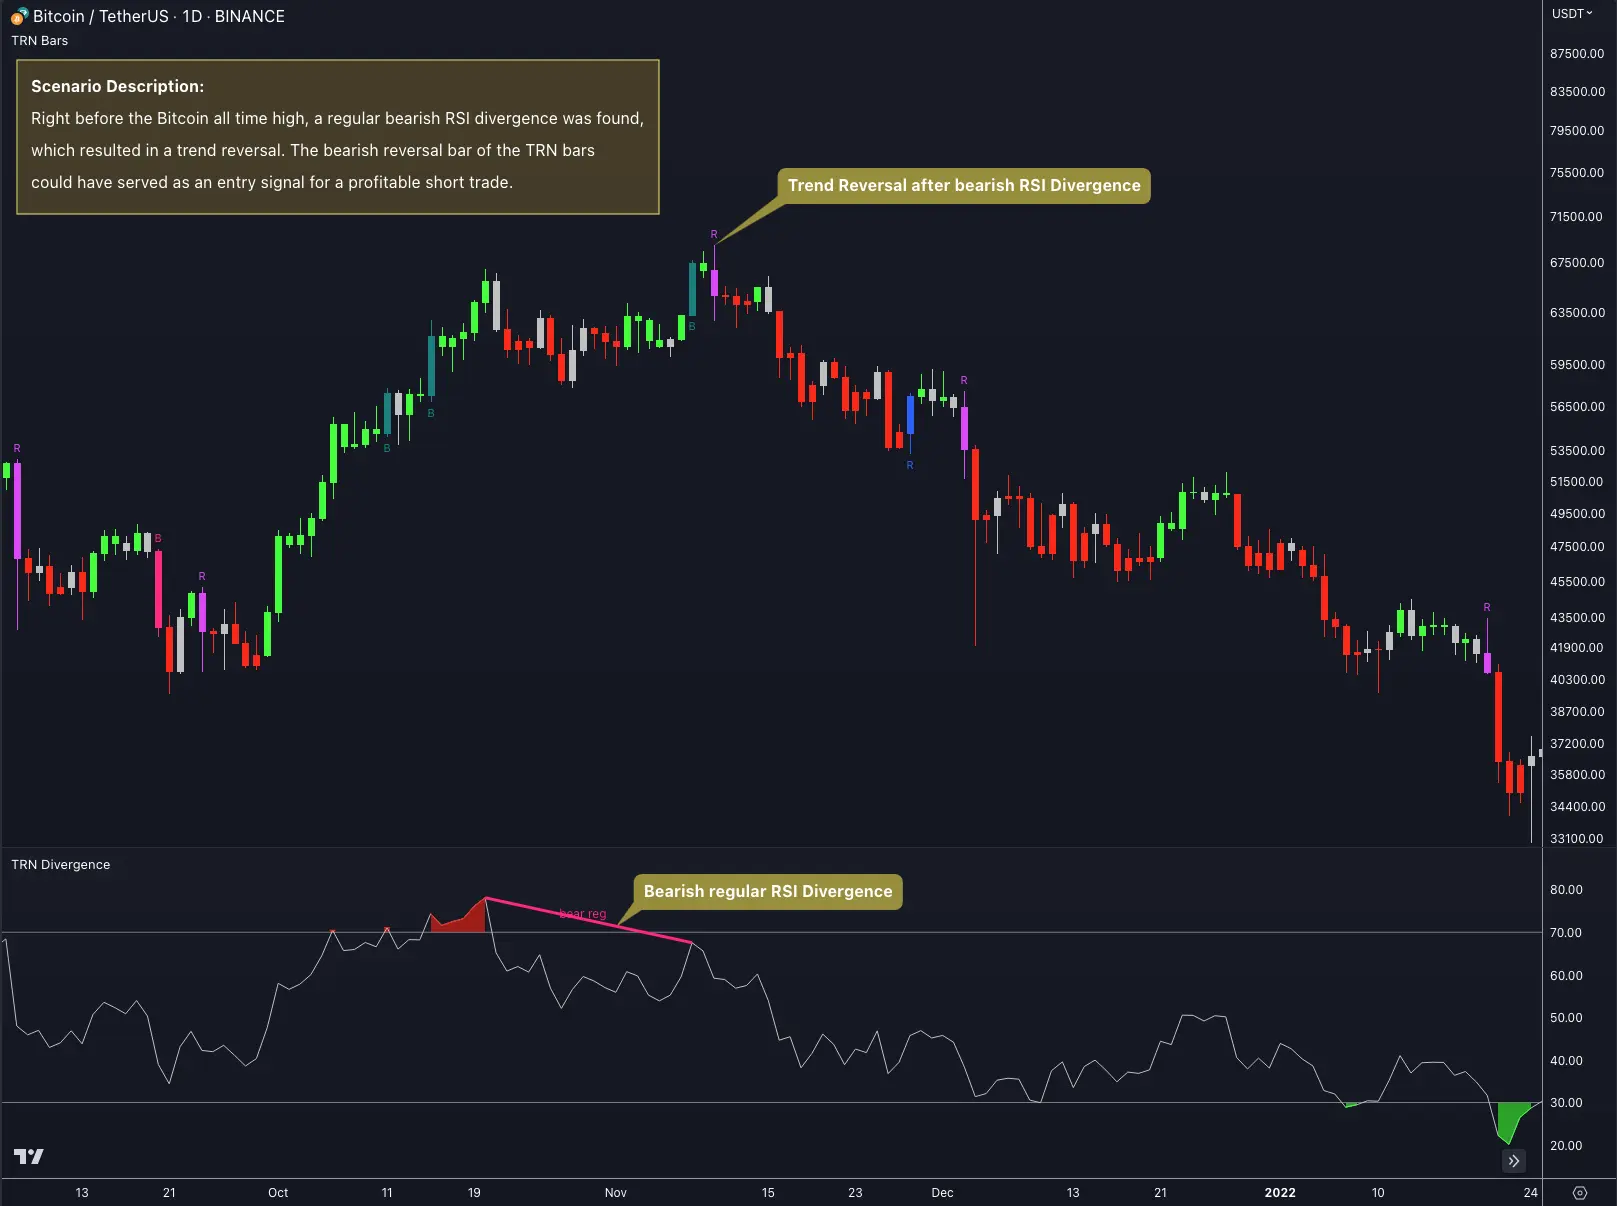
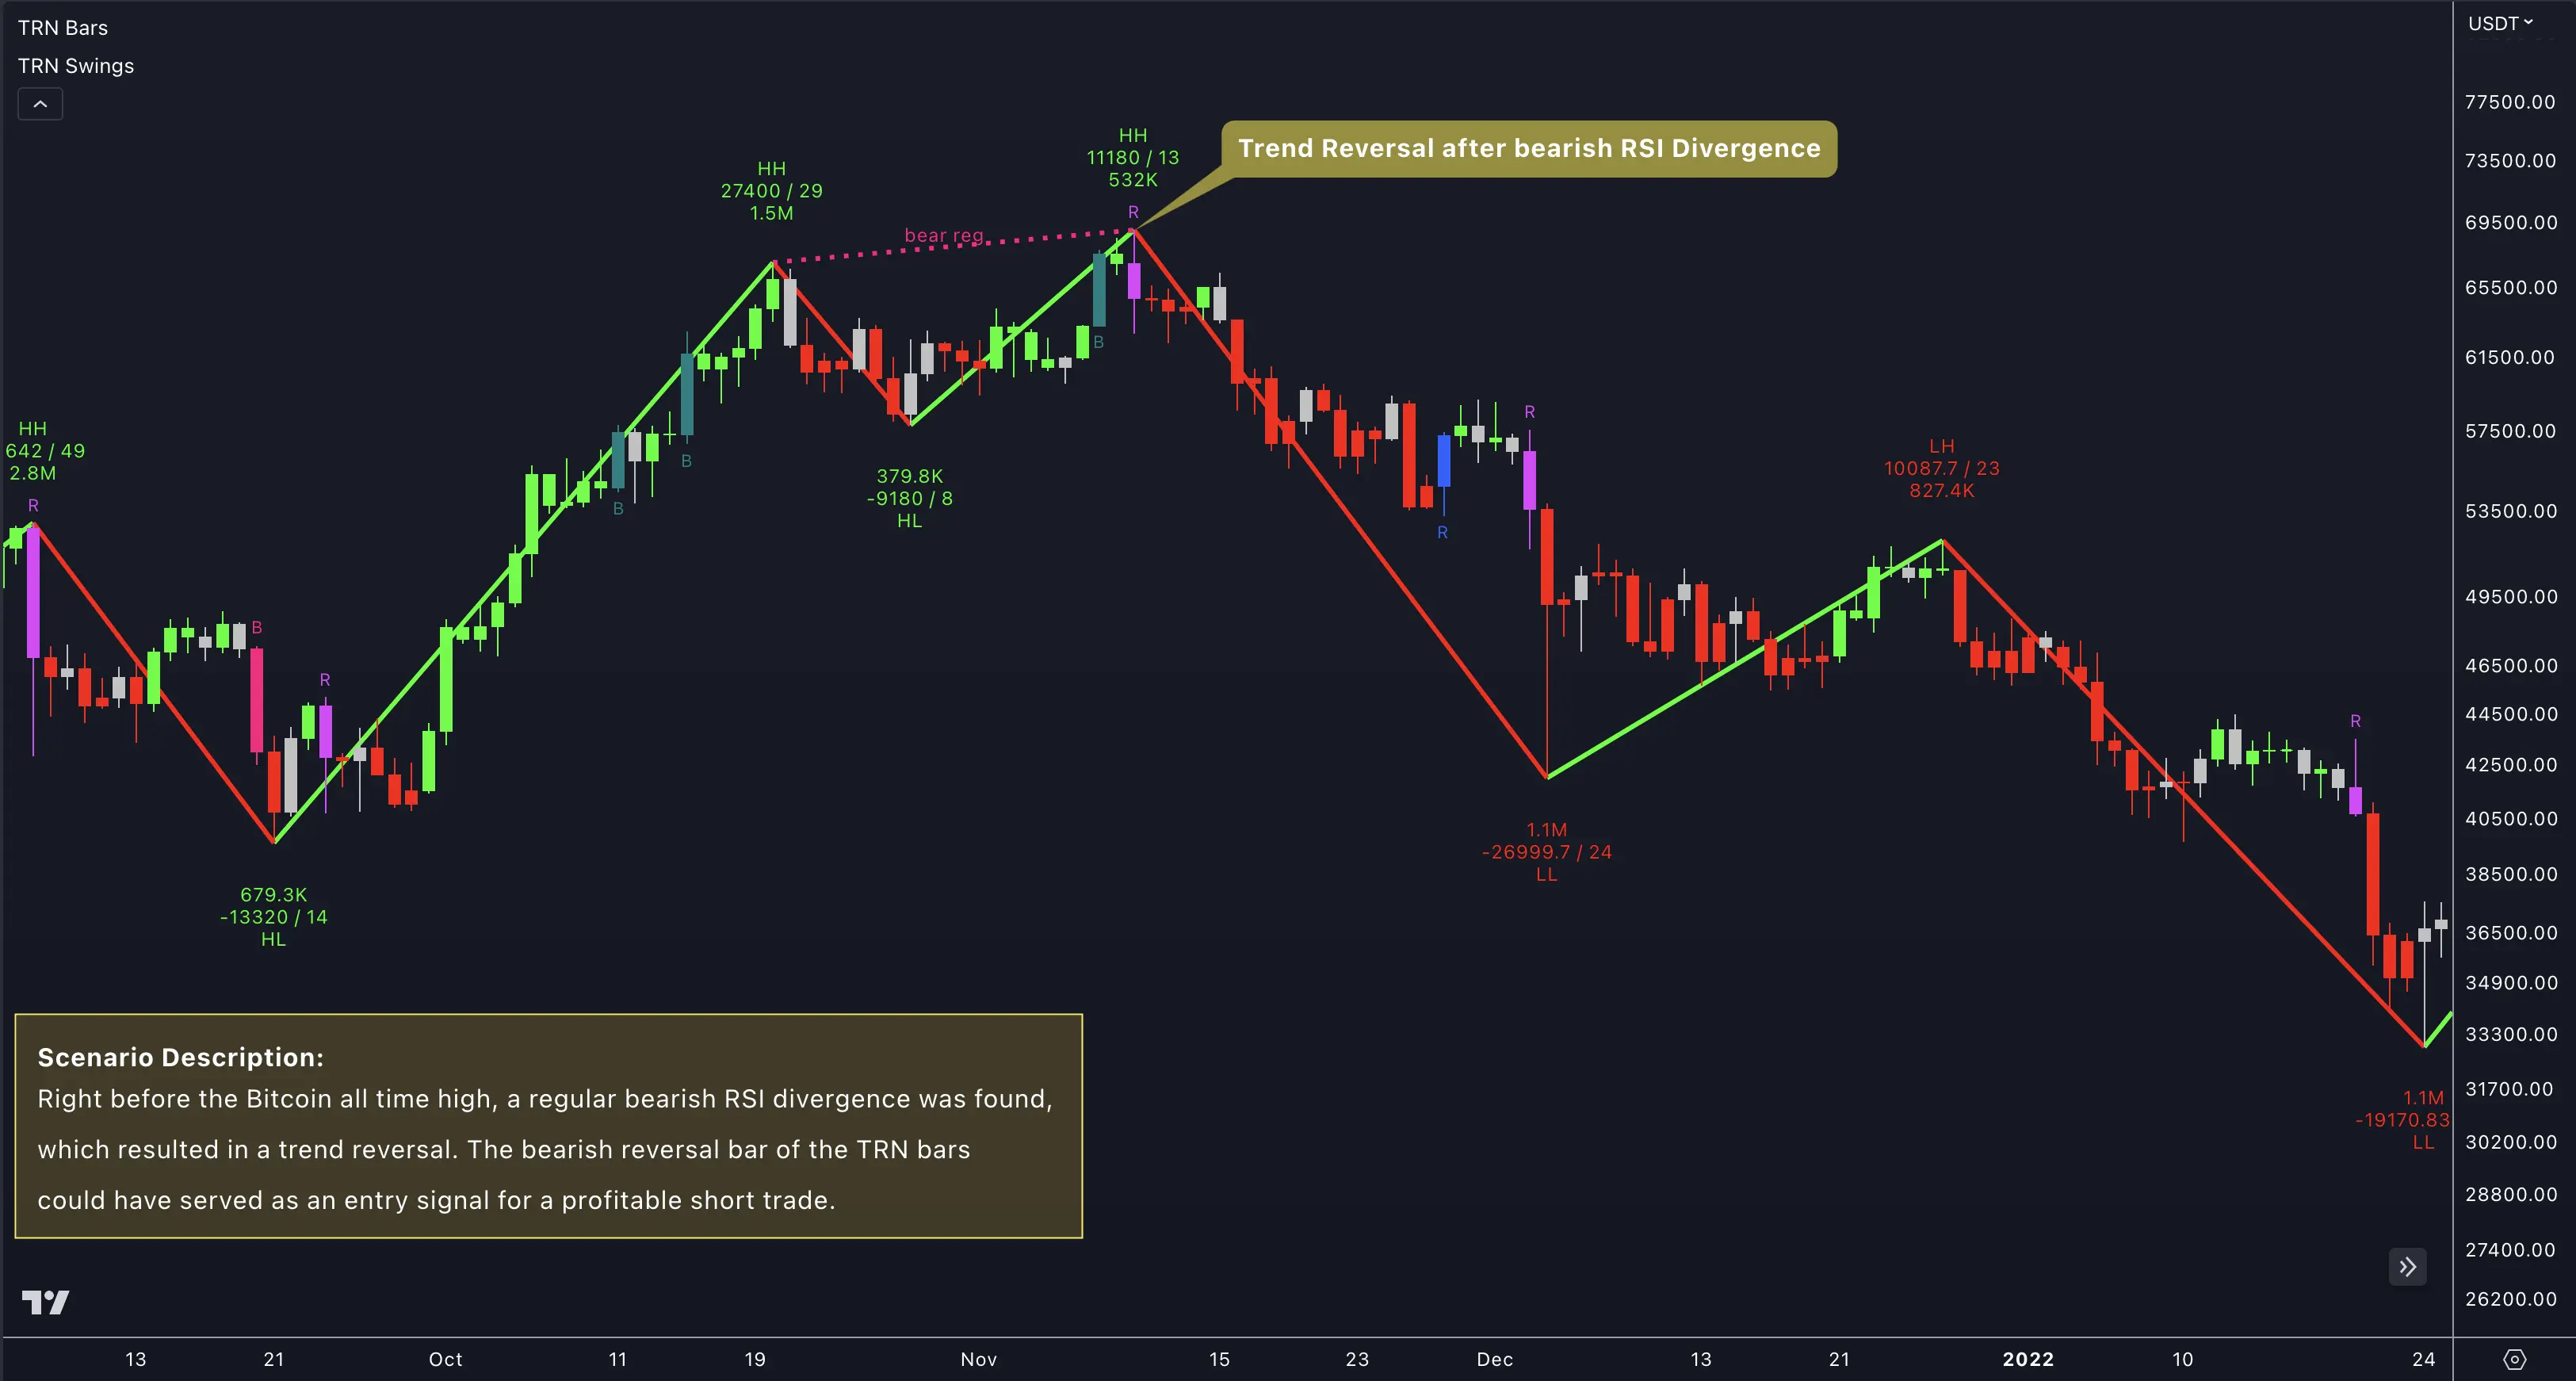
Bearish and bullish divergences are not guaranteed signals and should be supplemented with additional analysis and prudent risk management.
For potential strategy ideas, visit our Combinations section to learn how the Swing Suite can be integrated with other TRN Trading tools.
Combine divergence signals with Trend Bars Pro for enhanced trade entries and exits.
FAQ
Which oscillator works best for divergence trading?
The RSI and Cumulative Delta tend to provide the most reliable divergence signals. However, each oscillator has its strengths depending on market conditions and timeframe.
How can I confirm divergence signals?
Combine divergence signals with Market Structure analysis and Trend Bars Pro for confirmation. Also check volume and price action patterns.
When should I trade hidden divergences?
Hidden divergences work best in strong trending markets as continuation signals. They're most reliable when aligned with the higher timeframe trend and supported by Order Blocks.