Fair Value Gaps (FVGs)
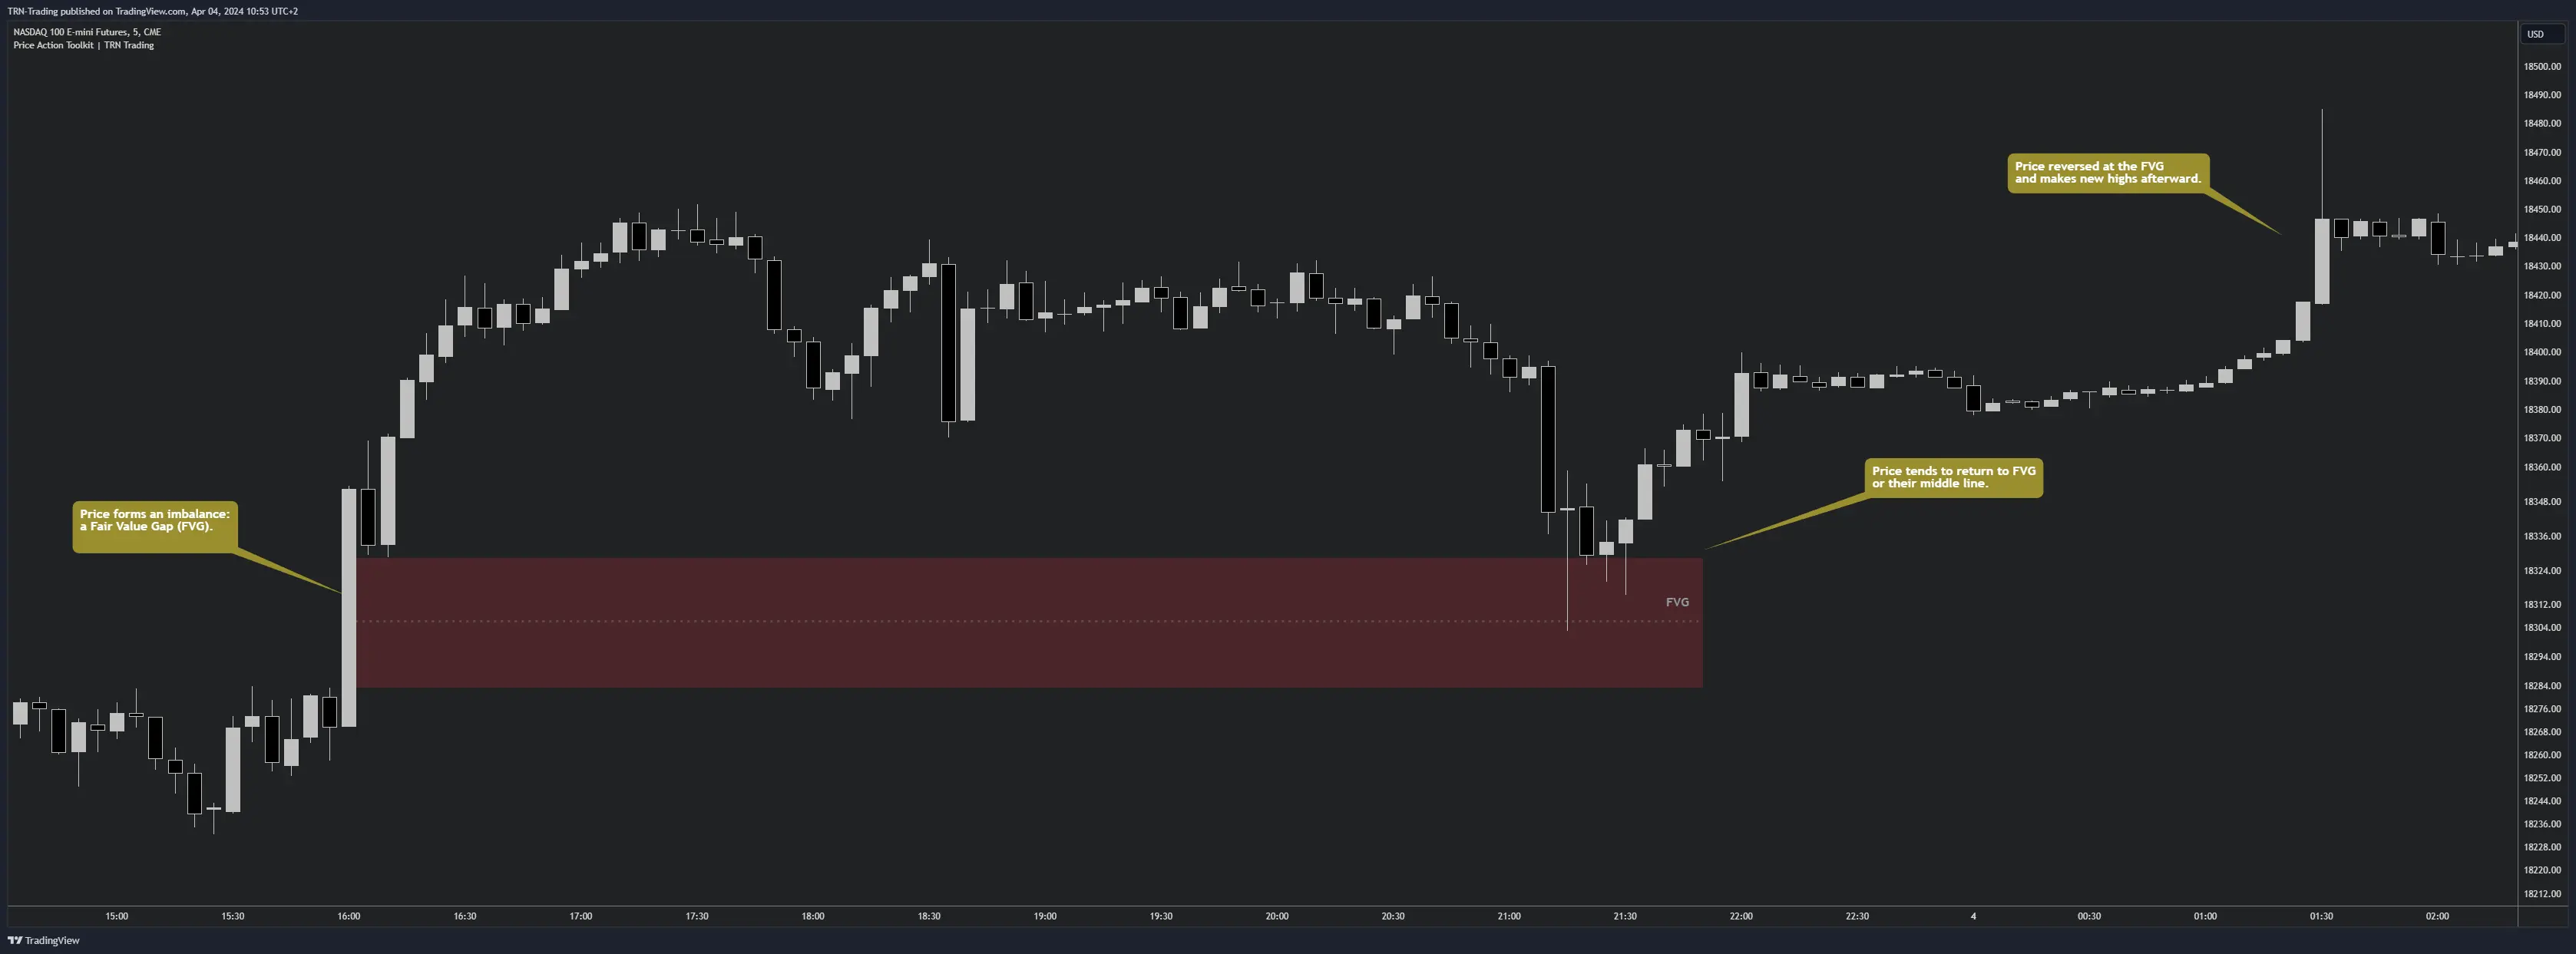
A Fair Value Gap (FVG) represents a market inefficiency created by imbalanced buying and selling pressures. These gaps act as price magnets, often drawing the market back to "fill" the gap before continuing its trend.

Understanding FVGs
FVGs supported by key support and resistance levels offer high-probability trading opportunities. The indicator identifies different types of gaps based on their formation and market dynamics:
Regular FVG
This is the standard three-candle gap, representing market inefficiencies and potential price magnets. For a valid setup, price should revisit and close inside or with the setup (e.g., inside or above the FVG for a long setup). If price closes beyond the gap against the bias, the FVG's validity is often compromised. Regular FVGs serve as a baseline setup and are best utilized when supported by a clear trend and strong market structure, with volume-confirmed setups.
Inversion FVG
An Inversion FVG (also known as an Inverse FVG or iFVG) occurs when a prior FVG is filled, and both the first and third candles of the new formation close outside the original gap, leaving long wicks. These gaps, closed by opposite movement, serve as strong trend continuation signals validated by volume patterns. When price returns to an Inversion FVG, it frequently produces swift rejections, making it a powerful zone for potential reversals.
Overlapping (Inverse) FVG
Considered the most powerful FVG type, an Overlapping (Inverse) FVG forms in the opposite direction while filling another FVG. When price returns to this formation, it frequently triggers sharp rejections and strong momentum. This type is ideal for high-conviction entries and capitalizing on significant momentum continuation, especially when aligned with market structure shifts.
FVG Power Ranking
Understand how to assess the strength of Fair Value Gaps with a concise walkthrough. This video explains a practical power ranking approach to prioritize FVGs by context, confluence, and volume dynamics.
FVG Probability Types
| Probability | Third Candle Behavior | Implication |
|---|---|---|
| Lowest | Closes deep against the move (e.g., bearish in bullish FVG) | Emerging opposing pressure, higher chance of failure. |
| Higher | Closes with the trend, above candle 2 (e.g., bullish in bullish FVG) | Trend continuation likely, less chance of revisit. |
| Better | Long wick with recovery (e.g., long lower wick in bullish FVG) | Revisit may occur on lower timeframes due to recovery after a dip. |
| Highest | Small consolidation candle (range on lower TFs) | High likelihood of revisit before continuation, as price consolidates. |
Confluence and Market Structure
Market Structure (MSS/ChoCH): The quality of an FVG significantly improves when it aligns with a clear market structure shift (MSS) or change of character (ChoCH). A bullish MSS is identified when price makes the first higher high that closes above the prior lower high, indicating a potential trend change. Conversely, a bearish MSS occurs with the first lower low closing below the prior higher low. Prioritizing FVGs that form around these pivotal shifts generally enhances the probability and quality of the subsequent price movement.
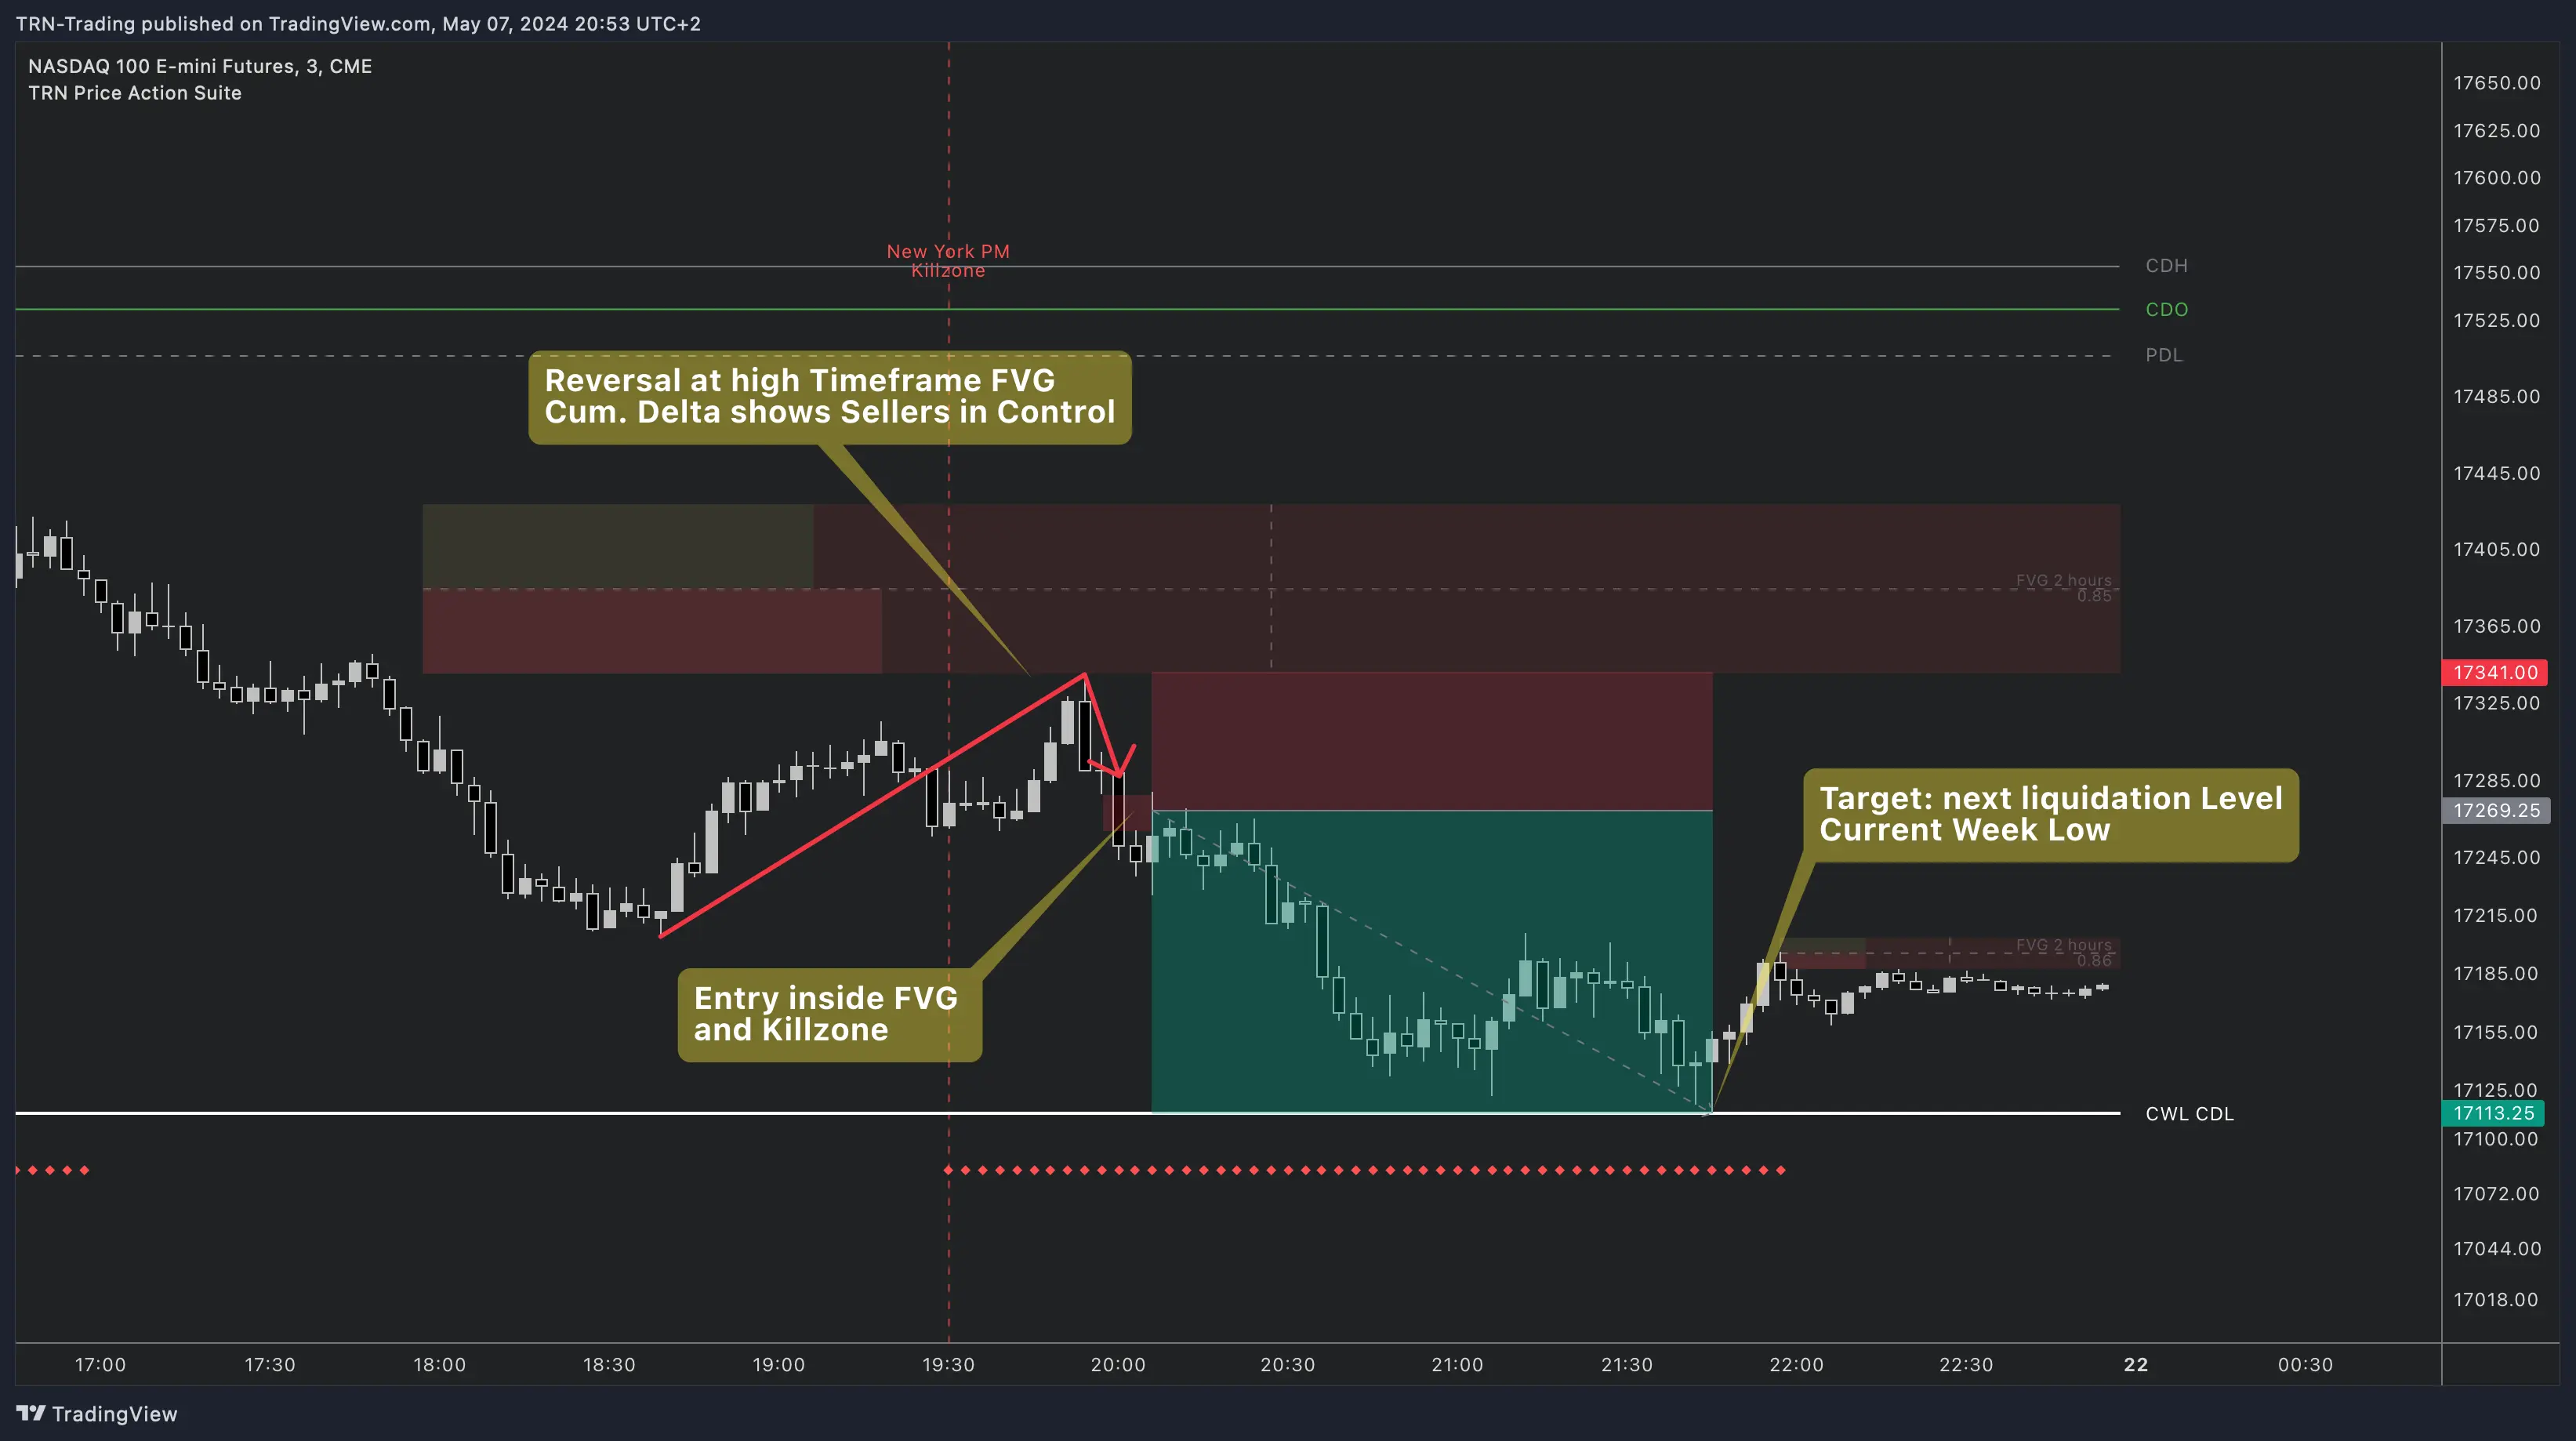
HTF/LTF Confluence: Pairing higher-timeframe (HTF) and lower-timeframe (LTF) FVGs strengthens setups and refines entries. For bullish scenarios, traders should seek an LTF FVG entry within the lower half of the HTF bullish FVG, placing the stop loss beneath a relevant LTF bullish FVG. In bearish contexts, an LTF FVG entry should be sought within the upper half of the HTF bearish FVG, with the stop loss placed above a relevant LTF bearish FVG. Useful timeframe pairs for this type of alignment include Weekly→4H, Daily→1H, 4H→M15, 1H→M5, and M15→M1.
Cumulative Volume Delta Integration

The integration of Cumulative Volume Delta (CVD) adds depth to FVG analysis by:
- Measuring net buy/sell volume
- Confirming market intent
- Validating momentum strength
The integration of Cumulative Volume Delta (CVD) with Fair Value Gaps adds a new dimension to market analysis. By measuring the net difference between buying and selling volume within an FVG, traders gain deeper insight into market intent and strength. For example, an FVG with a high cumulative buy volume in an uptrend confirms the validity of the gap and indicates stronger upward momentum. Conversely, in a downtrend, an FVG with dominating sell volume supports the bearish bias. The FVG includes two bars on the left side, indicating the cumulative buy volume in green as well as the cumulative sell volume in red. At the right side of the FVG box the ratio of the cumulative buy/sell volume is displayed. A high ratio over 1, for example 1.5, indicates a lot of buying pressure. On the hand, a ratio far below 1, for example 0.66, indicates a lot of selling pressure. This feature not only helps traders validate FVGs but also allows them to anticipate price movement with greater accuracy.
Volume Ratio Analysis
The FVG displays two key components:
- Left side: Buy volume (green) and sell volume (red) bars
- Right side: Buy/sell volume ratio
Volume ratio interpretation:
- Ratio > 1 (e.g., 1.5): Strong buying pressure
- Ratio < 1 (e.g., 0.66): Strong selling pressure
Multi-Timeframe Analysis
Configure higher timeframe analysis through:
- Timeframe 1 settings (e.g., 4H)
- Timeframe 2 settings (e.g., 1D)
Combine FVG analysis with Order Blocks for stronger trade confirmation.
FAQ
What exactly is a Fair Value Gap?
It is a three bar pattern that forms a gap between the first and the third bar. Meaning that there is no overlap between the first and the third bar.
Why is Cumulative Volume Delta important for FVGs?
CVD helps validate FVGs by showing the net buying/selling pressure within the gap. High volume ratios (> 1) indicate strong buying pressure, while low ratios (< 1) suggest selling pressure, helping confirm trade direction.
What's the best timeframe for trading FVGs?
While FVGs can be traded on any timeframe, combining multiple timeframes often yields better results. For example, trading 5-minute FVGs that align with 4H and daily FVGs typically offers higher probability setups.