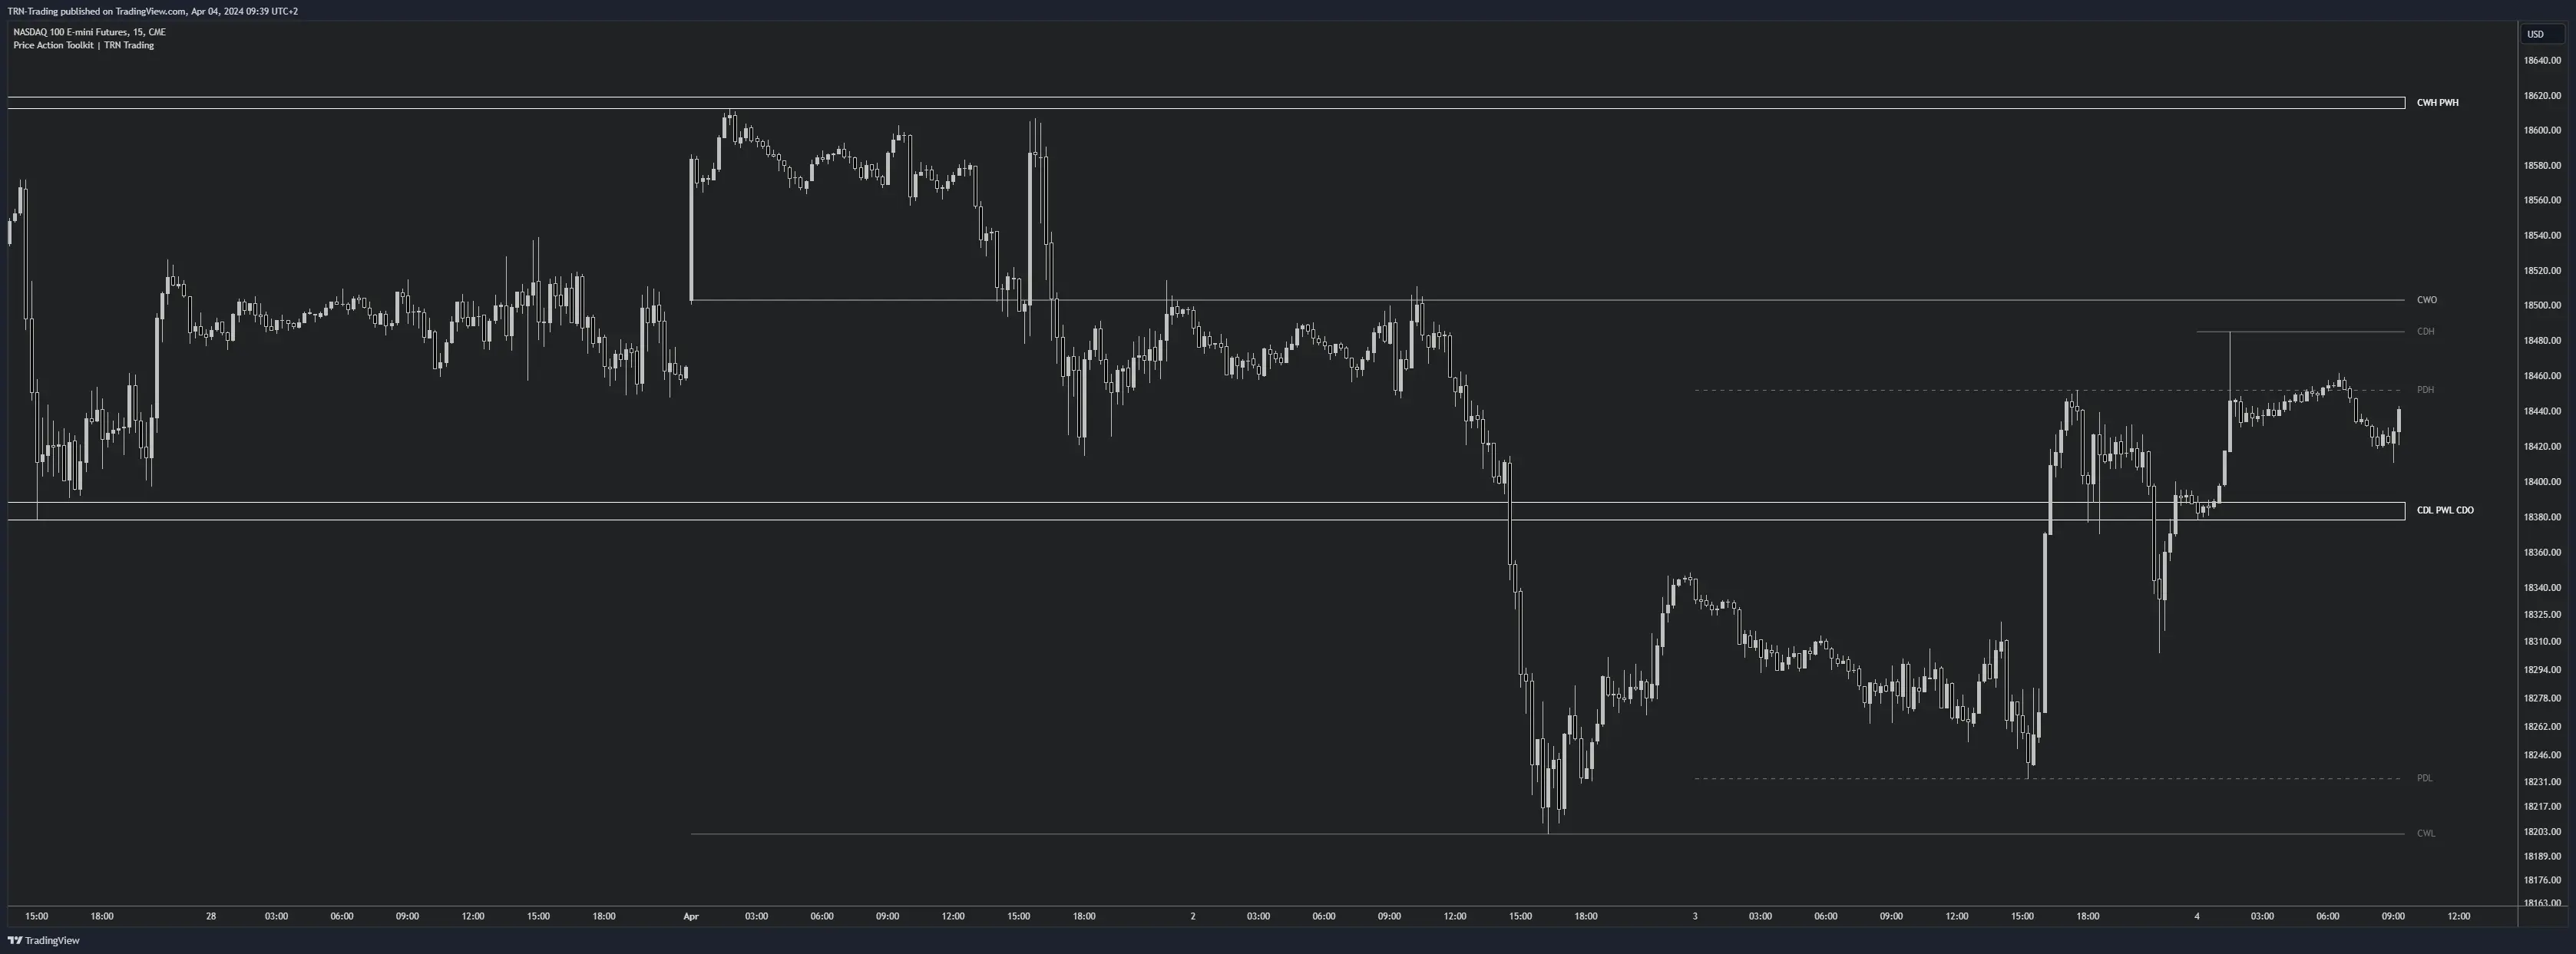
Liquidity Levels
In Smart Money Concepts (SMC), price naturally flows to areas of liquidity. These key levels act as magnets for price movement and provide high-probability trading opportunities.

Key Liquidity Levels
-
Daily Levels
- Current Day Open (CDO)
- Current Day High (CDH)
- Current Day Low (CDL)
- Previous Day High (PDH)
- Previous Day Low (PDL)
- Previous Day Close (PDC)
-
Weekly Levels
- Current Week Open (CWO)
- Current Week High (CWH)
- Current Week Low (CWL)
- Previous Week High (PWH)
- Previous Week Low (PWL)
- Previous Week Close (PWC)
Level Clustering
The TRN Smart Money Concepts indicator automatically clusters nearby levels to:
- Identify stronger liquidity zones
- Reduce analysis complexity
- Highlight high-probability areas
Combine liquidity levels with Order Blocks and Fair Value Gaps for stronger trade confirmation.
FAQ
What are liquidity levels in trading?
Liquidity levels are price points where significant trading activity occurs, typically around daily and weekly opens, highs, lows, and closes. These levels often act as magnets for price movement.
Why is level clustering important?
When multiple liquidity levels converge in a small price range, they create stronger zones of interest. The TRN indicator automatically identifies these clusters to highlight high-probability trading areas.
How do you trade liquidity levels?
Trade liquidity levels by waiting for price to approach clustered levels, then look for confirmation from Market Structure and Order Blocks. The strongest setups often occur when multiple levels align.