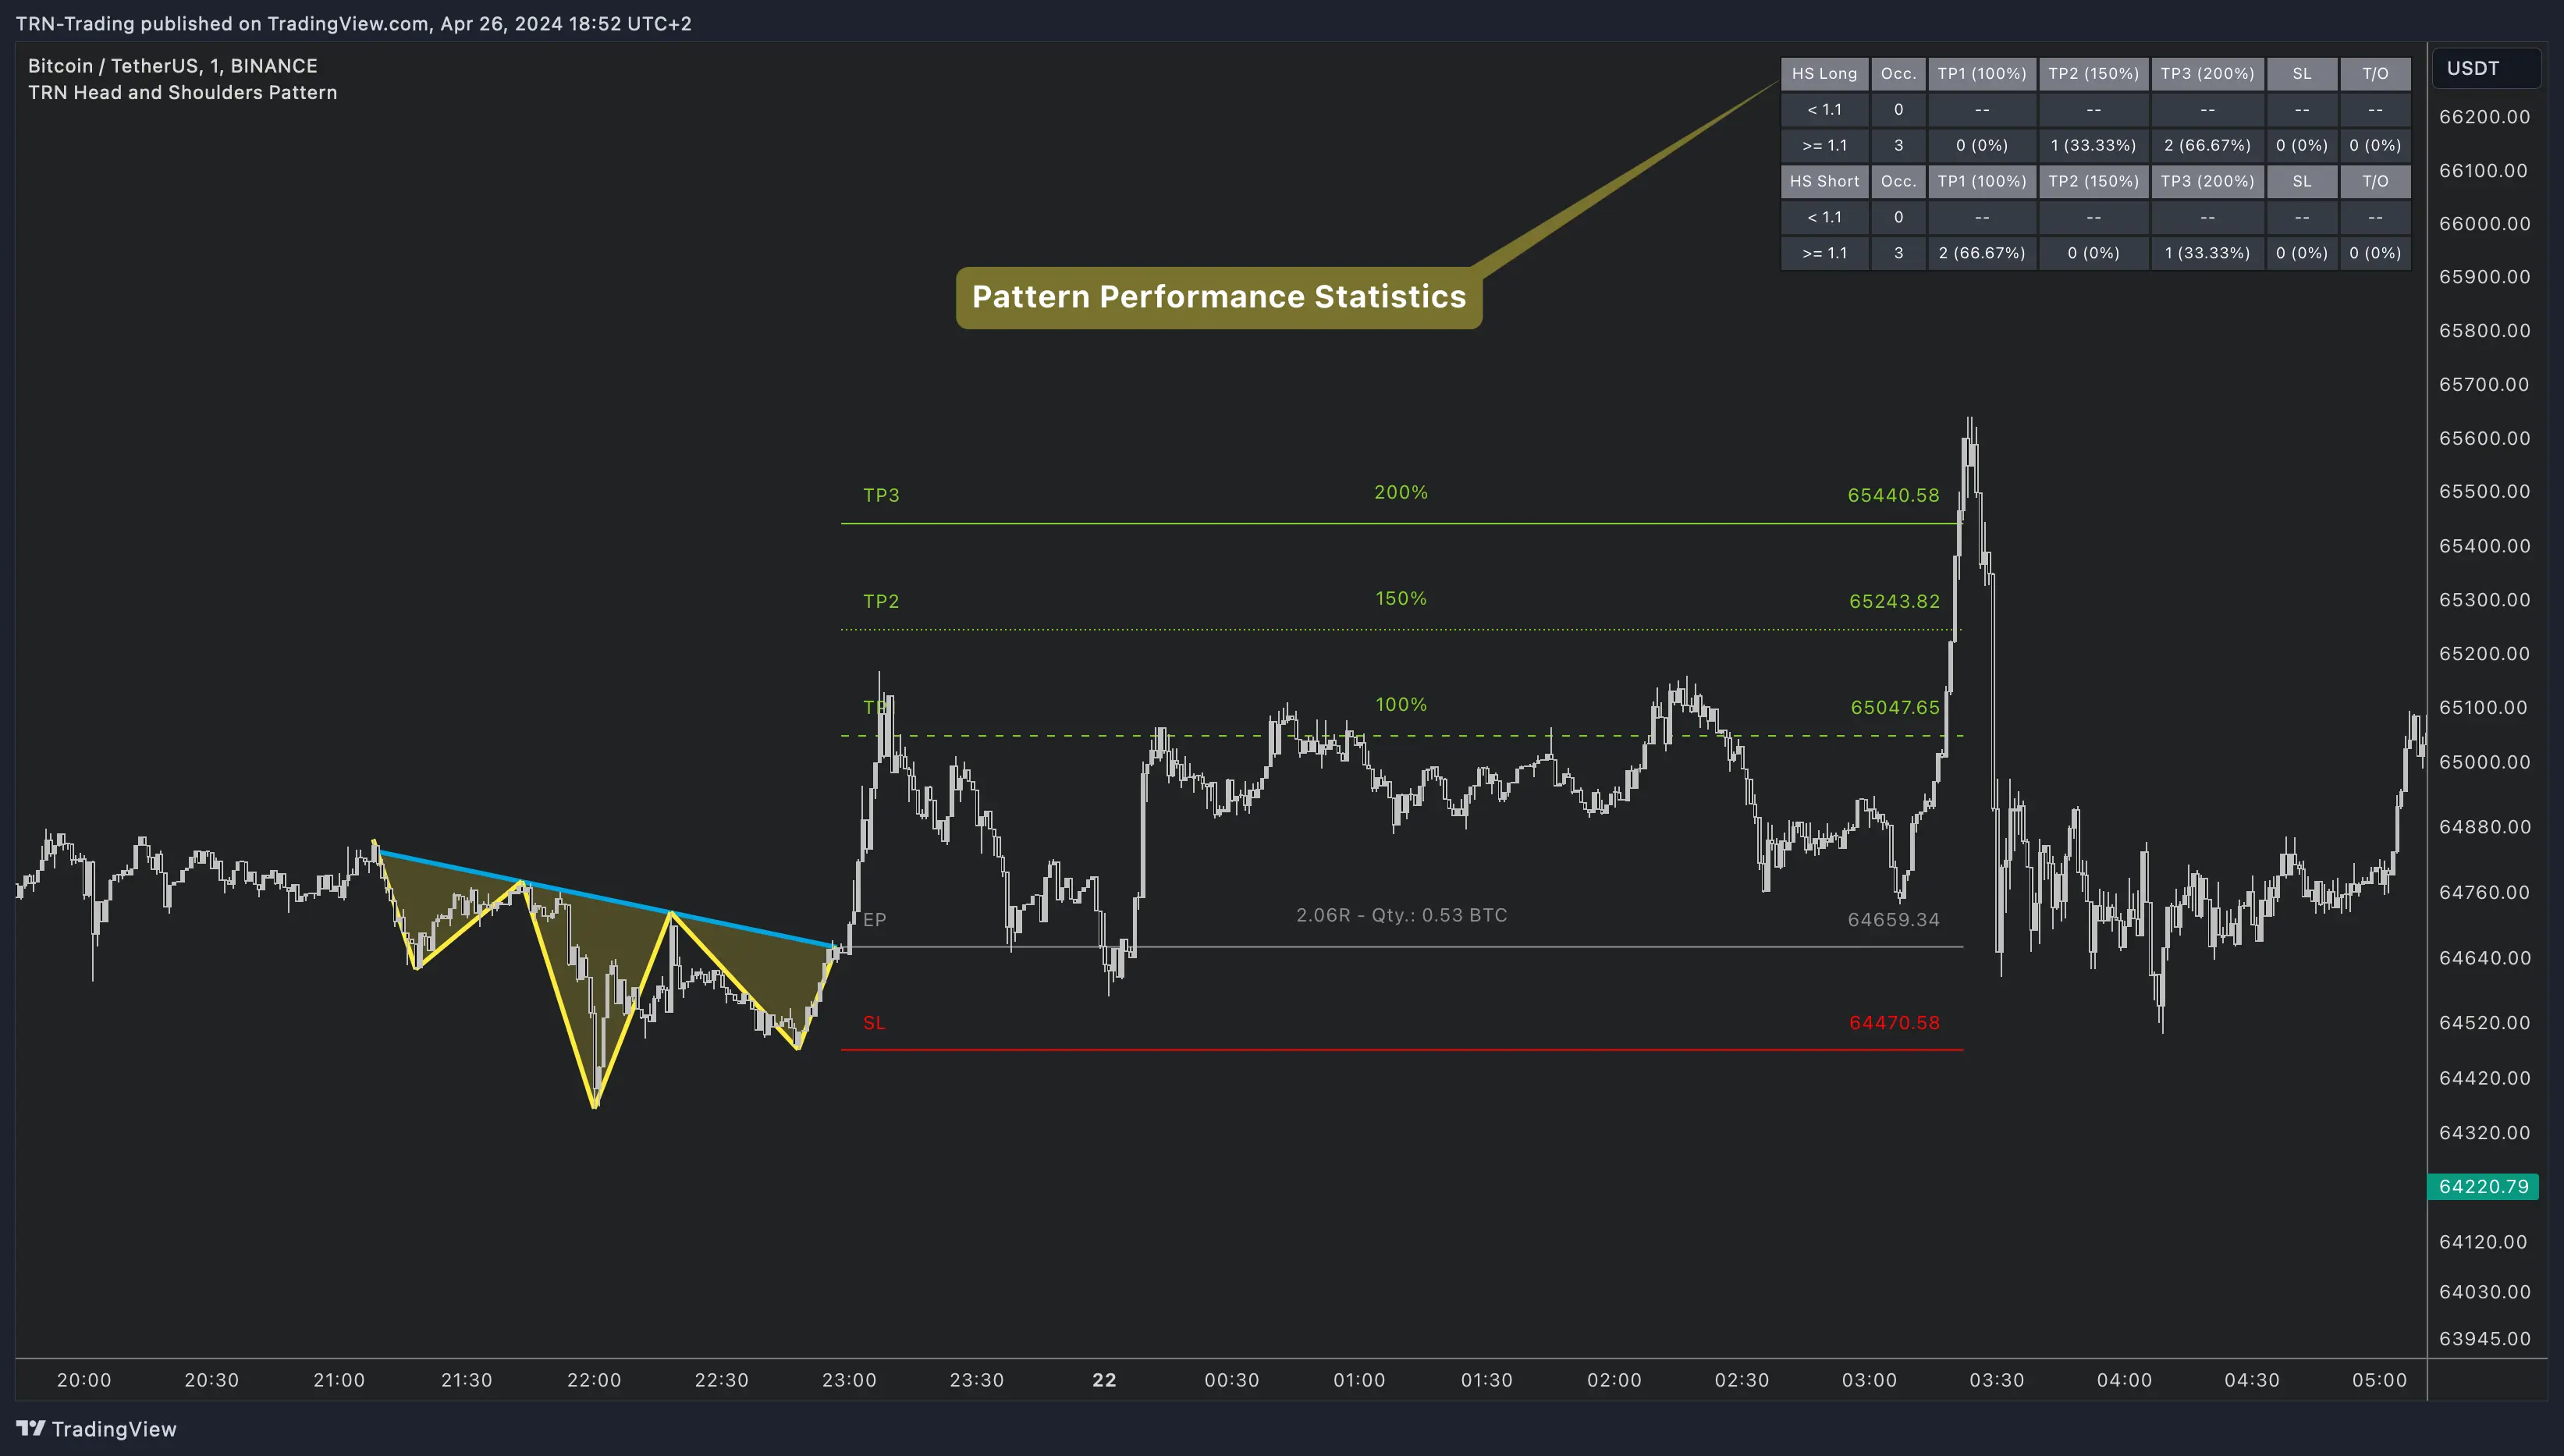
Head And Shoulders Pattern Statistics
Make data-driven trading decisions with our comprehensive pattern statistics. Our indicator tracks and analyzes pattern performance in real-time across multiple timeframes and markets.

Performance Analytics
Pattern Categories
Statistics are divided into two main categories:
- Long Positions: Inverse Head and Shoulders (bullish)
- Short Positions: Classic Head and Shoulders (bearish)
Key Metrics
1. Risk-Reward Analysis
- R < x: Patterns with lower risk-reward ratios
- R >= x: Patterns with higher risk-reward ratios
- Average R: Mean risk-reward across all patterns
2. Success Metrics
Each pattern type shows:
- Occurrence Rate: Pattern frequency
- Success Rate: Profitable trades percentage
- Failure Rate: Unsuccessful trades percentage
Performance Breakdown

Our statistics panel provides detailed performance data:
-
Take Profit Success:
- TP1: Short-term target success rate
- TP2: Medium-term target success rate
- TP3: Long-term target success rate
-
Risk Management Metrics:
- Stop Loss hit frequency
- Time-out occurrences
- Average holding time
Statistical Analysis Tools
1. Pattern Quality Score
Evaluate pattern reliability using:
- Symmetry analysis
- Volume confirmation
- Price action context
- Time frame correlation
2. Market Context
Filter patterns based on:
- Trend strength
- Volatility levels
- Trading session
- Market conditions
3. Optimization Features
Fine-tune your strategy with:
- Historical backtesting
- Parameter optimization
- Custom filters
- Performance tracking
FAQ
What is a good success rate for head and shoulders patterns?
A well-formed head and shoulders pattern typically has a 60-75% success rate when traded with proper confirmation and risk management. Learn more in our pattern guide.
Which timeframe shows the best statistical performance?
Higher timeframes (4H and Daily) generally show better success rates due to reduced noise and stronger trend signals. See our usage guide for optimal timeframe selection.
How can I improve my pattern trading statistics?
Focus on patterns with strong volume confirmation, clear market context, and proper risk management. Use our optimization tools to refine your entry and exit points.