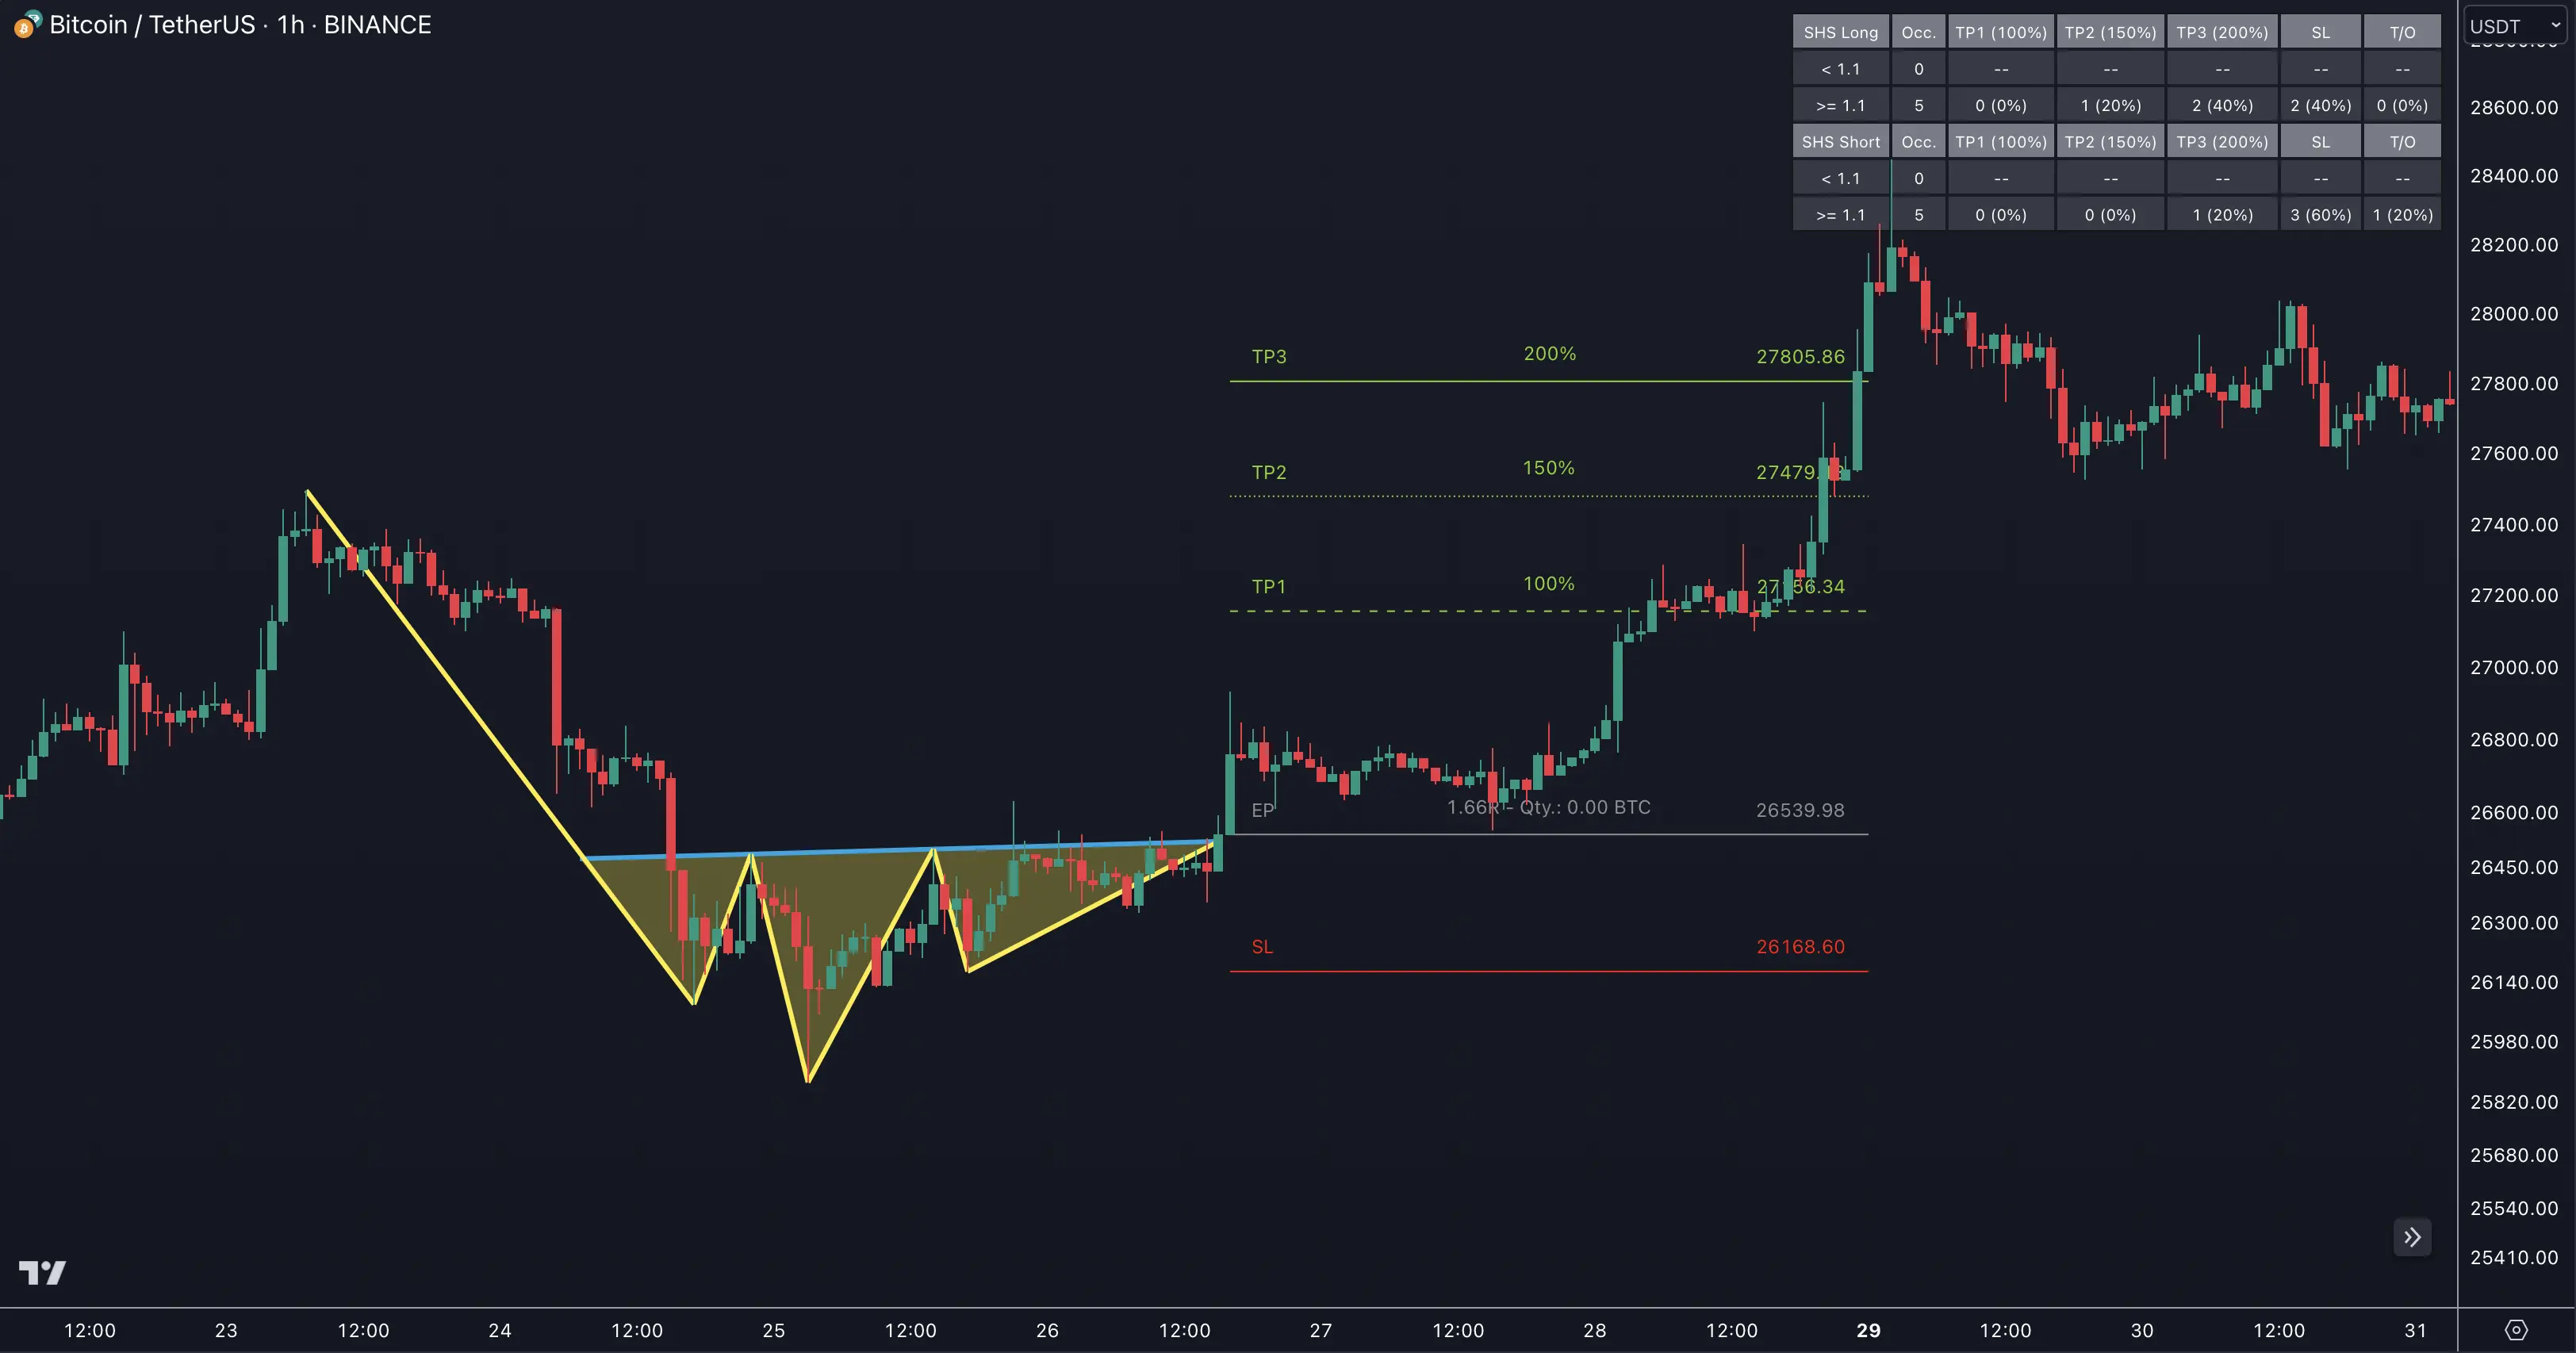
Head And Shoulders Pattern
The head and shoulders pattern is a powerful trend reversal formation that helps traders identify potential market turning points with high accuracy.
Pattern Formation

The pattern consists of three distinct peaks:
- A central peak (the "head")
- Two lower peaks (the "shoulders")
- A connecting support/resistance line (the "neckline")
Pattern Types
Classic Head and Shoulders
A bearish reversal pattern forming in uptrends:
- Forms after an established uptrend
- Head peak higher than shoulder peaks
- Neckline connects the reaction lows
- Breakout occurs downward through neckline
Inverse Head and Shoulders
A bullish reversal pattern forming in downtrends:
- Forms after an established downtrend
- Head trough lower than shoulder troughs
- Neckline connects the reaction highs
- Breakout occurs upward through neckline
Key Components
1. Pattern Structure
- Left Shoulder: Initial peak/trough formation
- Head: Central, most extreme price point
- Right Shoulder: Final peak/trough
- Neckline: Trendline connecting reaction points
2. Volume Analysis
Volume characteristics enhance pattern reliability:
- Decreasing volume during pattern formation
- Volume surge on neckline breakout
- Higher volume on left shoulder vs right shoulder
3. Breakout Confirmation
Reliable breakouts show:
- Clear neckline breach
- Strong volume confirmation
- Potential retest of neckline
Trading Strategy
Entry Points
-
Conservative Entry:
- Wait for neckline breakout
- Confirm with volume surge
- Enter on first retest
-
Aggressive Entry:
- Enter on right shoulder formation
- Place stop above/below head
- Add on neckline break
Target Projection
Calculate price targets using:
- Measure head to neckline distance
- Project equal distance from breakout point
- Use Fibonacci extensions for additional targets
Combine with Trend Bars Pro for enhanced breakout confirmation and trend direction validation.
FAQ
What is the success rate of head and shoulders patterns?
When properly identified with volume confirmation, head and shoulders patterns have a success rate of approximately 70-80%. Learn more in our statistics section.
Where should I place my stop-loss orders?
For conservative trades, place stops above/below the right shoulder. For aggressive entries, place stops above/below the head. See our risk management guide for detailed strategies.
How important is volume in pattern confirmation?
Volume is crucial for pattern validation. Ideally, volume should decrease during formation and increase significantly on breakout.