Built-In Oscillators (Divergence Suite)
The TRN SMT/Divergence Suite comes with 11 powerful built-in oscillators, carefully selected to provide comprehensive market analysis capabilities.
Momentum Oscillators
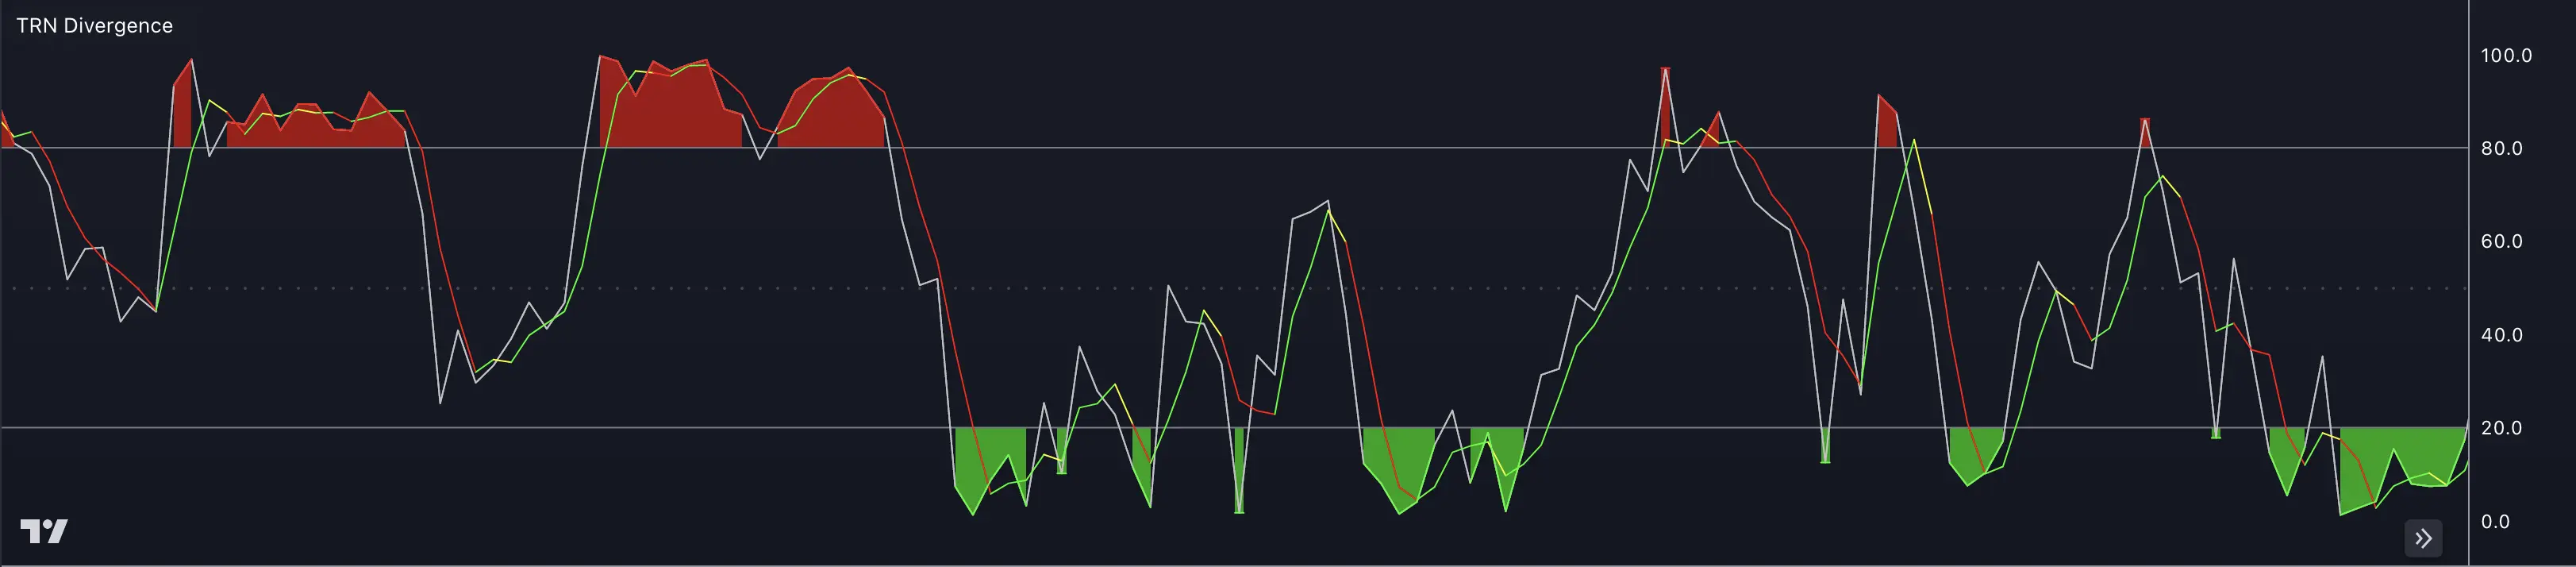
Relative Strength Index (RSI)

The Relative Strength Index (RSI) is a popular technical indicator used in trading to measure the magnitude and velocity of price movements. It is primarily used to identify overbought and oversold conditions of a security or market.
The RSI is typically displayed as a line graph that oscillates between 0 and 100. The indicator provides insights into the strength and potential reversal points of a trend.
Default Parameters

Money Flow Index (MFI)

The Money Flow Index (MFI) is a technical indicator used in trading to measure the strength and intensity of money flow into and out of a security or market. It combines price and volume data to provide insights into buying and selling pressure. The MFI is displayed as a line graph that oscillates between 0 and 100.
Default Parameters
Momentum (MOM)
The Momentum oscillator (MOM) is a technical indicator used in trading to measure the speed or velocity of price changes. It compares the current price of a security or market to the price of the same security at a previous period, typically the closing price.
Default Parameters

Stochastic %K and Stochastic %D
The Stochastic Oscillator is another oscillator that falls into the category of momentum oscillators. It compares the current price with the price range over a specific period.
Default Parameters
Williams Percentage Range (W%R)
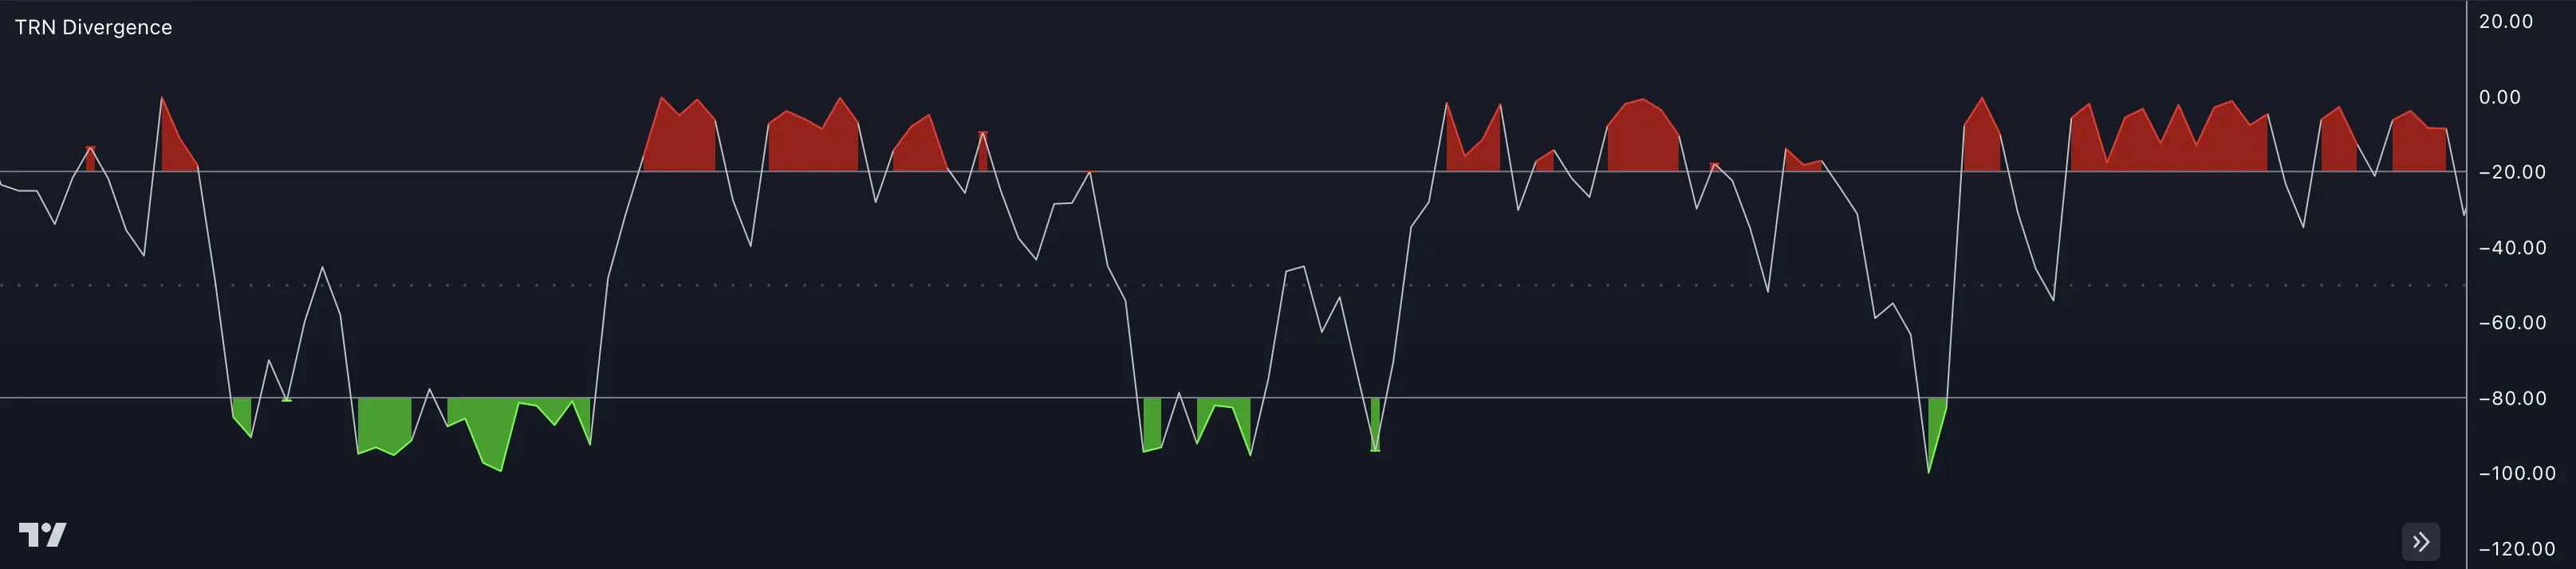
The Williams Percentage Range (W%R) is a technical indicator used in trading to measure overbought and oversold conditions of a security or market. It was developed by Larry Williams and is also referred to as Williams %R.
Default Parameters
Commodity Channel Index (CCI)
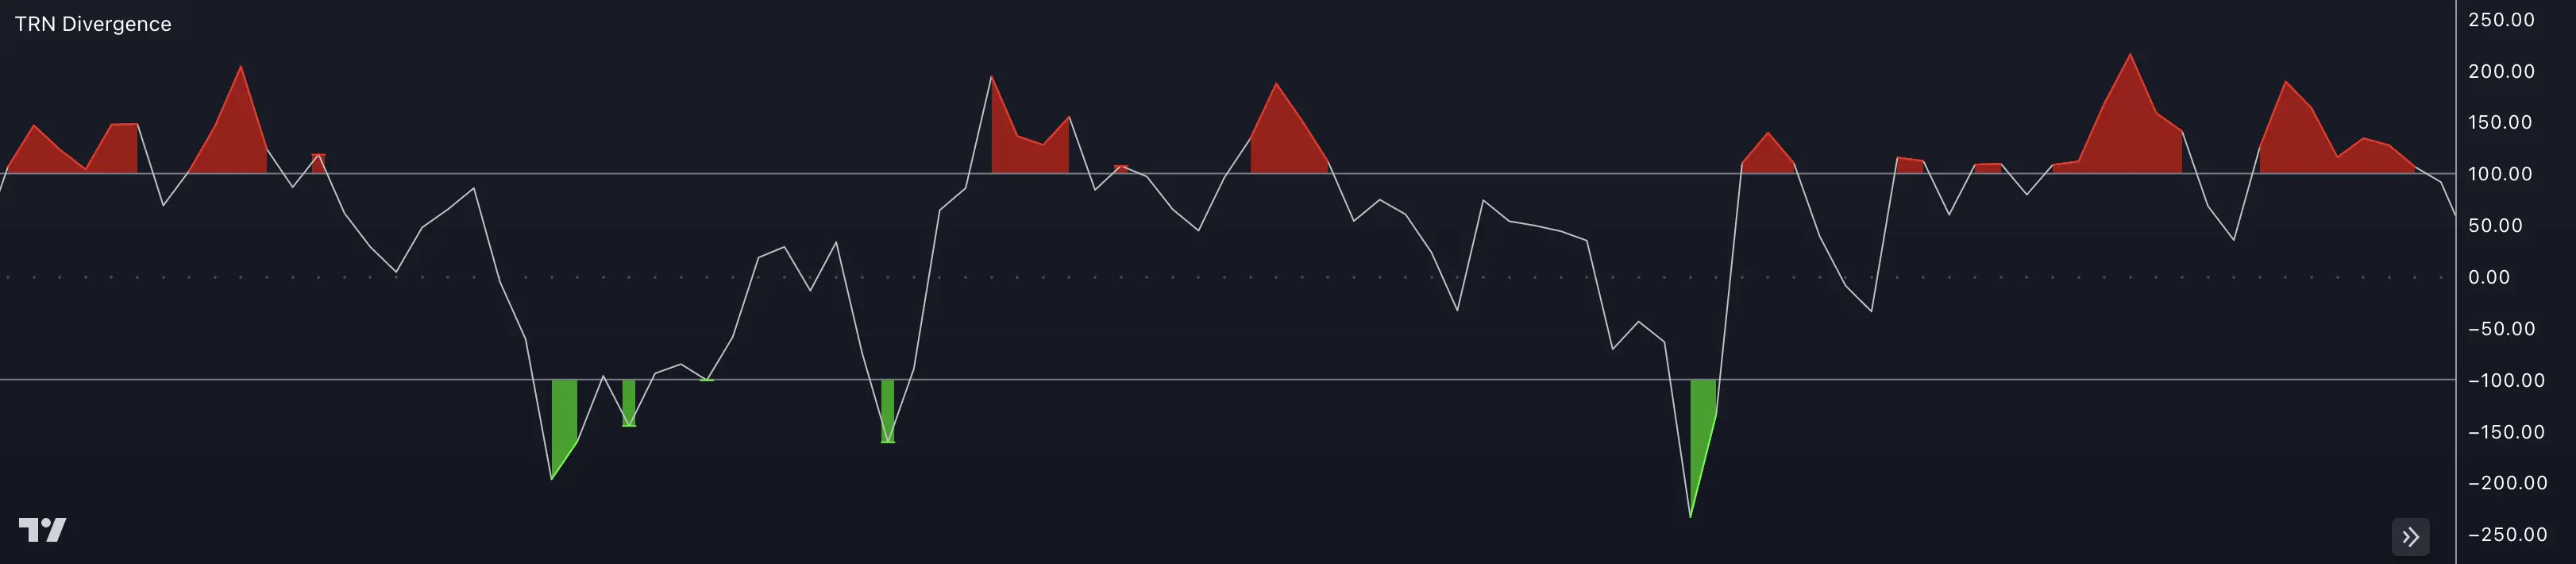
The Commodity Channel Index (CCI) is a technical indicator used in trading to identify potential overbought and oversold conditions in a security or market. It was developed by Donald Lambert and is used to measure the variation of a security's price from its statistical mean.
Default Parameters

Trend-Following Oscillators
Moving Average Convergence Divergence (MACD)
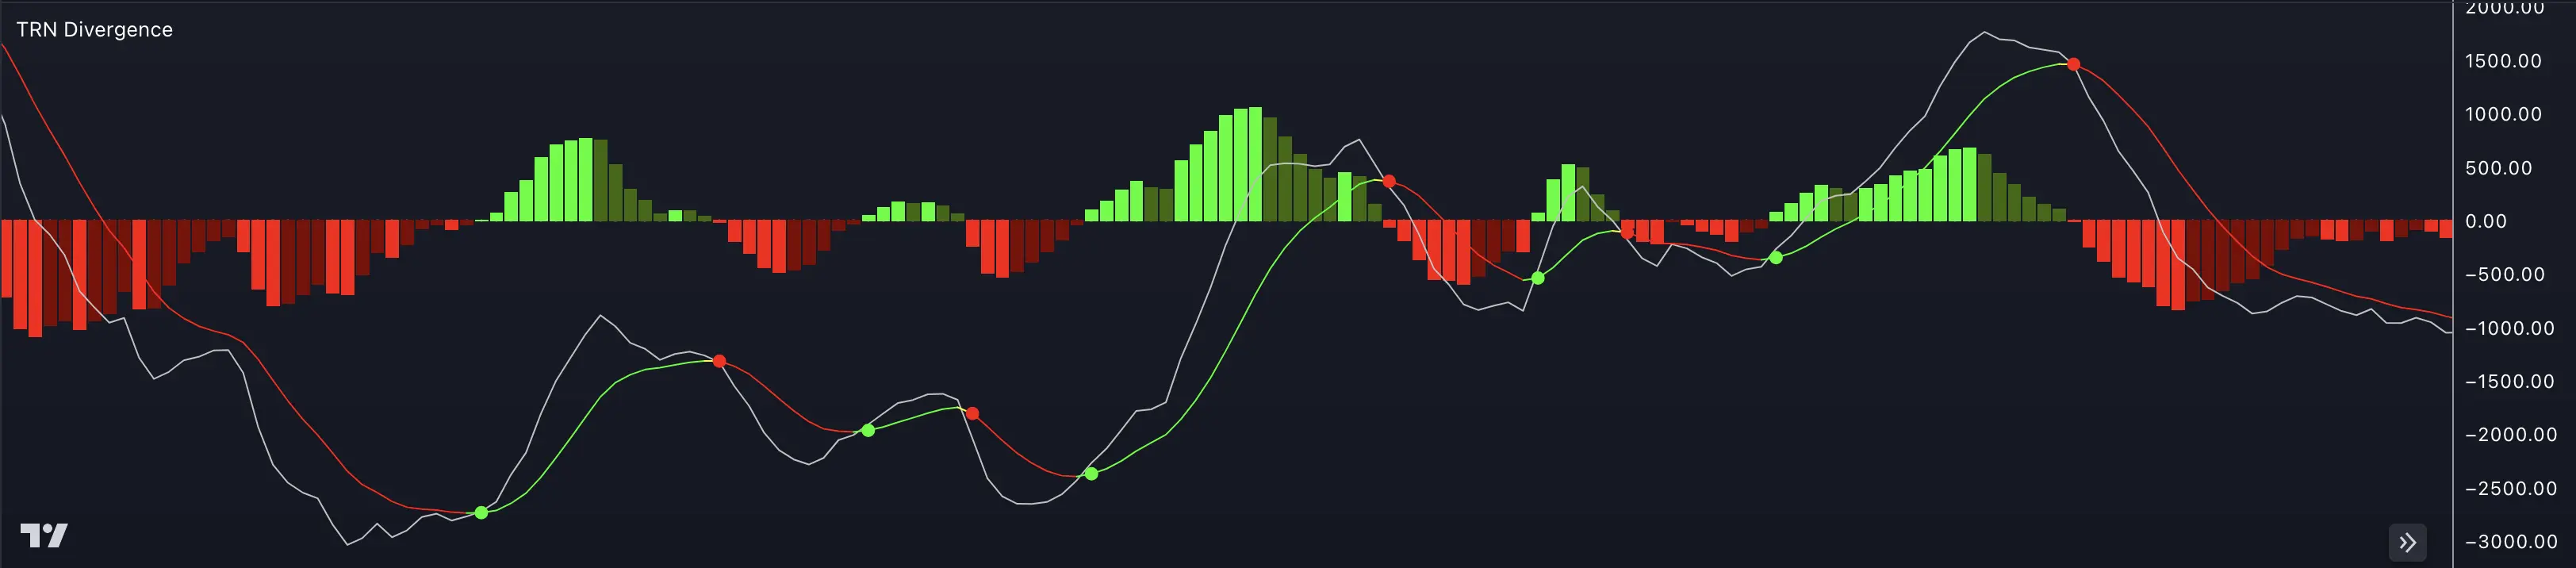
The Moving Average Convergence Divergence (MACD) is a popular technical indicator used in trading to identify potential trend reversals, generate buy and sell signals, and measure the strength of a trend.
Default Parameters

Awesome Oscillator (AO)
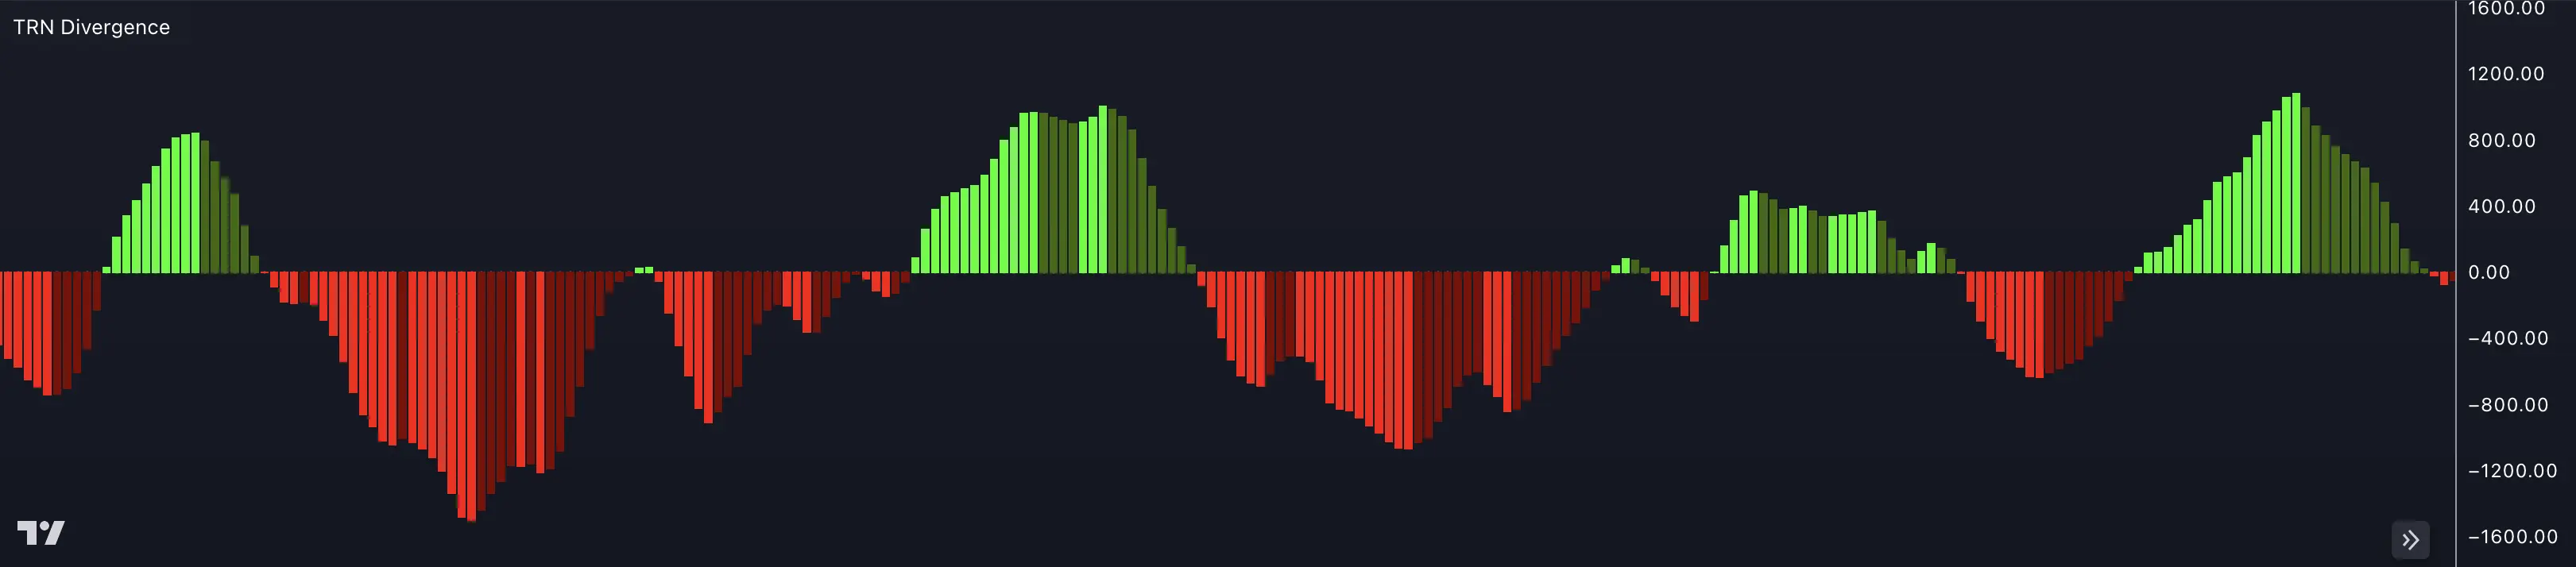
The Awesome Oscillator (AO) is a technical indicator used in trading to measure the market's momentum and the potential trend reversals. It was developed by Bill Williams to complement his trading system described in his book "New Trading Dimensions."
Default Parameters
Volume Oscillators
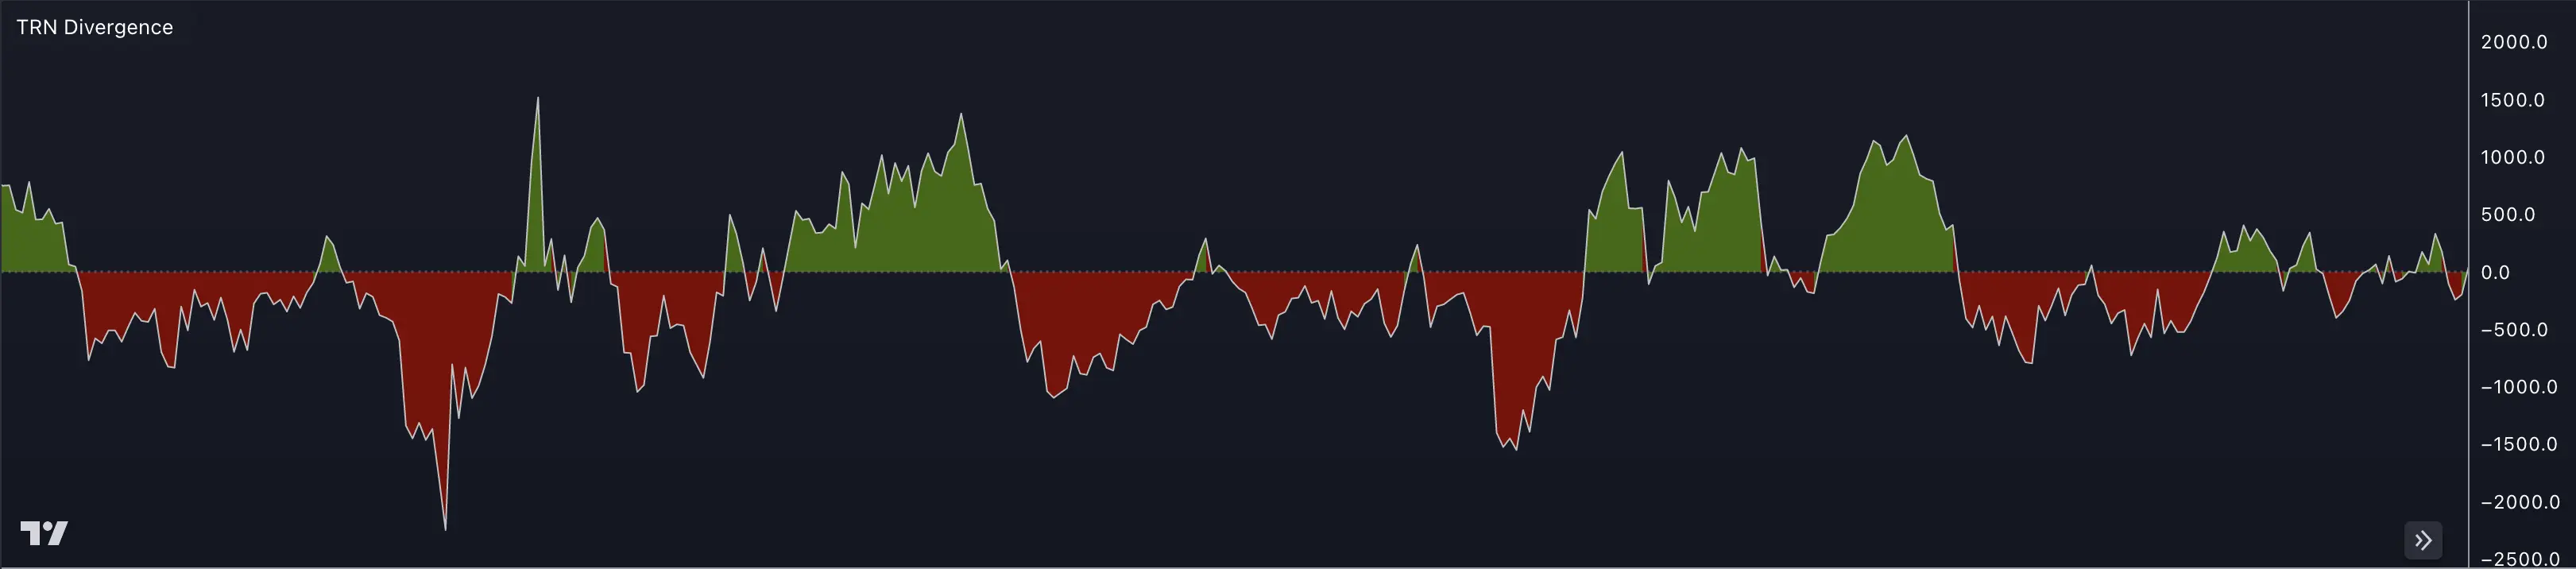
Cumulative Delta Volume (CDV)
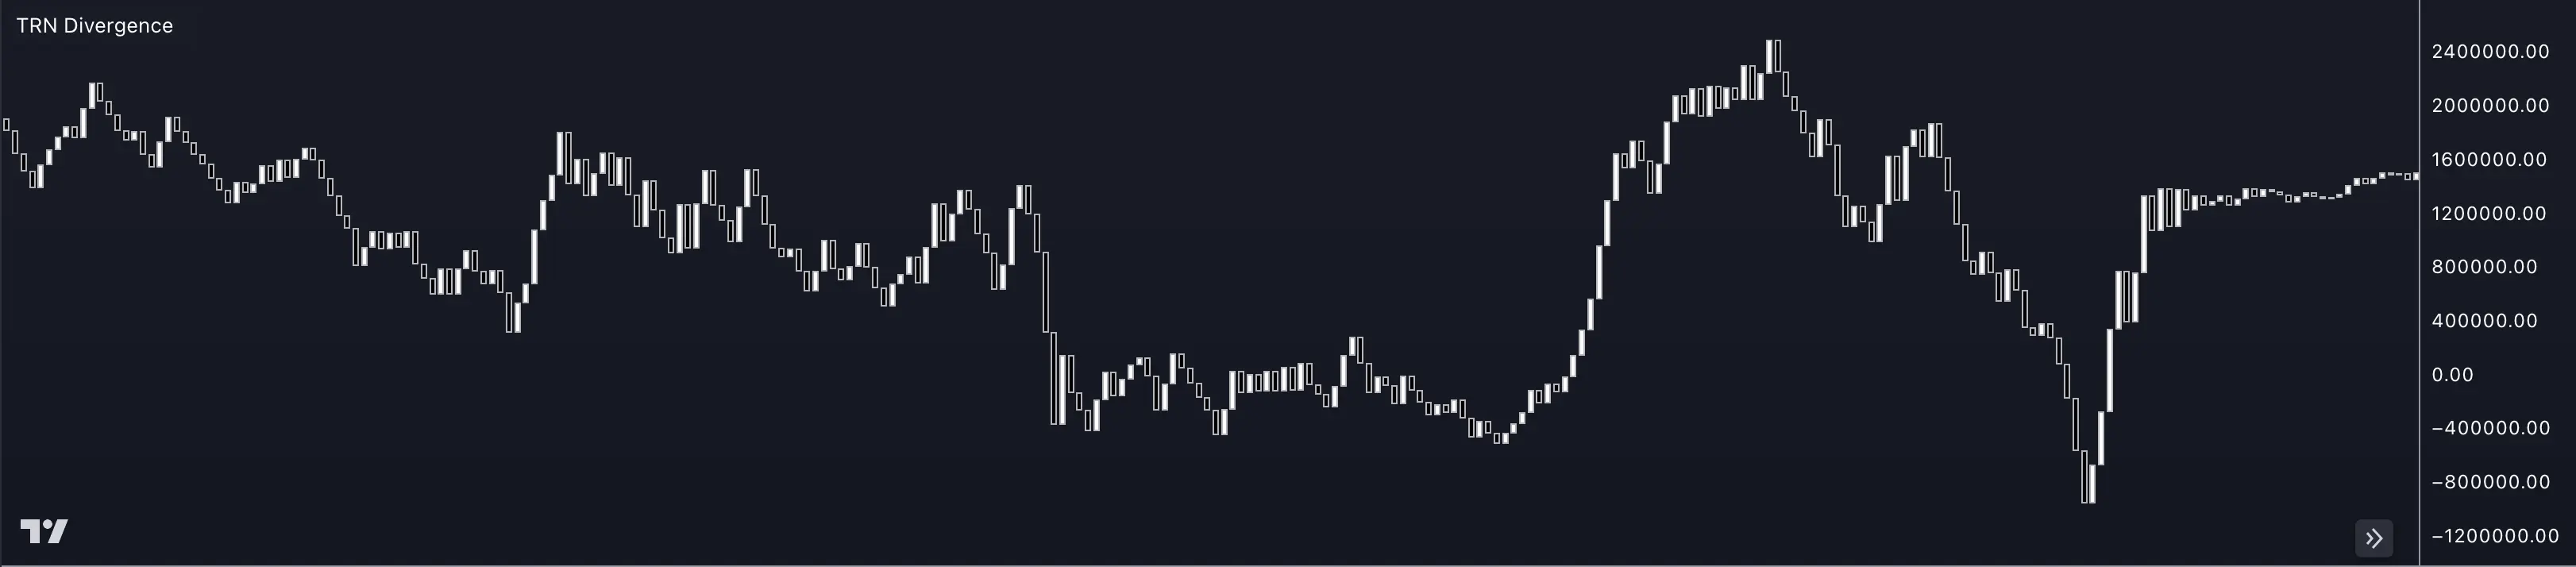
Cumulative Delta is a trading indicator that measures the net buying or selling pressure in the market by analyzing the difference between the volume of buying and selling transactions at each price level.
Default Parameters
On Balance Volume (OBV)
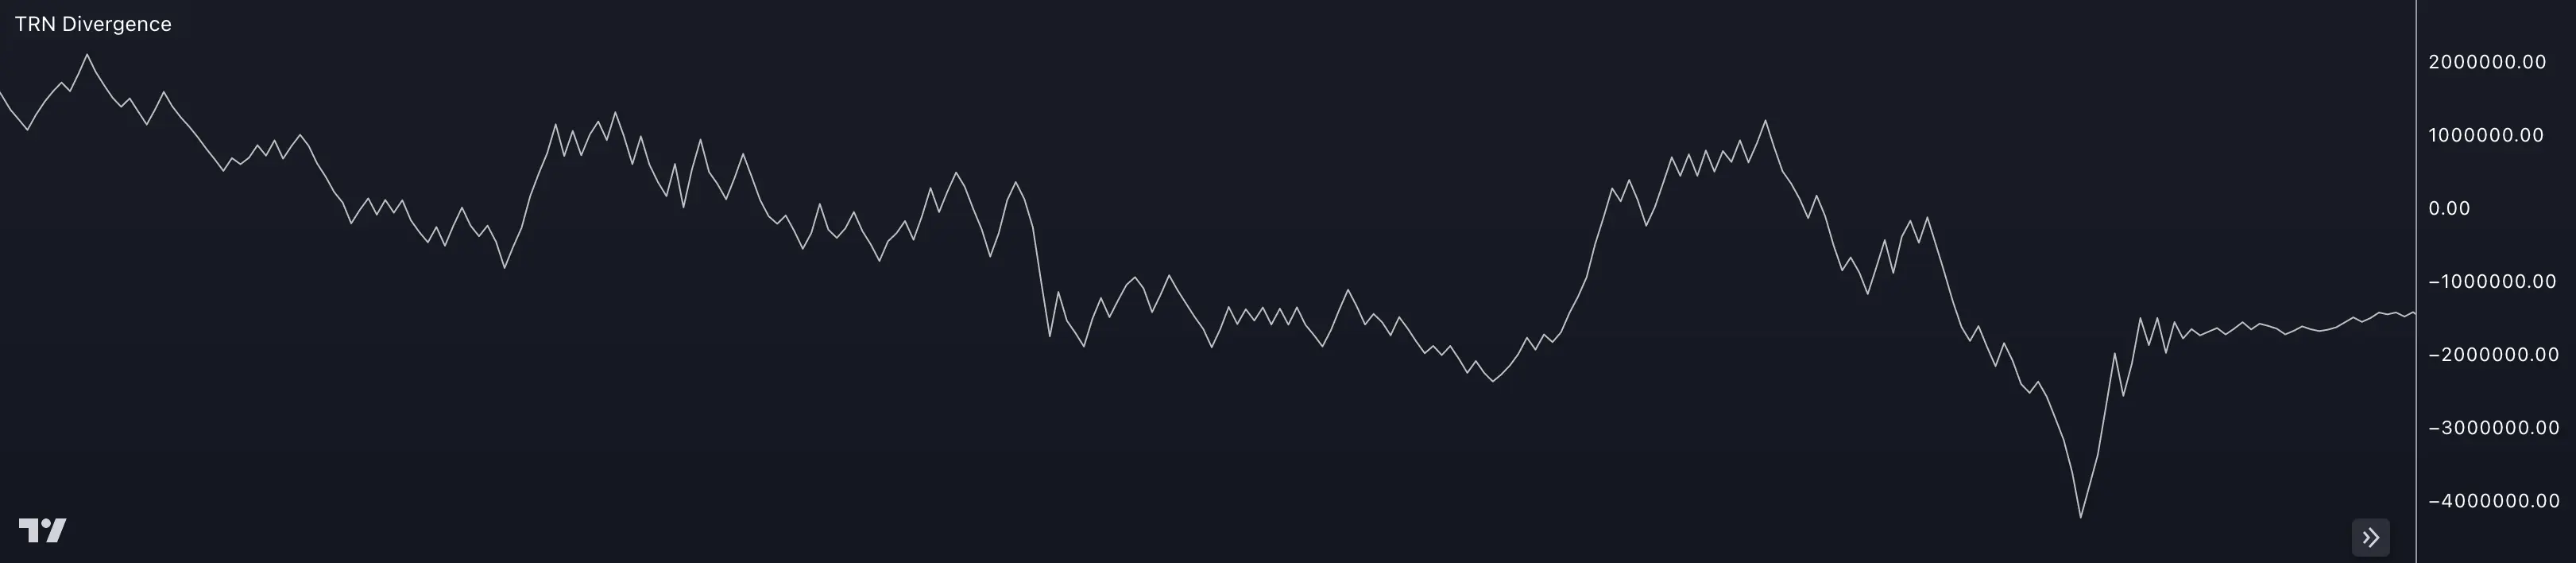
On-Balance Volume (OBV) is a technical indicator used in trading to measure the cumulative buying and selling pressure behind a financial asset.
Default Parameters

Chaikin Money Flow (CMF)
Chaikin Money Flow (CMF) is a technical indicator used in trading to measure the accumulation or distribution of a financial asset based on both price and volume.
Default Parameters

FAQ
Which oscillator is best for beginners?
RSI is often recommended for beginners due to its simplicity and effectiveness in identifying overbought/oversold conditions.