Market Scanner
Utilize our TradingView integrated Market Scanner to effortlessly scan your preferred assets and timeframes for emerging patterns, Signal Bars, Divergences and many other signals delivered by our advanced trading tools. With its automated functionality, the Market Scanner diligently identifies potential trading opportunities on your behalf. Stay informed and never miss out on a favorable setup by leveraging the integrated alert function. Receive instant notifications anytime and from anywhere whenever the Market Scanner identifies a successful search result. Stay ahead of the game with our powerful and convenient trading tool.
Loading our Market Scanners onto your chart might require a bit of patience. Occasionally, you might encounter a timeout issue resulting in the scanner not displaying properly. Should this occur, kindly delete the Market Scanner from your chart, then re-add it. Alternatively, you can switch to a different timeframe or refresh the website to address the matter.
Pattern Scanner
Every TRN Chart Pattern is accompanied by a specially designed Market Scanner tailored to its distinct requirements. Select the pattern you want to search for and the particular market scanner will do the work. Never miss out on any signals for your preferred asset with the integrated real-time alerts.
Follow these instructions to discover how you can utilize the scanner for seamless and simplified chart pattern detection like never before:
1. Activate Scanner
Just add scanner and pattern you want to search for to your chart. Visit our section "Setup Our Tools On TradingView" if you want to know how to get access to the tools.
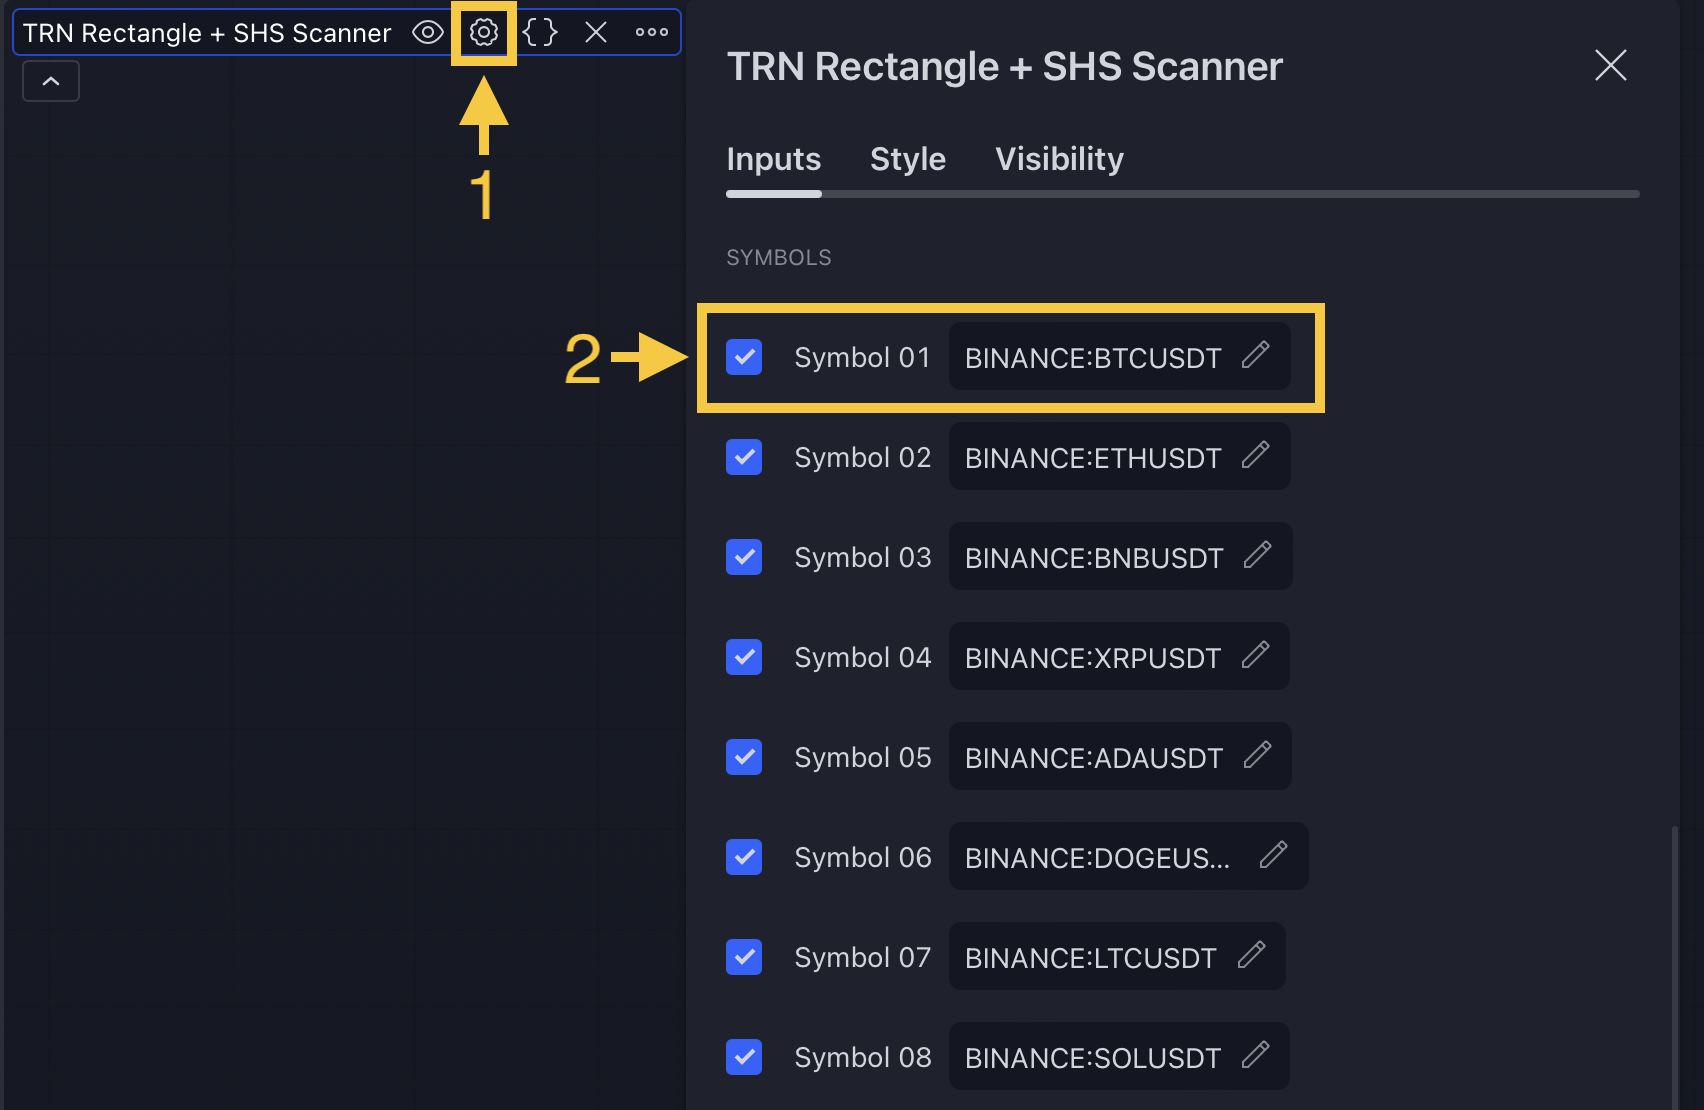
2. Add Symbols
Go to indicator settings (1) and scroll down to the "Symbols" section. The enabled symbols can be recognized by the check marks. Click on one of them (2) and use the search function to add the symbol of your choice to the scanner. You can search on up to 40 different Symbols at the same time.
3. Find Patterns And Signals
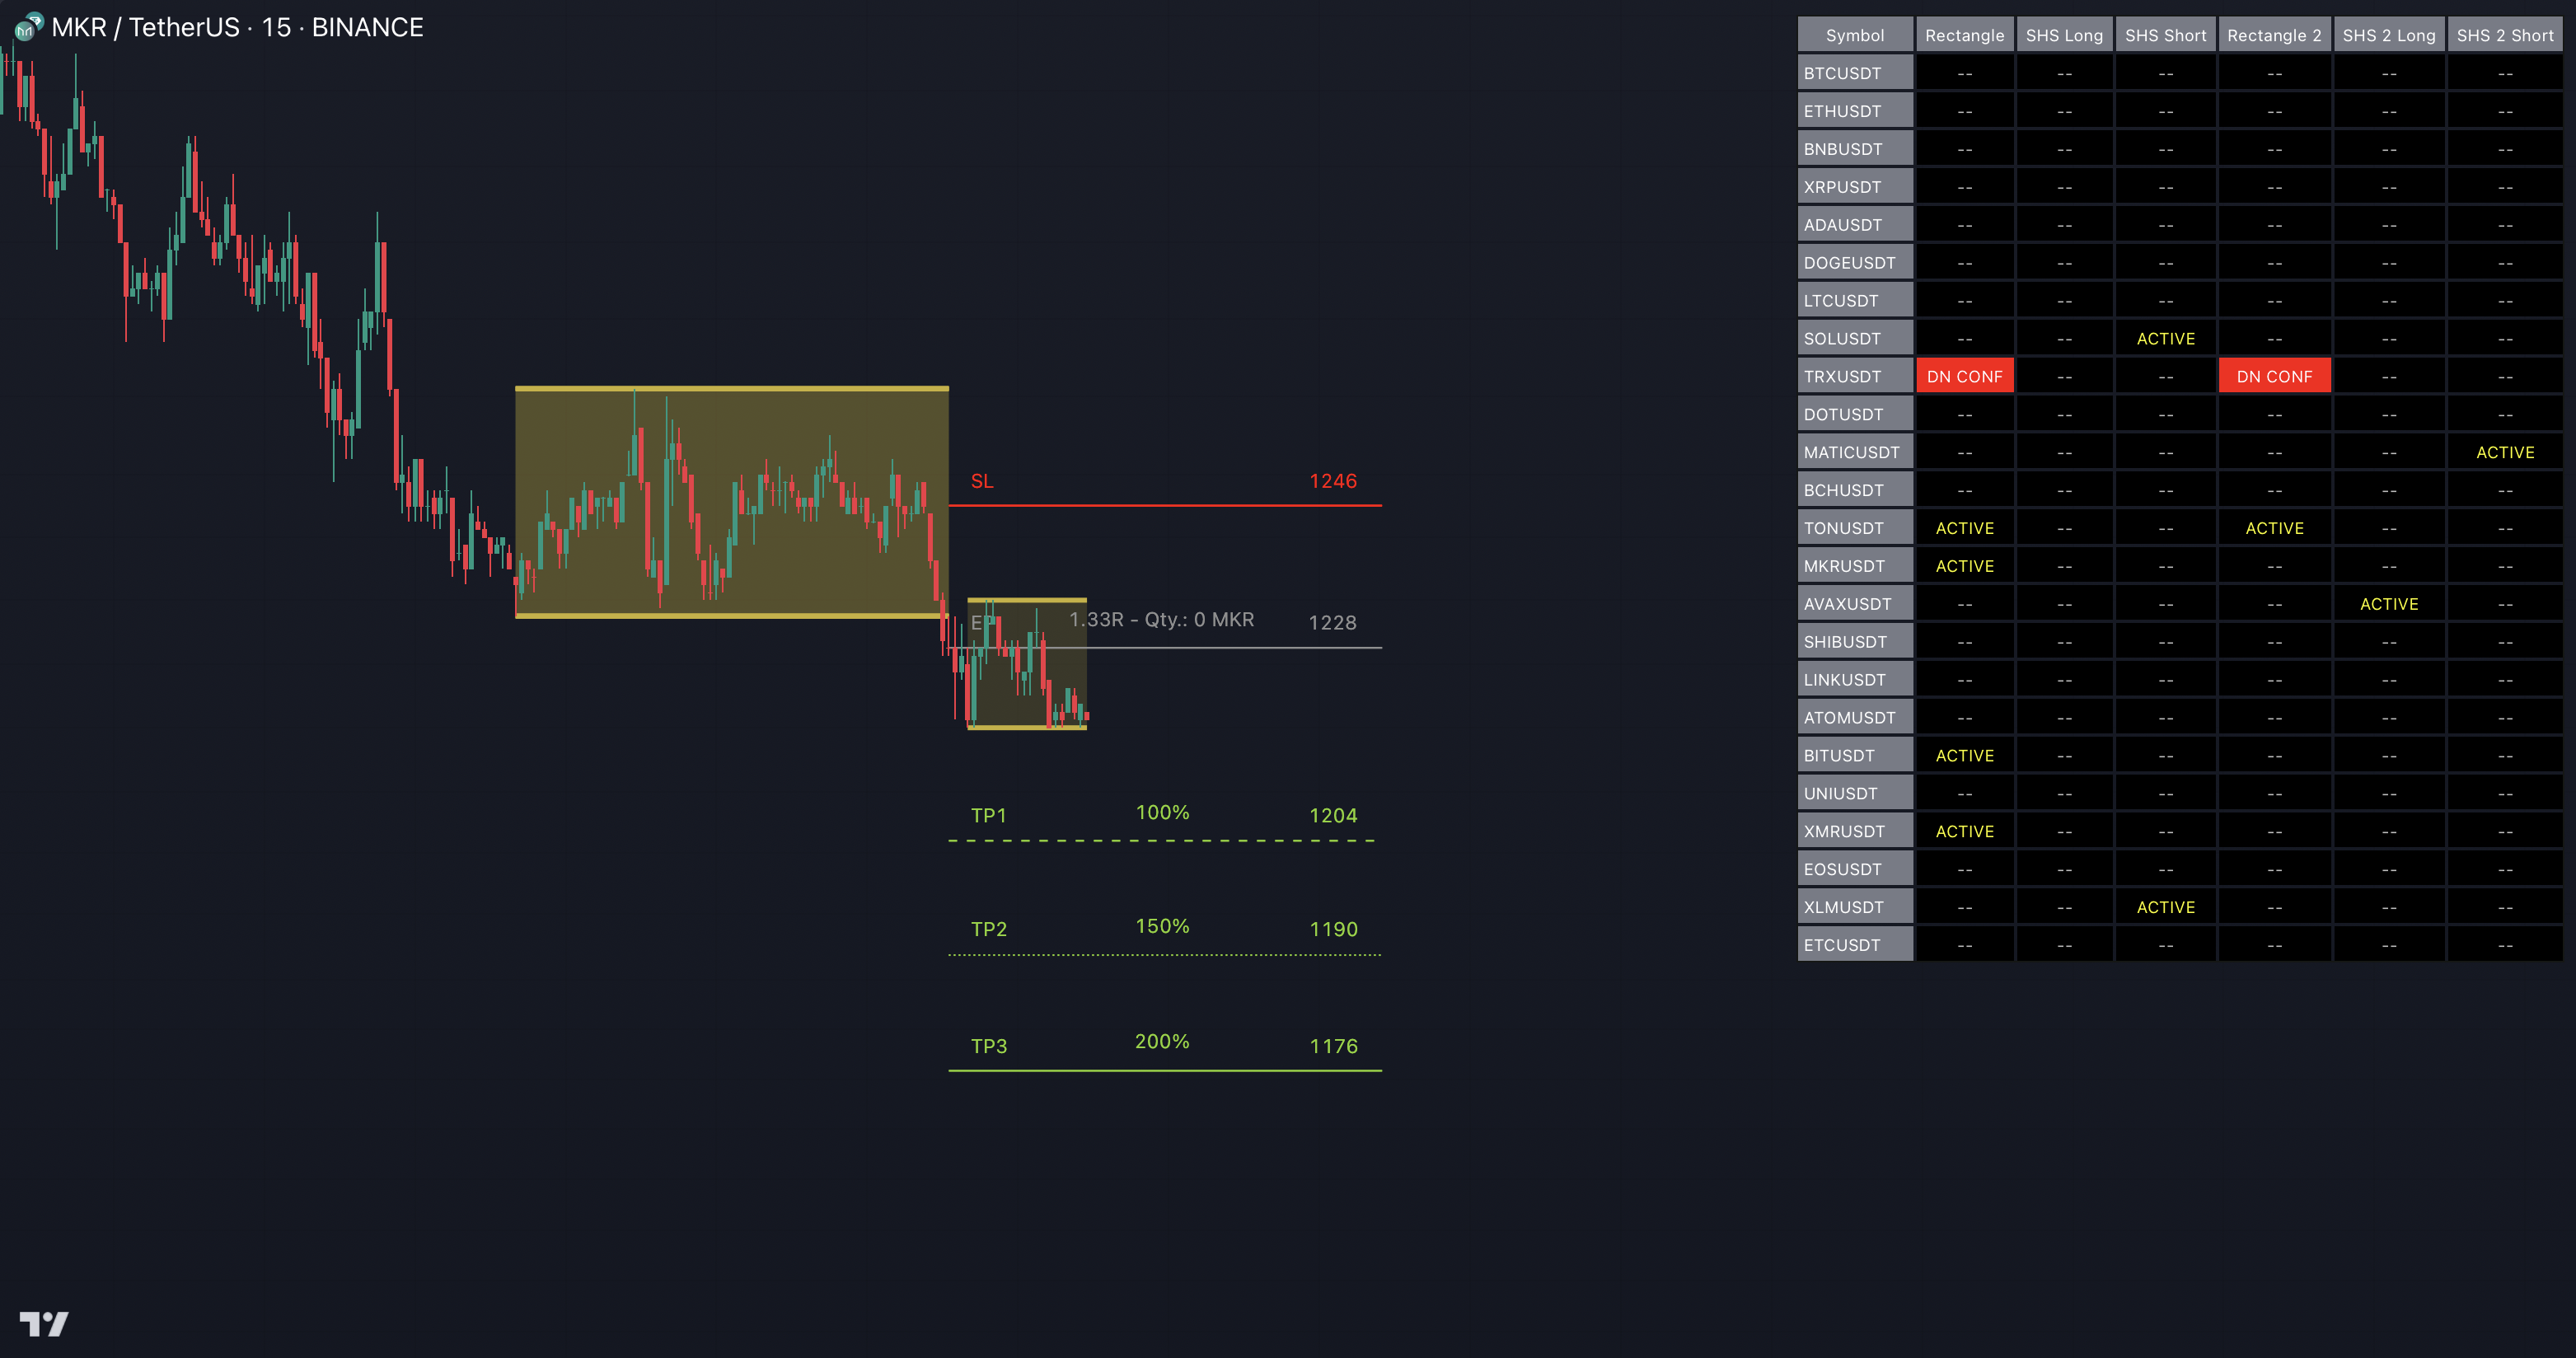
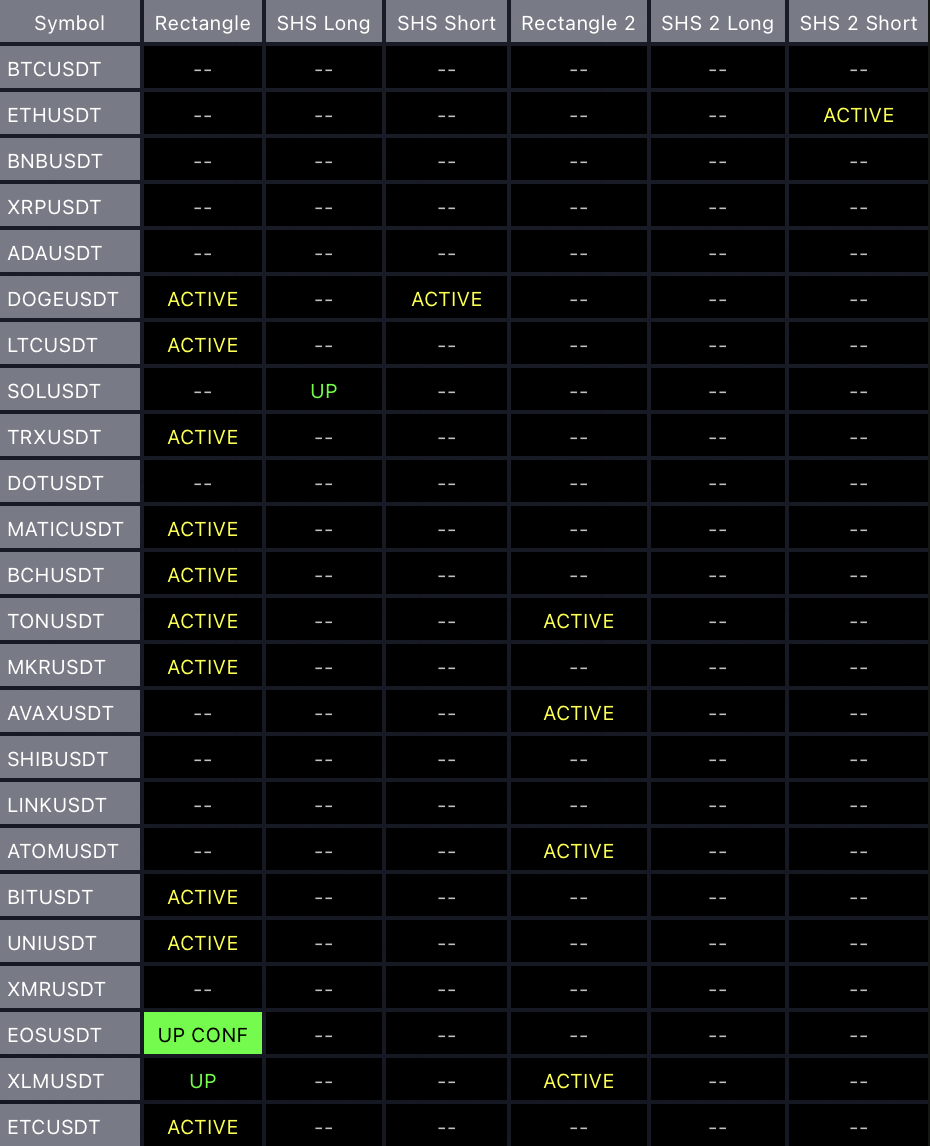
On the right side of the chart, you can find a table displaying the symbols monitored by our scanner for pattern and breakout detection (first column). The table provides information on the status of each symbol, indicating whether a pattern is actively forming (ACTIVE), breaking out to the upside (UP), breaking out to the downside (DN), confirming a breakout to the upside (UP CONF) or to the downside (DN CONF) or failed to get confirmed (FAILED). This visual representation allows you to quickly identify the evolving pattern dynamics across different symbols, helping you stay informed and make timely trading decisions.
The scanner operates specifically on the timeframe you have selected in TradingView. It focuses its search on the exact timeframe you are currently viewing, ensuring that the detected patterns and breakouts align precisely with your trading perspective.
Go to the chart of the symbol a pattern is active on or breaking out and start trading it.
Be sure to check out the sections about the TRN Chart Patterns to fully understand how to spot and trade their signals properly.
4. Use Alerts (Optional But Recommended)
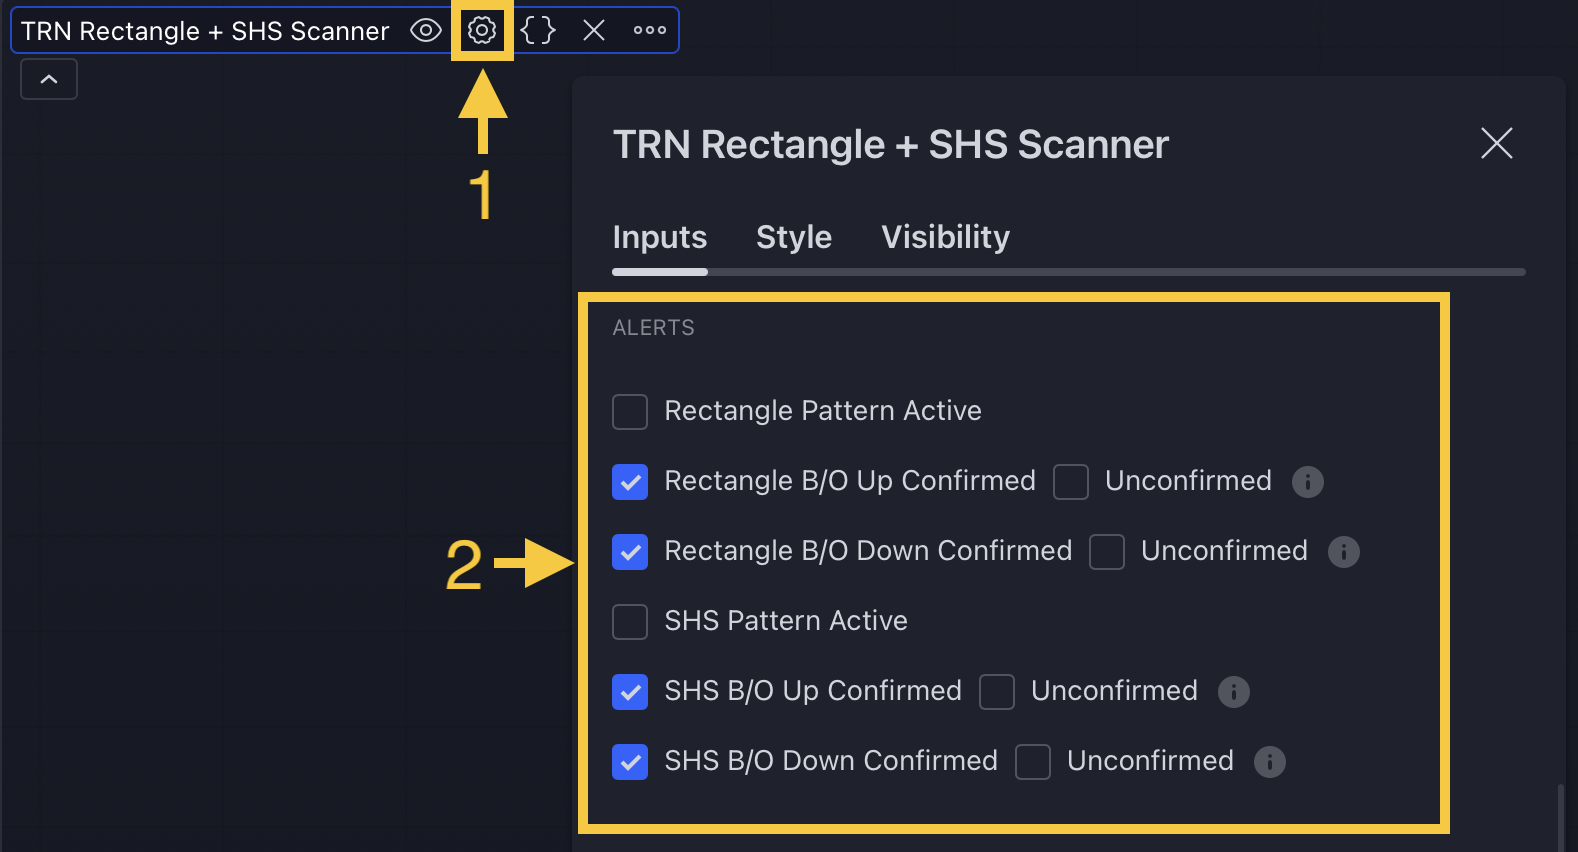
To access the desired options, navigate back to the indicator settings (1) menu and continue scrolling until you reach the "Alerts" section (2). Within this section, you have the flexibility to customize your notification preferences based on different stages of pattern development. You can choose to receive alerts when a pattern is initially formed, when it breaks out, or when a breakout is confirmed.
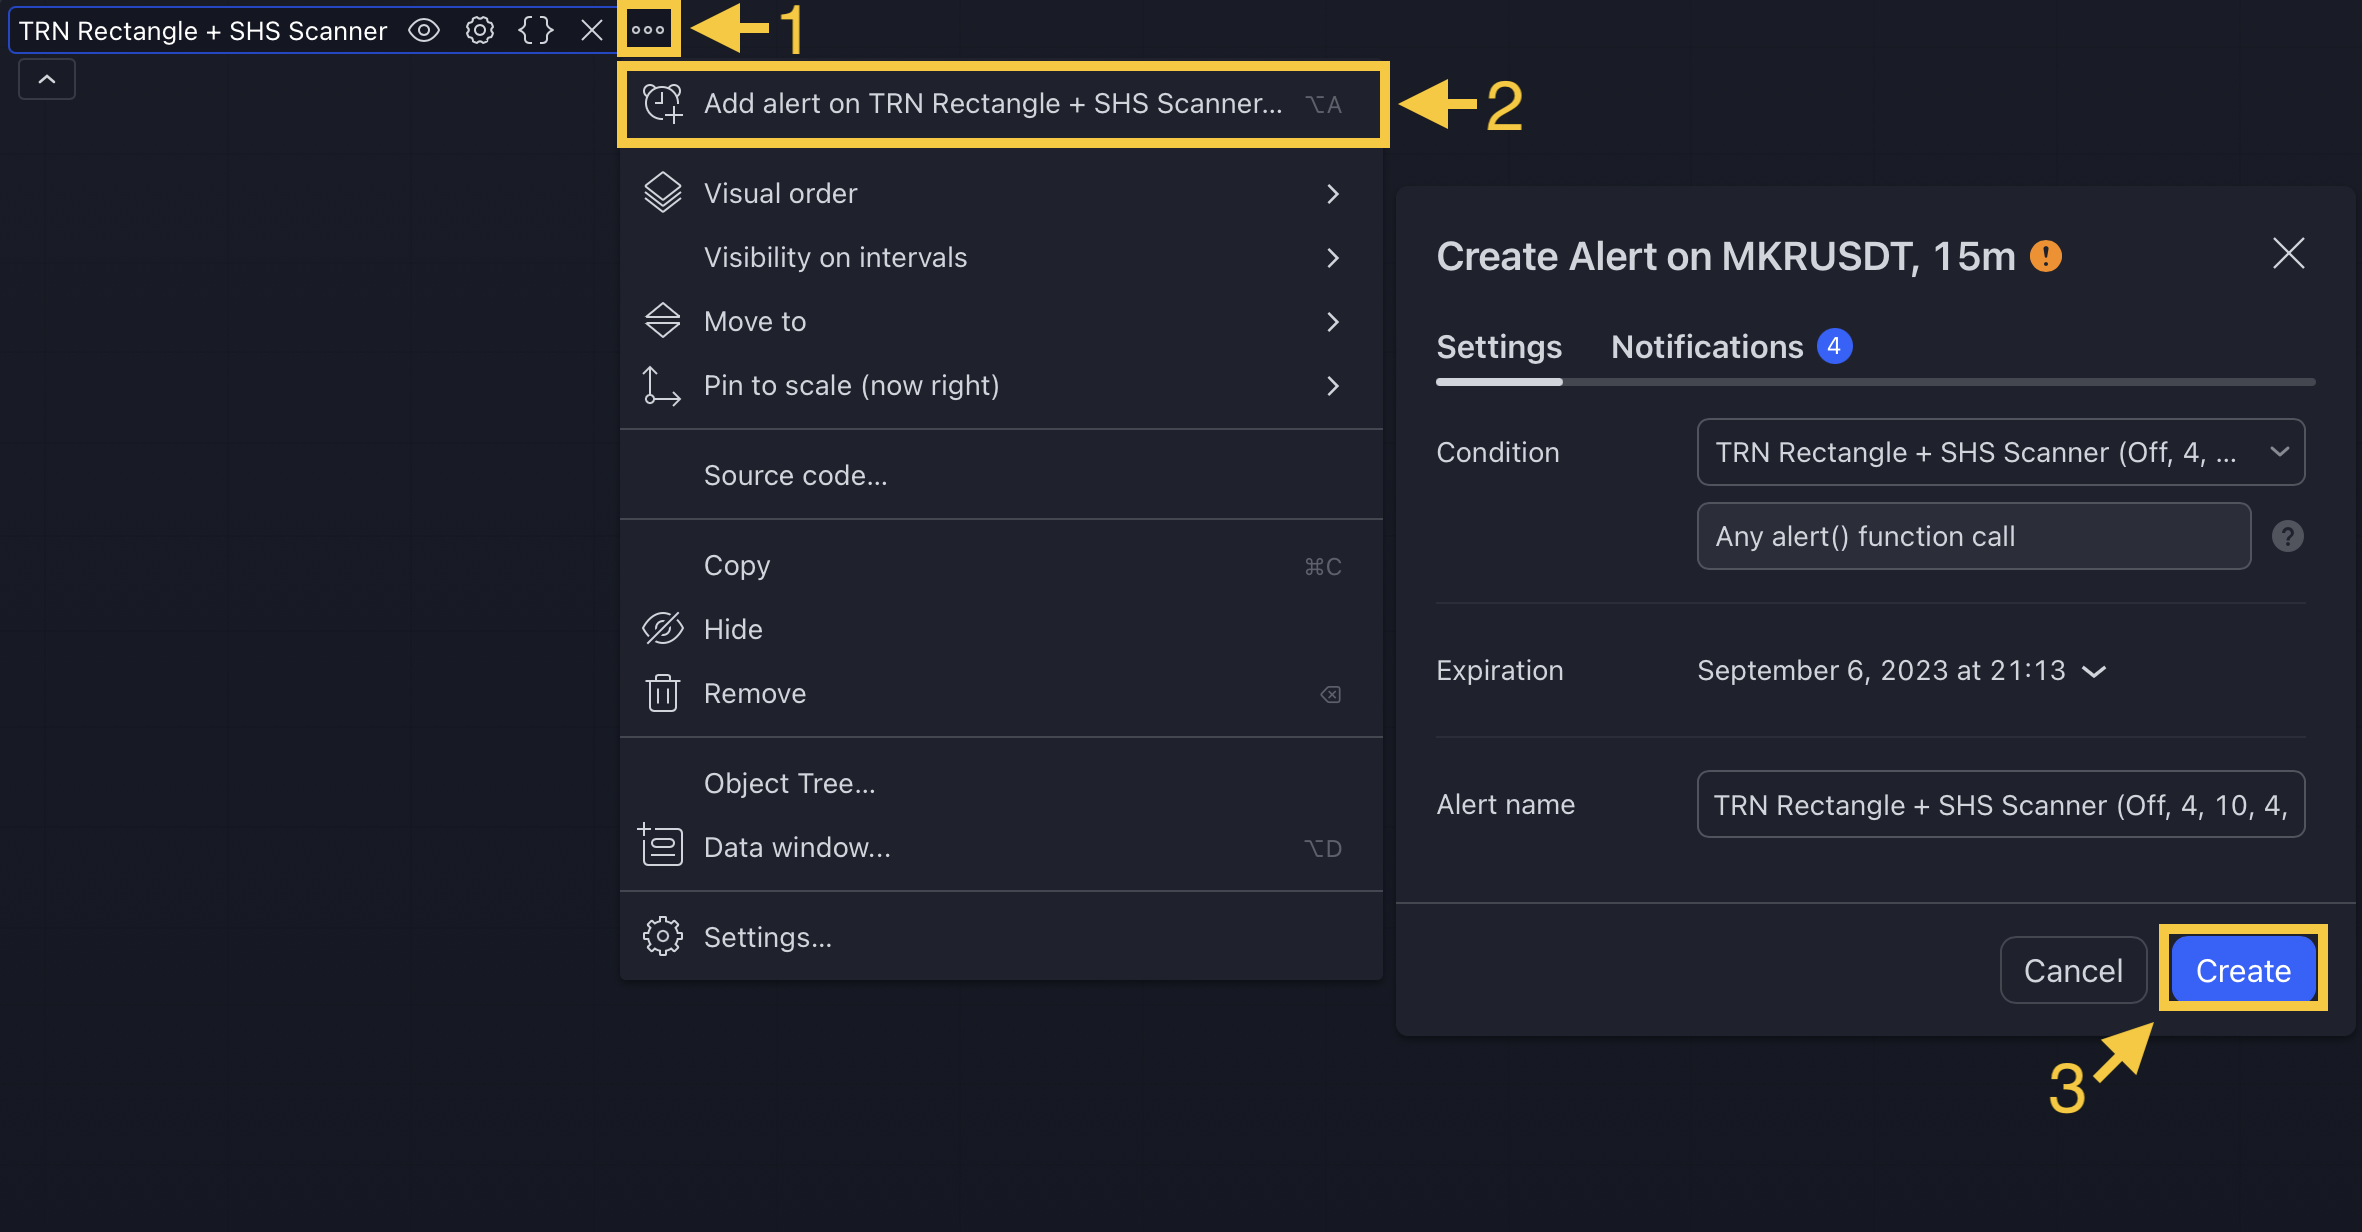
To proceed further, locate the "More" button (1) and click on it. This action will trigger a dropdown menu with additional choices. From the available options, select "Add alert on Scanner..." (2) to configure alerts specifically for the Market Scanner. Once you have customized the desired parameters, click on "Create" (3) to set the alarm. The alert will be set for the current timeframe and asset you are viewing on TradingView.This feature ensures that you receive timely notifications regarding emerging patterns and breakouts identified by the scanner, empowering you to take prompt and informed trading actions.
The alarm function is activated for all symbols listed in the scanner and corresponds to the timeframe of the chart you are currently viewing. This ensures that you receive alerts specifically tailored to the symbols and timeframe you are interested in.
TRN Trend And Reversal Scanner
Our TRN Trend And Reversal Scanner diligently hunts for signals from TRN Bars, Swing Suite, and SMT/Divergence Suite, all in an automated fashion and on the assets and timeframes of your choice. Furthermore, you can conveniently stay updated with real-time alerts, notifying you whenever our scanner achieves successful results.
By following these instructions, you will unlock the power to effectively utilize the scanner, enabling a smooth and uncomplicated quest for top-notch signals derived from the TRN Basics:
1. Activate Scanner
Just add the Trend and Reversal Scanner to your chart. Visit our section "Setup Our Tools On TradingView" if you want to know how to get access to our tools in general.
2. Add Symbols
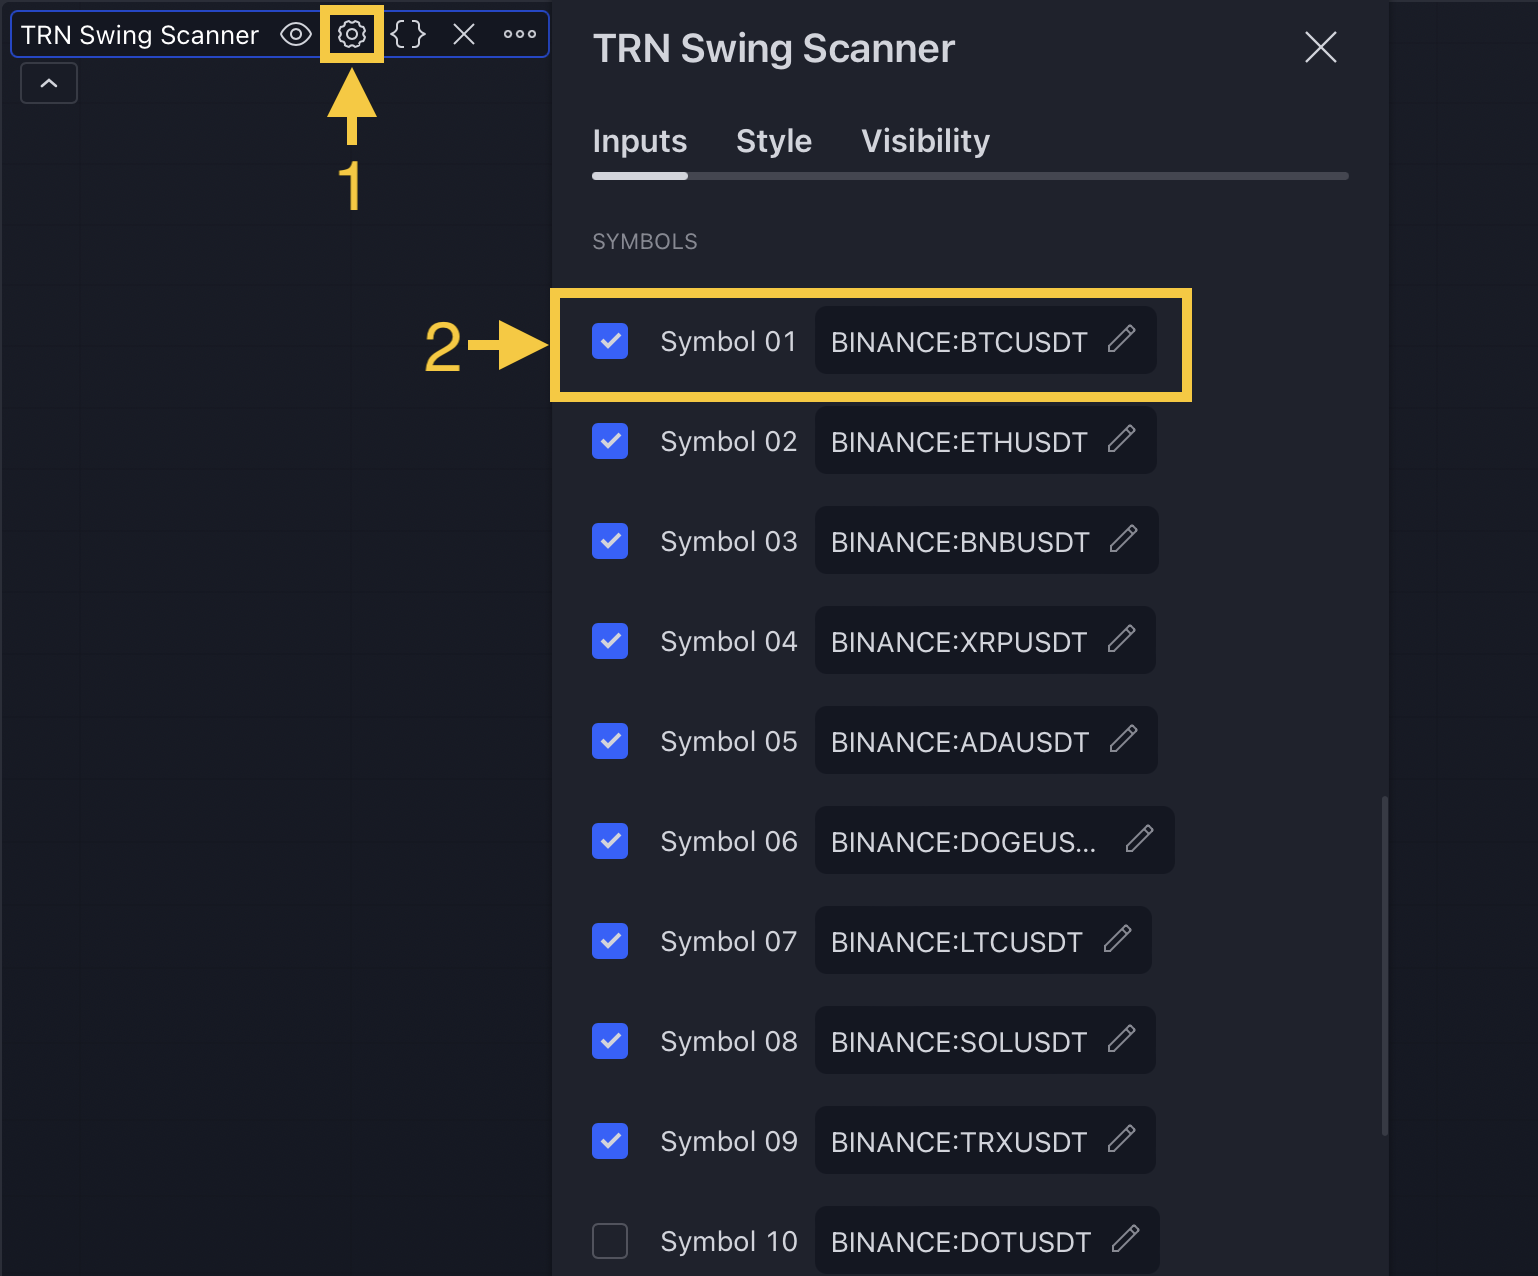
Go to Indicator Settings (1) and scroll down to the "Symbols" section. The enabled symbols can be recognized by the check marks. Click on one of them (2) and use the search function to add the symbol of your choice to the scanner. You can search on up to 20 different Symbols at the same time.
3. Setup Divergence Scanner
Go to indicator settings (1) and choose one of our build in divergence indicators under the section "Divergence Detection" of the menu item "Inputs" (2), like for example the Awesome Oscillator (AO) (3). You have access to a diverse range of 11 indicators that can be used in conjunction with the price to identify both bullish and bearish divergences displayed by our tools Swing Suite or SMT/Divergence Suite.
Visit our 11 Oscillators And Just One Tool section to learn more about the 11 oscillators build in our Swing suite and the SMT/Divergence Suite.
4. Find Signals
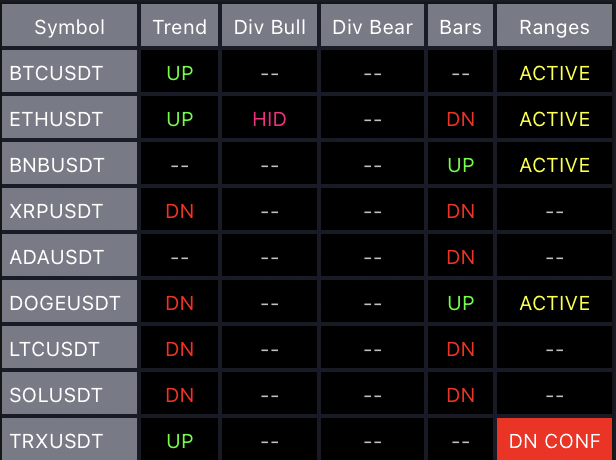
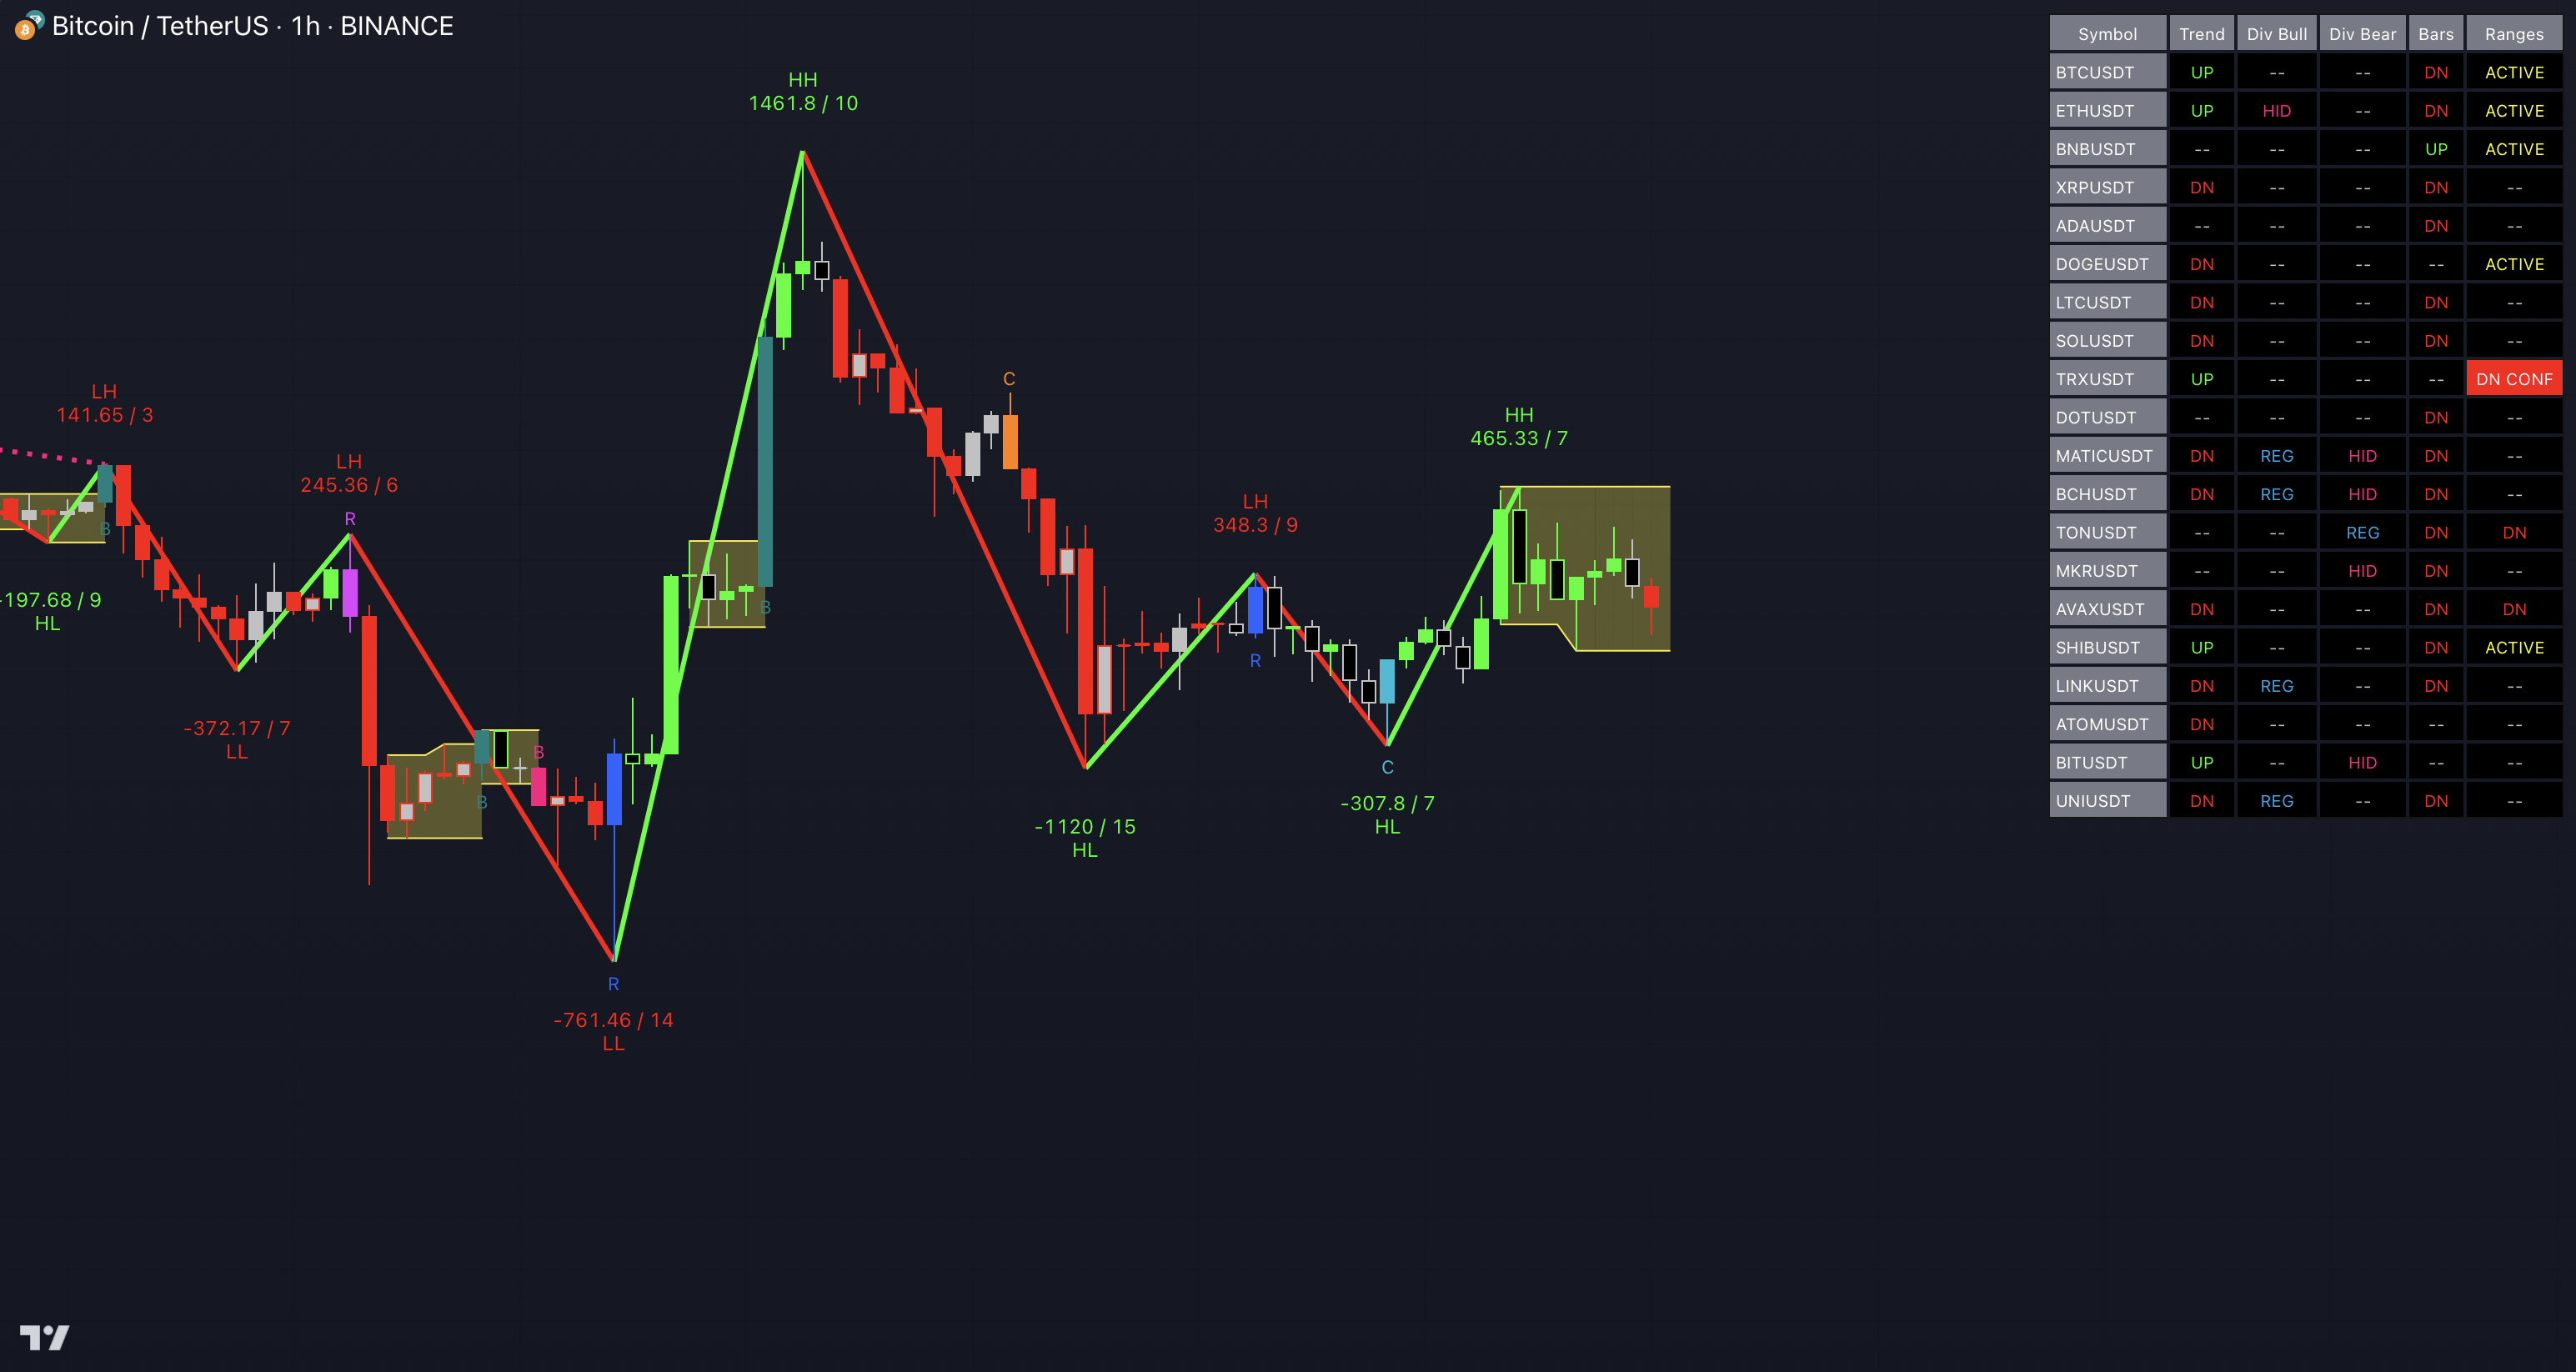
On the right side of the chart, you can find a table displaying the symbols monitored by our scanner for signal detection (first column). The table provides information on the status of each symbol. This visual representation allows you to quickly identify evolving signals from the TRN Basics across different symbols, helping you stay informed and make timely trading decisions.
The scanner operates specifically on the timeframe you have selected in TradingView. It focuses its search on the exact timeframe you are currently viewing, ensuring that the detected signals align precisely with your trading perspective.
Swing Suite
The second column (Trend) indicates whether the price of the asset moves within an upswing (UP) or a downswing (DN), as detected by Swing Suite, on the selected timeframe.
Be sure to check out our Swing Suite section to fully understand how to spot and use these signals properly.
SMT/Divergence Suite
In the third column (Div Bull), you can see the outcomes identified by our SMT/Divergence Suite tool. It indicates whether a regular bullish divergence (REG) or a hidden bullish divergence (HID) has been detected within the current swing. Similarly, the fourth column (Div Bear) reveals the presence of either a regular bearish divergence (REG) or a hidden bearish divergence (HID).
Have a look into our SMT/Divergence Suite section. This resource will provide you with valuable insights and knowledge on mastering the art of spotting and capitalizing on divergence signals.
TRN Bars
In the fifth column, you can observe the status of our TRN bars, whether they are in an uptrend (UP) or downtrend (DN). Moreover, any discovered bullish reversal bars (REV) are displayed in green, while bearish reversal bars are depicted in red. Similarly, identified bullish continuation bars (CON) are represented in green, and bearish continuation bars are highlighted in red. Likewise, any detected bullish breakout bars (B/O) are showcased in green, while bearish breakout bars are showcased in red.
Ensure you take a moment to explore our TRN Bars section. This resource will equip you with the necessary insights and knowledge to effectively capitalize on the potential offered by TRN Bars.
TRN Bar Range
The sixth and last column provides insights into the price behavior of a symbol within the selected timeframe, as analyzed by our TRN Bar Range tool. It indicates whether the price resides within a detected range (ACTIVE). Additionally, it highlights if the price surpasses the upper limit or falls below the lower limit of the range. Upward breakouts are denoted in green (UP), while downward breakouts are indicated in red (DN). A confirmed upward breakout is also displayed in green (UP CONF), whereas a confirmed downward breakout is shown in red (DN CONF).
Make sure to delve into our TRN Bar Range section. By exploring this dedicated resource, you will gain the essential knowledge and valuable insights needed to proficiently identify and seize the opportunities offered by TRN Bar Range.
5. Use Alerts (Optional But Recommended)
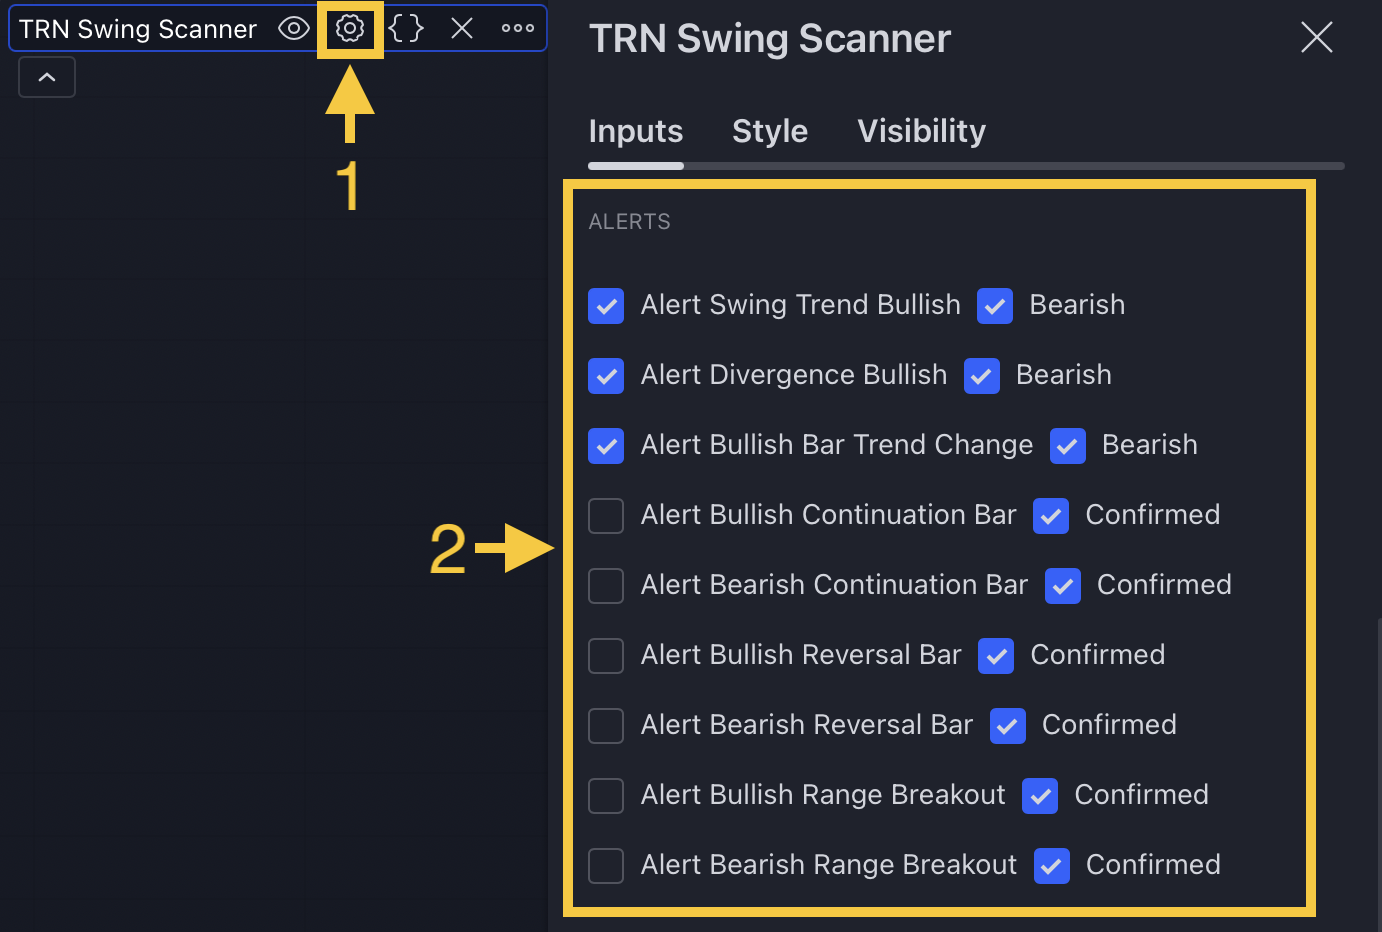
To access the desired options, navigate back to the indicator settings (1) menu and continue scrolling until you reach the "Alerts" (2) section. Within this section, you have the flexibility to personalize your notification preferences based on the various signals provided by the TRN Basics.
You can opt to receive alerts for the following scenarios: when a new bullish or bearish swing trend is detected (1), when a bullish or bearish divergence is identified (2), when there is a change in trend for our TRN Bars (3), or when a Signal Bar is being formed or confirmed (4).
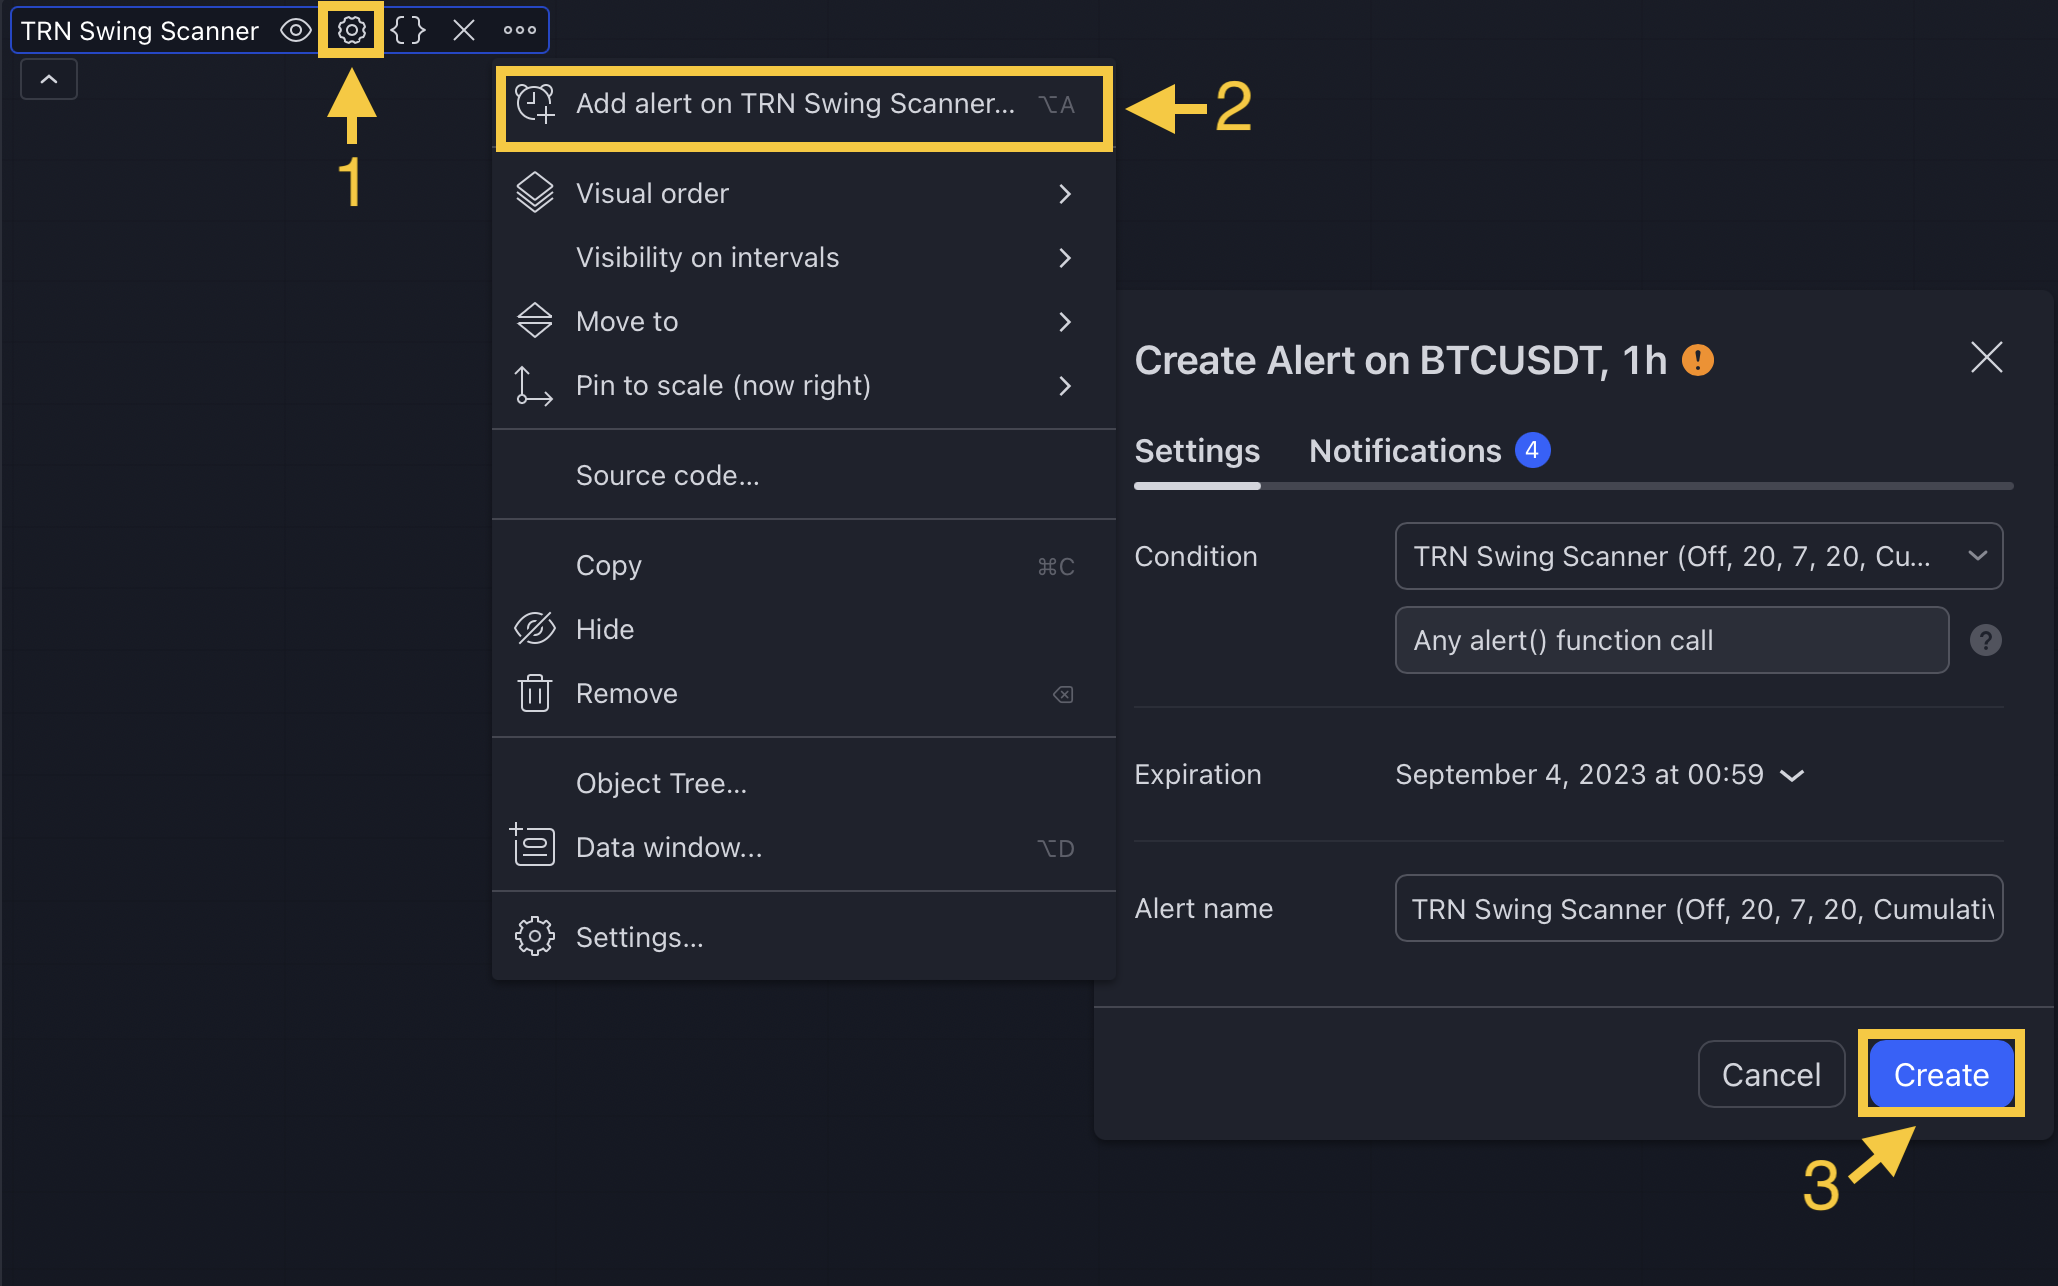
To proceed further, locate the "More" button (1) and click on it. This action will trigger a dropdown menu with additional choices. From the available options, select "Add alert on Swing Suite Scanner..." (2) to configure alerts specifically for the Market Scanner.
Once you have customized the desired parameters, click on "Create" (3) to set the alarm. The alert will be set for the current timeframe and asset you are viewing on TradingView. This feature ensures that you receive timely notifications about emerging signals and breakouts identified by the scanner, enabling you to make swift and well-informed trading decisions.
The alarm function is activated for all symbols listed in the scanner and corresponds to the timeframe of the chart you are currently viewing. This ensures that you receive alerts specifically tailored to the symbols and timeframe you are interested in.