SMT/Divergence Suite
In the world of trading, there are countless indicators that traders use to try and gain an edge in the market. One of the most powerful and effective indicators is a divergence detector like the SMT/Divergence Suite, which can help traders identify potential changes in trend before they occur. In this article, we'll take a closer look at how the SMT/Divergence Suite works and how it can be used to improve trading results.
What Are Divergences?
When the price of an asset moves in one direction, but its indicators move in the opposite direction, this is called a divergence. Divergences can be a powerful signal that a trend reversal is about to occur.
Regular Divergences
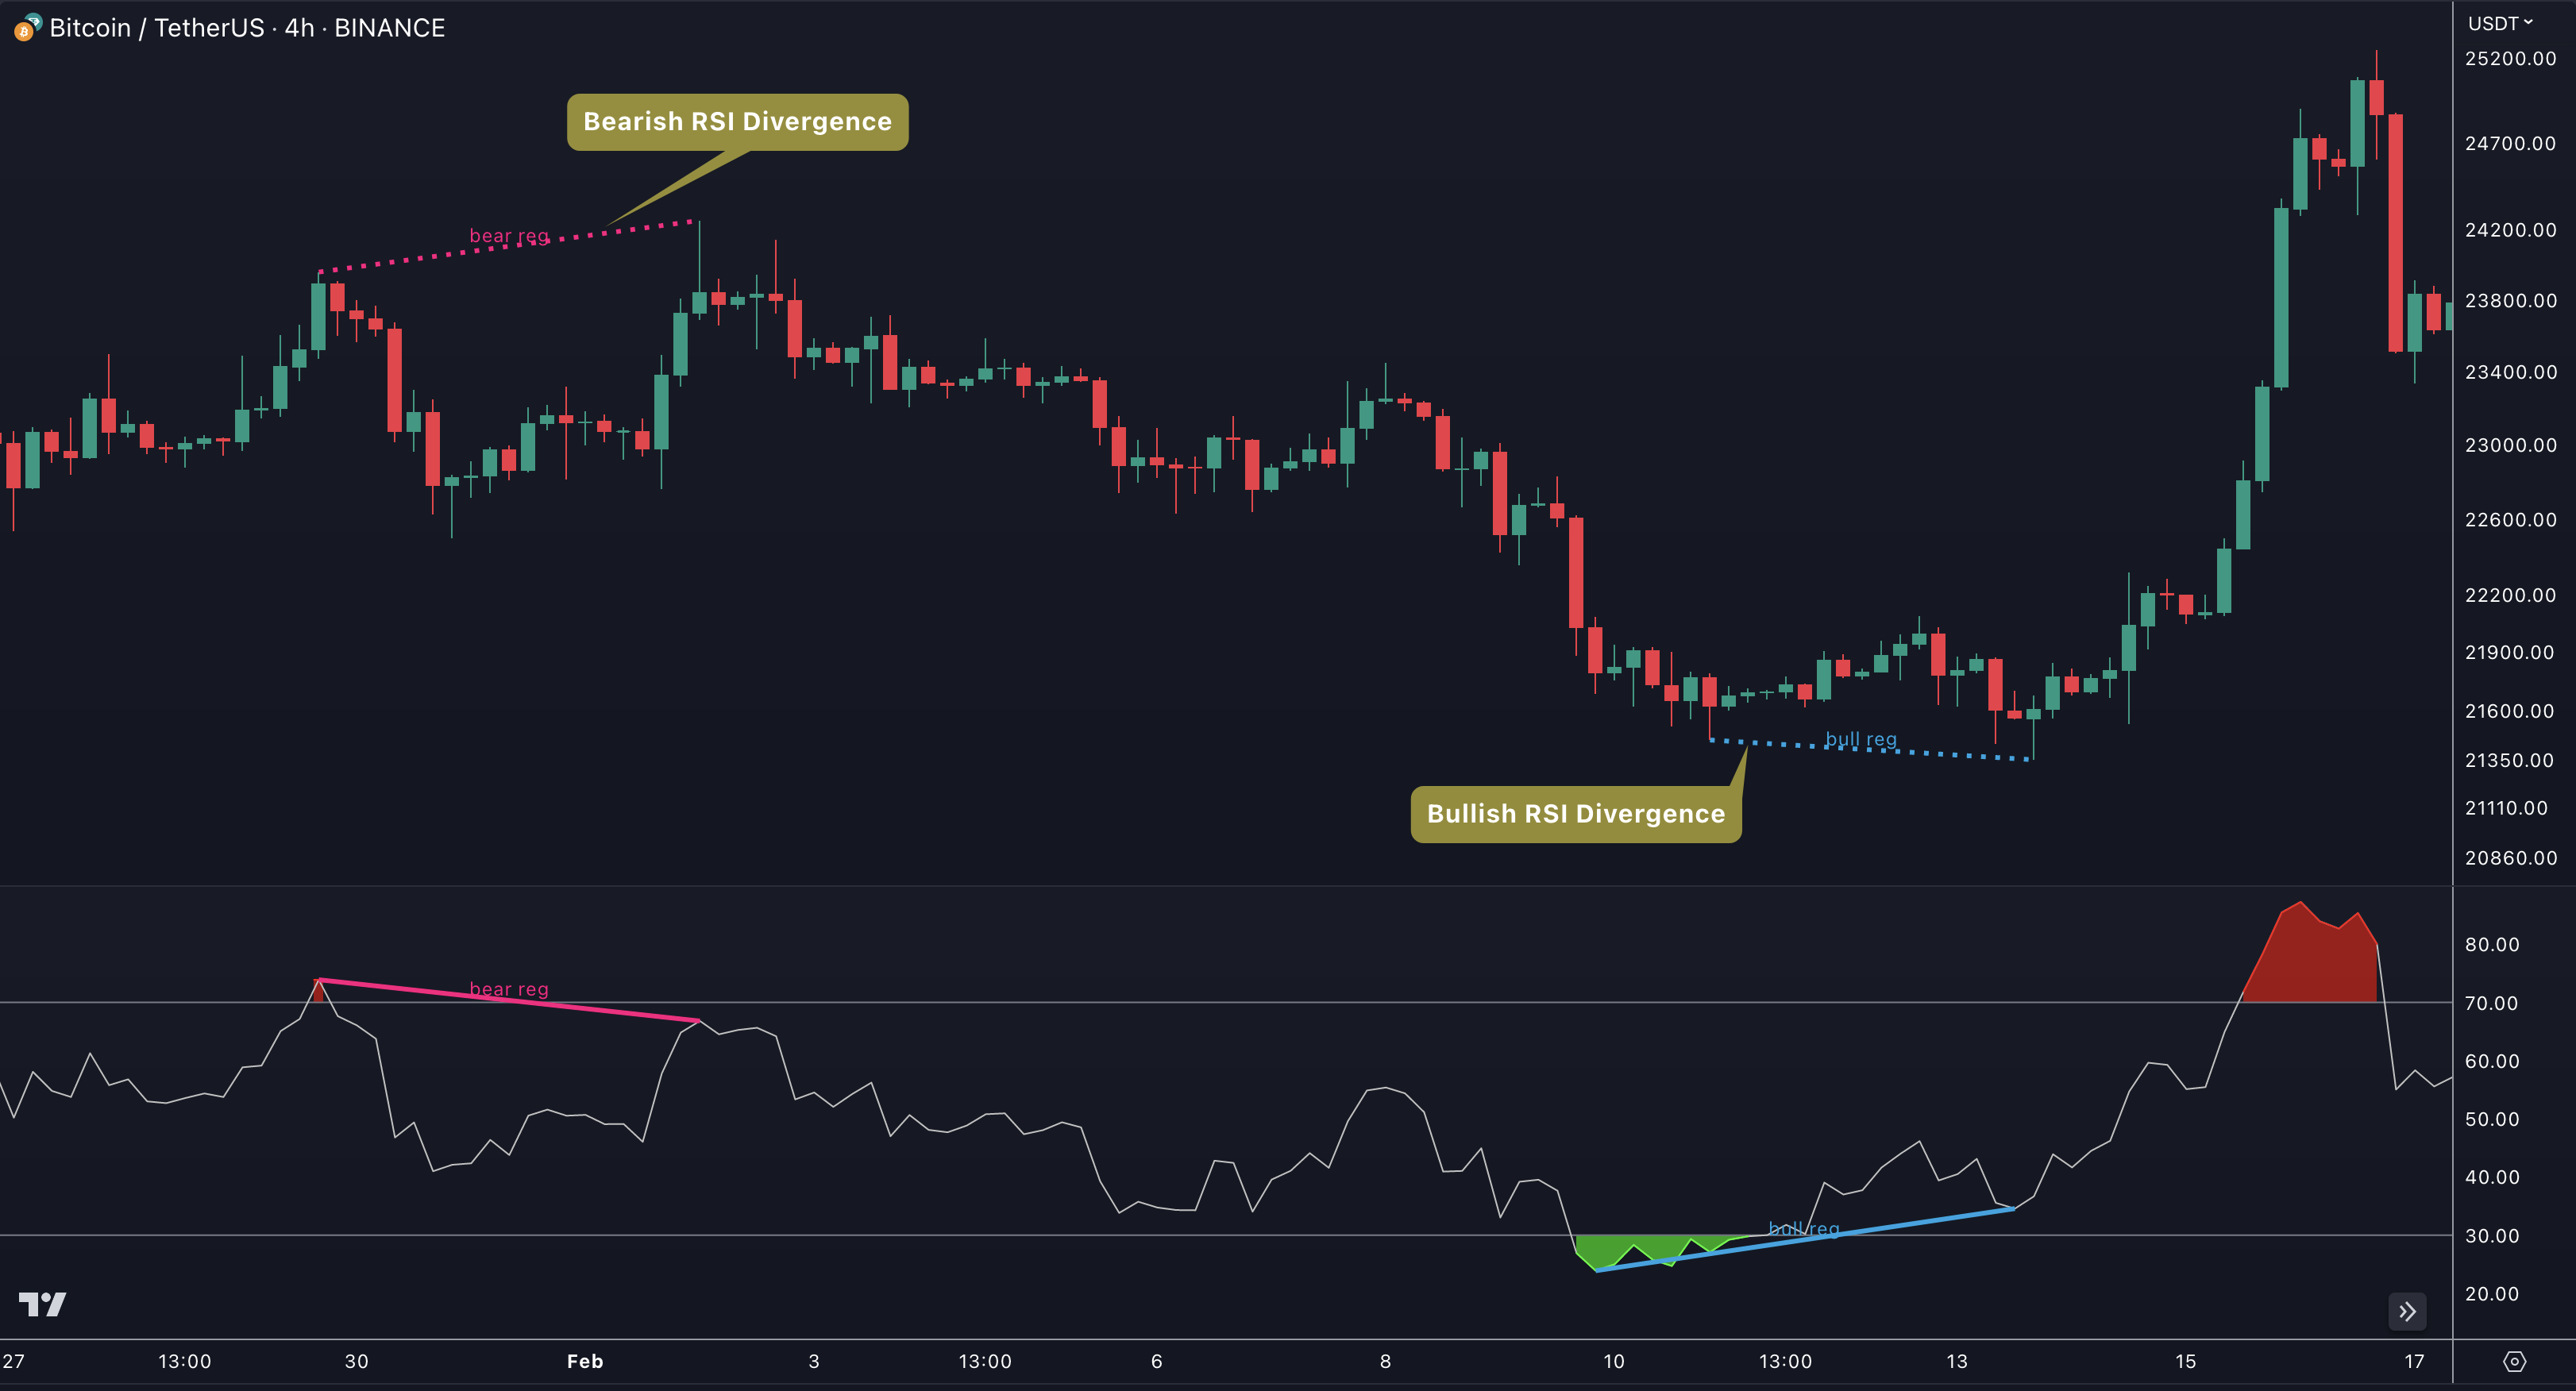
There are two types of regular divergences: bullish and bearish. A bullish divergence occurs when the price of an asset makes a lower low, but its indicators make a higher low. This can be a sign that the asset is oversold and that a reversal is imminent. A bearish divergence, on the other hand, occurs when the price of an asset makes a higher high, but its indicators (such as Relative Strength Index - RSI) make a lower high. This can be a sign that the asset is overbought and that a reversal is imminent.
Hidden Divergences
Beside regular divergences there are other types of divergences like hidden divergences.
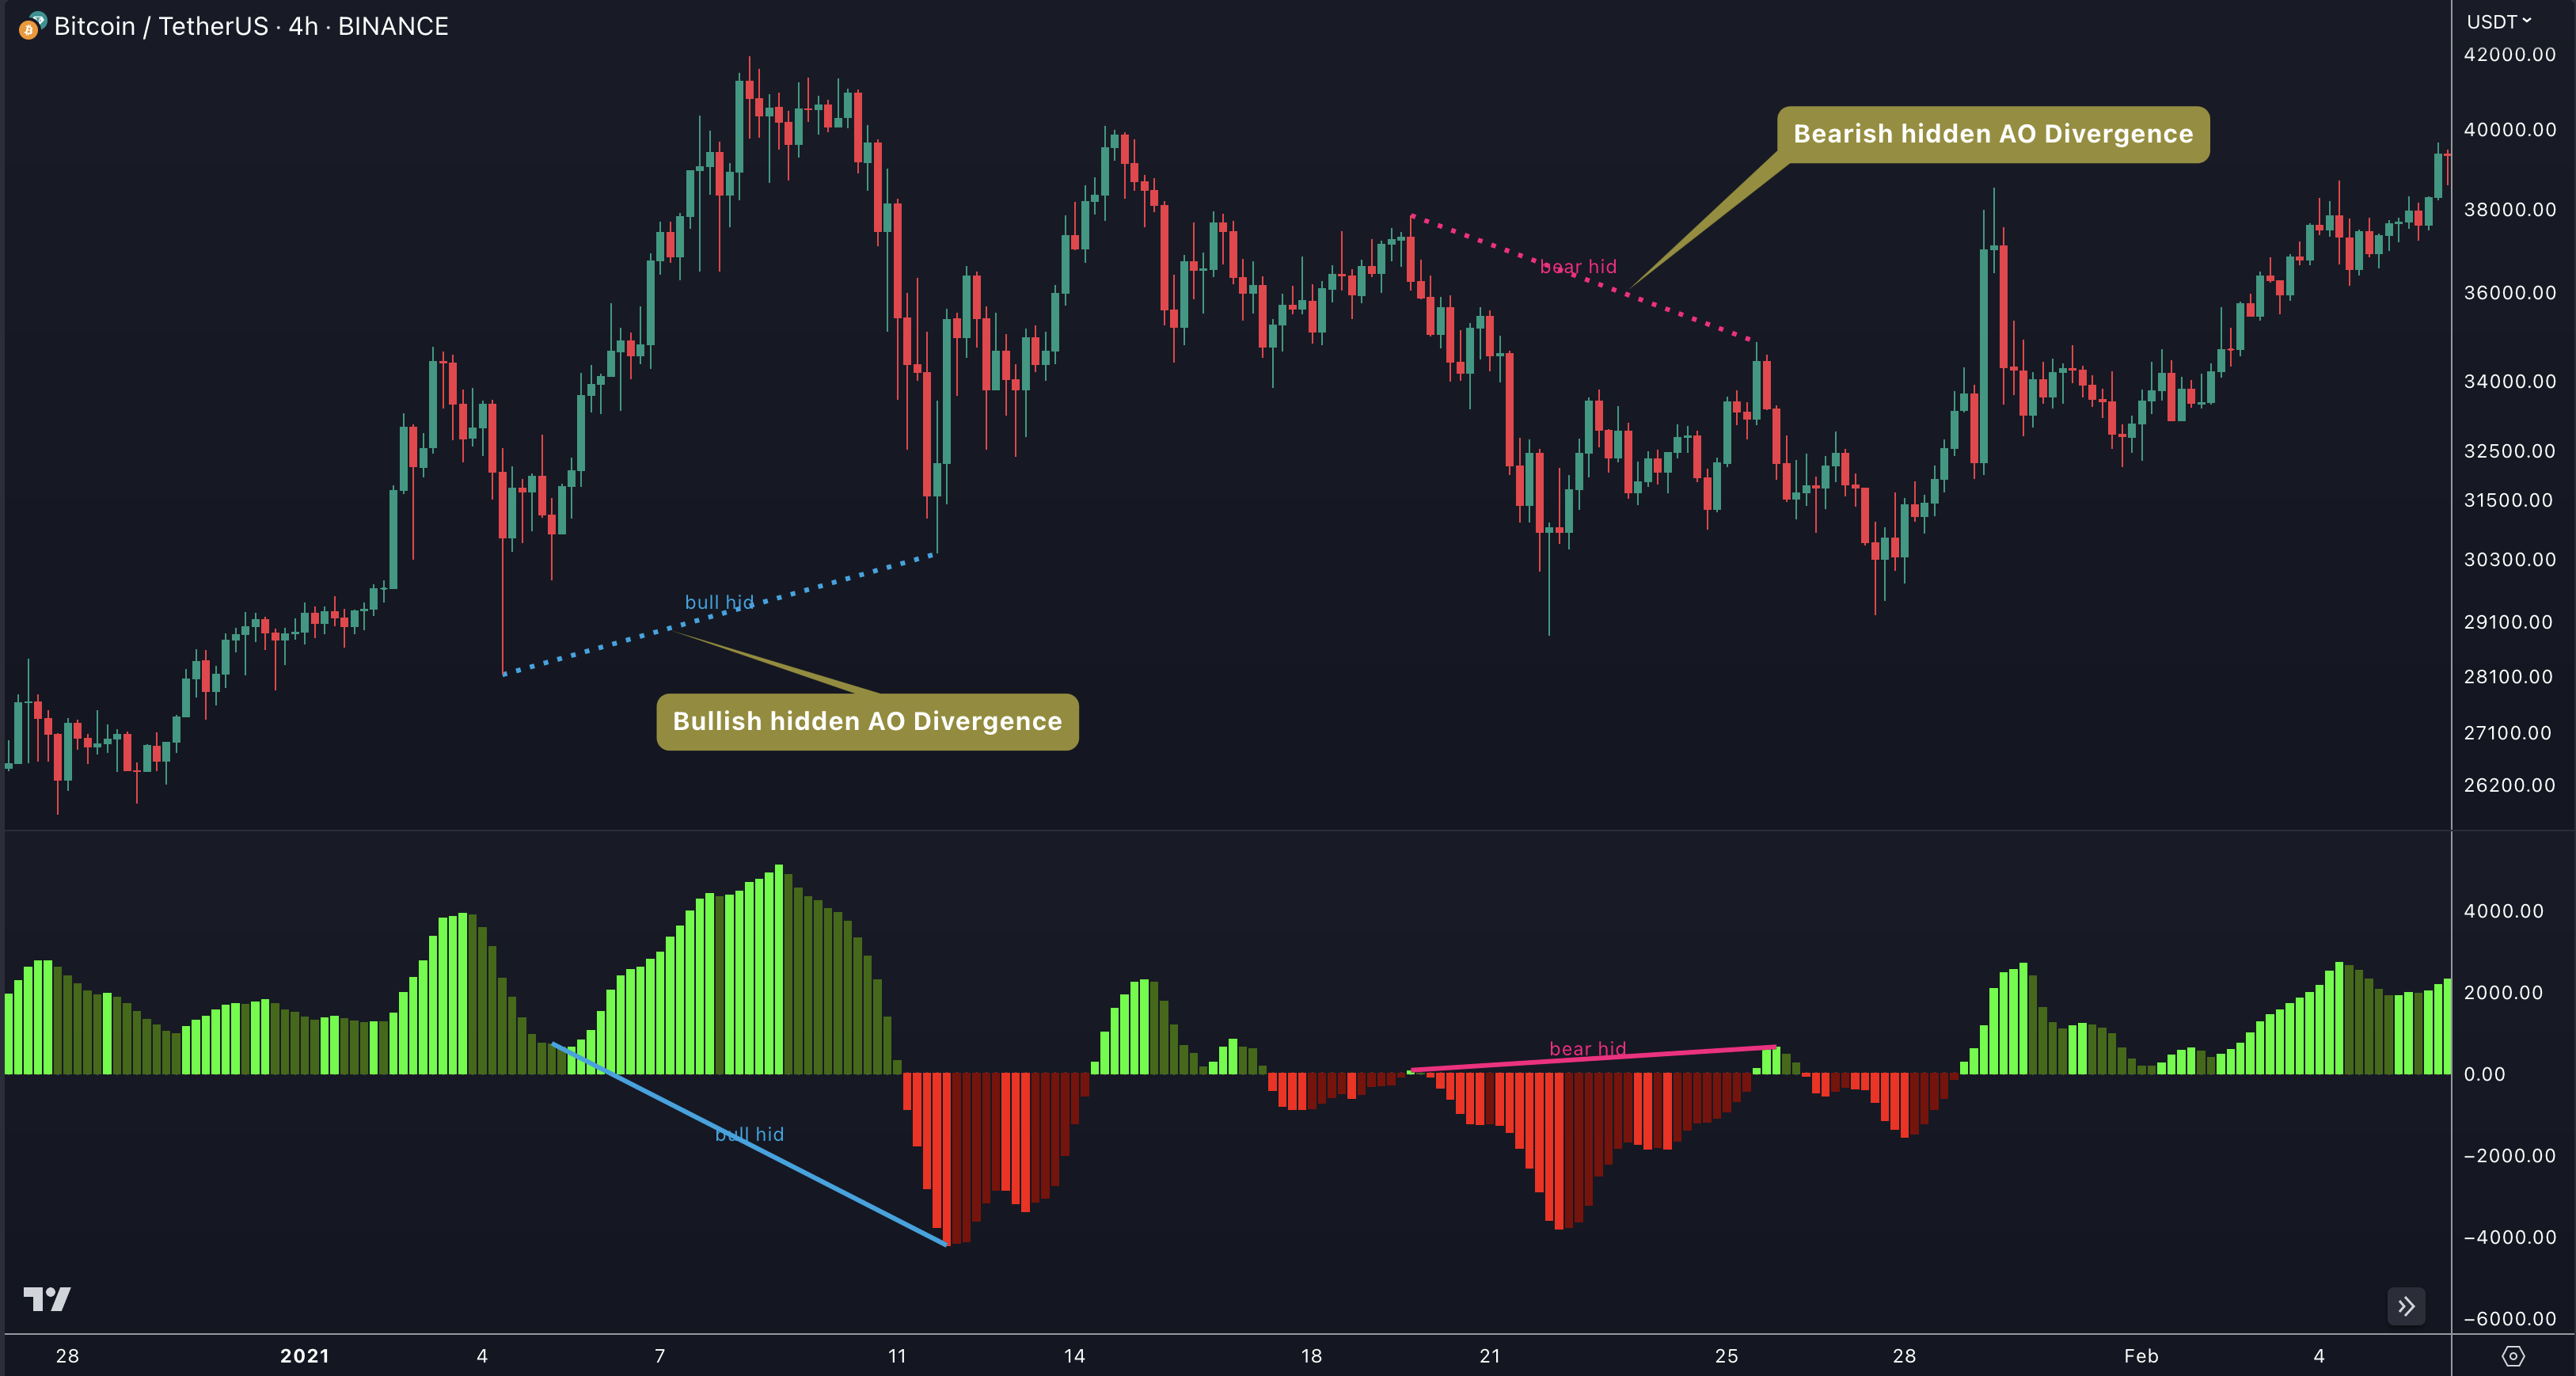
In trading, hidden bearish and hidden bullish divergences are patterns that traders often look for on price charts to identify potential trend reversals or continuation patterns. These divergences occur when the price of an asset moves in the opposite direction of an indicator, suggesting a possible shift in the underlying trend.
Hidden Bearish Divergence
A hidden bearish divergence occurs when the price of an asset forms a higher high, but the corresponding indicator (such as the Awesome Oscillator - AO) forms a lower high. This indicates that the upward momentum is weakening, and a potential trend reversal or continuation of a downtrend is likely.
Hidden Bullish Divergence
On the other hand, a hidden bullish divergence takes place when the price forms a lower low, but the indicator forms a higher low. This suggests that the downward momentum is weakening, and a potential trend reversal or continuation of an uptrend is possible.
11 Oscillators And Just One Tool
SMT/Divergence Suite Contains 11 different oscillators and a divergence detector that searches for divergences between an asset's price and the different oscillators. We have chosen a selection of different momentum, trend following and volume oscillators that gives you maximum flexibility.
Momentum Oscillators
- Relative Strength Index (RSI)
- Money Flow Index (MFI)
- Momentum (MOM)
- Stochastic %K and Stochastic %D
- Williams Percentage Range (W%R)
- Commodity Channel Index (CCI)

The Relative Strength Index (RSI) is a popular technical indicator used in trading to measure the magnitude and velocity of price movements. It is primarily used to identify overbought and oversold conditions of a security or market.
The RSI is typically displayed as a line graph that oscillates between 0 and 100. The indicator provides insights into the strength and potential reversal points of a trend.
The interpretation of the RSI is as follows:
Overbought And Oversold Conditions: The RSI is commonly used to identify overbought and oversold conditions in a security or market. If the RSI rises above 70, it suggests an overbought condition, indicating that the price may be due for a downward correction. Conversely, if the RSI drops below 30, it suggests an oversold condition, indicating that the price may be due for an upward correction.
Confirmation Of Price Trends: The RSI can be used to confirm the strength of a price trend. If the RSI is rising along with an uptrend, it suggests that buying pressure is increasing and supports the continuation of the upward movement. Conversely, if the RSI is falling along with a downtrend, it suggests that selling pressure is increasing and supports the continuation of the downward movement.
Default Parameters
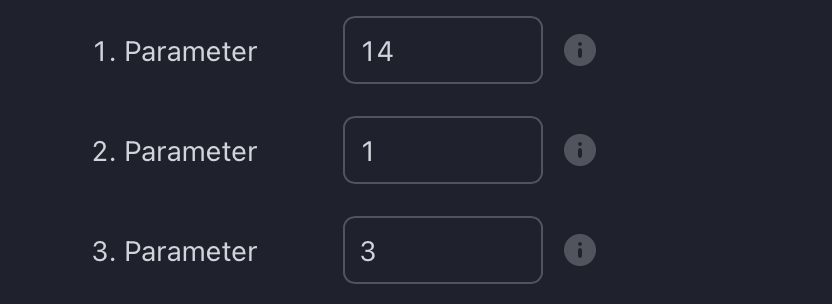

The Money Flow Index (MFI) is a technical indicator used in trading to measure the strength and intensity of money flow into and out of a security or market. It combines price and volume data to provide insights into buying and selling pressure. The MFI is displayed as a line graph that oscillates between 0 and 100.
It is interpreted in the following ways:
Overbought And Oversold Conditions: The MFI is often used to identify overbought and oversold conditions in a security or market. If the MFI rises above 80, it suggests an overbought condition, indicating that the price may be due for a downward correction. Conversely, if the MFI drops below 20, it suggests an oversold condition, indicating that the price may be due for an upward correction.
Confirmation Of Price Trends: The MFI can be used to confirm the strength of a price trend. If the MFI is rising along with an uptrend, it suggests that buying pressure is increasing and supports the continuation of the upward movement. Conversely, if the MFI is falling along with a downtrend, it suggests that selling pressure is increasing and supports the continuation of the downward movement.
Default Parameters


The Momentum oscillator (MOM) is a technical indicator used in trading to measure the speed or velocity of price changes. It compares the current price of a security or market to the price of the same security at a previous period, typically the closing price.
MOM calculates the difference between the current price and the price at a specific time in the past and presents it as a line graph that oscillates around a zero line. The indicator can be positive or negative, depending on whether the current price is higher or lower than the price at the selected time period.
The interpretation of MOM is as follows:
Positive Momentum: When the current price is higher than the price at the selected time period, the Momentum oscillator will be positive. A higher positive value indicates a stronger upward momentum, suggesting that the price is rising at a faster pace.
Negative Momentum: When the current price is lower than the price at the selected time period, the Momentum oscillator will be negative. A lower negative value indicates a stronger downward momentum, suggesting that the price is falling at a faster pace.
Zero Line Crossings: The zero line is often used as a reference point for trend reversals. When the Momentum oscillator crosses above the zero line from negative territory, it indicates a potential shift from bearish to bullish momentum, suggesting a possible buying opportunity. Conversely, when the oscillator crosses below the zero line from positive territory, it indicates a potential shift from bullish to bearish momentum, suggesting a possible selling opportunity.
Default Parameters
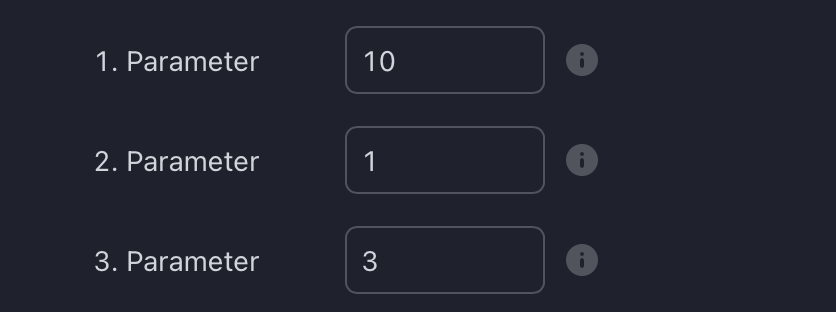

The Stochastic Oscillator is another oscillator that falls into the category of momentum oscillators. It compares the current price with the price range over a specific period.
The Stochastic Oscillator consists of two lines: %K and %D. The %D line in the Stochastic Oscillator is a smoothed version of the %K line. It is calculated by applying a moving average (usually a simple moving average) to the %K line. The most common period used for %D is 3.
Interpretation:
The white %K line represents the current closing price relative to the highest and lowest prices over a specific period, typically 14. It indicates the momentum of the price and identifies overbought and oversold conditions.
The multicolored %D line, on the other hand, helps to smooth out the fluctuations of the %K line and provides a more accurate representation of the underlying trend.
A green colored %D line represents an upward trend. A red colored %D line, on the other hand, represents a downward trend. If there is no clear trend, the %D line turns yellow. It is often used as a signal line or a trigger line for generating trading signals.
The interpretation of Stochastic %D is similar to that of the %K line. When the %D line crosses above the %K line, it suggests a bullish signal, indicating a potential buying opportunity. Conversely, when the %D line crosses below the %K line, it indicates a bearish signal, suggesting a potential selling opportunity.
Additionally, traders pay attention to the levels of the %D line. If the %D line is above 80, it suggests an overbought condition, indicating that the price may be due for a downward correction. Conversely, if the %D line is below 20, it suggests an oversold condition, indicating that the price may be due for an upward correction.
Default Parameters


The Williams Percentage Range (W%R) is a technical indicator used in trading to measure overbought and oversold conditions of a security or market. It was developed by Larry Williams and is also referred to as Williams %R.
The indicator is represented as a line graph that oscillates between -100 and 0. It measures the relationship between the current closing price and the highest high and lowest low over a specified period, typically 14 periods.
The interpretation of the Williams Percentage Range is as follows:
Overbought And Oversold Conditions: The W%R oscillates within a range of 0 to -100. Readings above -20 are considered overbought, indicating that the price has risen too far, too fast, and may be due for a downward correction. Conversely, readings below -80 are considered oversold, indicating that the price has fallen too far, too fast, and may be due for an upward correction.
Reversal Signals: The W%R can generate potential reversal signals. When the indicator reaches overbought or oversold levels and then starts to move back within the range, it may suggest a possible trend reversal. Traders often look for bullish or bearish divergences in conjunction with these reversals for confirmation.
Default Parameters


The Commodity Channel Index (CCI) is a technical indicator used in trading to identify potential overbought and oversold conditions in a security or market. It was developed by Donald Lambert and is used to measure the variation of a security's price from its statistical mean.
The CCI indicator fluctuates around a zero line, and its values are typically plotted as a line graph. The interpretation of the Commodity Channel Index is as follows:
Overbought And Oversold Conditions: The CCI oscillates above and below a zero line. Readings above +100 are considered overbought, suggesting that the price has risen too far, too fast, and may be due for a downward correction. Conversely, readings below -100 are considered oversold, suggesting that the price has fallen too far, too fast, and may be due for an upward correction.
Zero Line Crossovers: Crossovers of the CCI with the zero line can also be used as signals. A CCI crossing from below the zero line to above it suggests a potential bullish signal, while a CCI crossing from above the zero line to below it suggests a potential bearish signal.
Default Parameters
Trend-Following Oscillators
- Moving Average Convergence Divergence (MACD)
- Awesome Oscillator (AO)

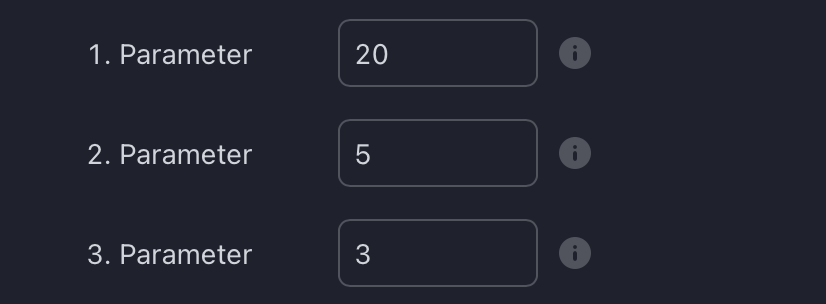
The Moving Average Convergence Divergence (MACD) is a popular technical indicator used in trading to identify potential trend reversals, generate buy and sell signals, and measure the strength of a trend. It consists of two lines: the MACD line and the signal line, along with a histogram that represents the difference between the two lines.
The MACD line oscillates above and below the zero line, while the signal line is a smoothed version of the MACD line. The histogram represents the difference between the MACD line and the signal line and provides visual cues about the strength of the trend.
The interpretation of the MACD includes the following aspects:
Signal Line Crossovers: When the MACD line crosses above the signal line, it generates a bullish signal, indicating a potential buying opportunity. Conversely, when the MACD line crosses below the signal line, it generates a bearish signal, indicating a potential selling opportunity.
Zero Line Crossovers: When the MACD line crosses above the zero line, it suggests a shift from bearish to bullish momentum, indicating a potential trend reversal or the start of an uptrend. When the MACD line crosses below the zero line, it suggests a shift from bullish to bearish momentum, indicating a potential trend reversal or the start of a downtrend.
Histogram Strength: The height of the histogram bars represents the strength of the trend. Taller bars indicate stronger buying or selling pressure, while shorter bars indicate weaker momentum.
Default Parameters
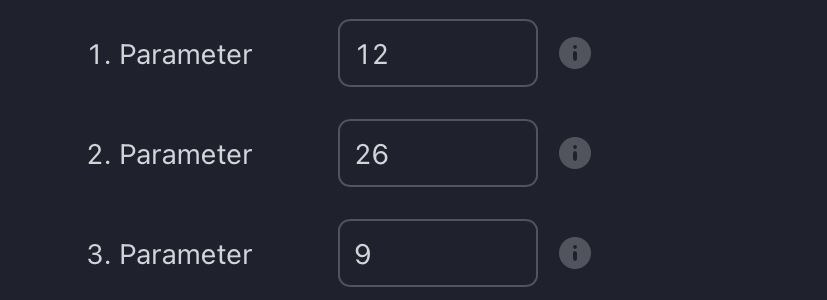

The Awesome Oscillator (AO) is a technical indicator used in trading to measure the market's momentum and the potential trend reversals. It was developed by Bill Williams to complement his trading system described in his book "New Trading Dimensions."
The AO is typically displayed as a histogram, with bars above and below a zero line. The interpretation of the Awesome Oscillator is as follows:
Bullish Signal: When the Awesome Oscillator bars change from negative (below zero) to positive (above zero), it indicates increasing bullish momentum in the market. This suggests that buying pressure is gaining strength, and it may be a potential signal to enter or hold long positions.
Bearish Signal: When the Awesome Oscillator bars change from positive (above zero) to negative (below zero), it indicates increasing bearish momentum in the market. This suggests that selling pressure is gaining strength, and it may be a potential signal to enter or hold short positions.
Zero Line Crossovers: Crossovers of the Awesome Oscillator bars with the zero line can also be used as signals. A bar crossing from below the zero line to above it suggests a bullish signal, while a bar crossing from above the zero line to below it suggests a bearish signal
Twin Peaks: Another concept associated with the Awesome Oscillator is the "twin peaks." It occurs when the oscillator forms two peaks of similar height, with the second peak being lower than the first. This pattern may indicate a potential trend reversal and is often used as a confirmation signal in conjunction with other technical indicators.
Default Parameters

Volume Oscillators
- Cumulative Delta Volume (CDV)
- On Balance Volume (OBV)
- Chaikin Money Flow (CMF)

Cumulative Delta is a trading indicator that measures the net buying or selling pressure in the market by analyzing the difference between the volume of buying and selling transactions at each price level. It is used to identify potential reversals and shifts in market sentiment.
The Cumulative Delta indicator calculates the cumulative total of the difference between the buying and selling volume at each price level throughout a given period. It takes into account the direction and intensity of the trading activity, allowing traders to assess the overall market participation and strength.
Positive Cumulative Delta indicates more buying volume than selling volume, suggesting bullish sentiment. Negative Cumulative Delta indicates more selling volume than buying volume, suggesting bearish sentiment. The cumulative values are plotted on a chart, often as a line graph or histogram.
By analyzing the Cumulative Delta, traders can gain insights into the imbalance between buyers and sellers and potential changes in market direction. Some common interpretations and strategies using Cumulative Delta include:
Reversals: Extreme positive or negative values of Cumulative Delta can indicate overbought or oversold conditions, suggesting a potential market reversal. Traders may look for divergences, trend line breaks, or chart patterns in conjunction with Cumulative Delta to confirm potential reversal signals.
Support And Resistance: Cumulative Delta can be used to identify levels of support and resistance based on significant buying or selling pressure. High positive or negative values near certain price levels may indicate the presence of strong buying or selling interest.
Trend Confirmation: Traders may use Cumulative Delta to confirm the strength of a trend. In an uptrend, positive Cumulative Delta values should generally support higher highs and indicate continued buying pressure. In a downtrend, negative Cumulative Delta values should support lower lows and indicate continued selling pressure.
Default Parameters


On-Balance Volume (OBV) is a technical indicator used in trading to measure the cumulative buying and selling pressure behind a financial asset. It provides insights into the relationship between volume and price movements, helping traders identify potential trend reversals and confirm the strength of a trend.
The OBV line is plotted on a chart, and its direction and slope provide insights into the buying and selling pressure. The interpretation of OBV includes the following aspects:
OBV Trend Confirmation: When the OBV line is rising, it indicates that buying volume is dominating and confirms an uptrend. Conversely, when the OBV line is falling, it suggests that selling volume is dominating and confirms a downtrend. Divergence between the OBV line and the price movement can signal potential trend reversals.
Breakouts And Support/Resistance: When the price breaks out of a key resistance level, and the OBV line confirms the breakout by also surpassing its previous high, it suggests strength in the upward move. Similarly, if the price breaks below a key support level, and the OBV line confirms the breakdown by also dropping to a new low, it suggests weakness in the downward move.
Trend Reversal Signals: Divergence between the OBV line and the price can indicate potential trend reversals. Bullish divergence occurs when the price makes lower lows while the OBV line makes higher lows, suggesting a potential bullish reversal. Bearish divergence occurs when the price makes higher highs while the OBV line makes lower highs, indicating a potential bearish reversal.
Volume Confirmation: When the price forms a significant chart pattern or shows a strong move, the OBV line can confirm the validity of the move by exhibiting a corresponding increase in volume. This helps traders assess the strength and reliability of price movements.
Default Parameters
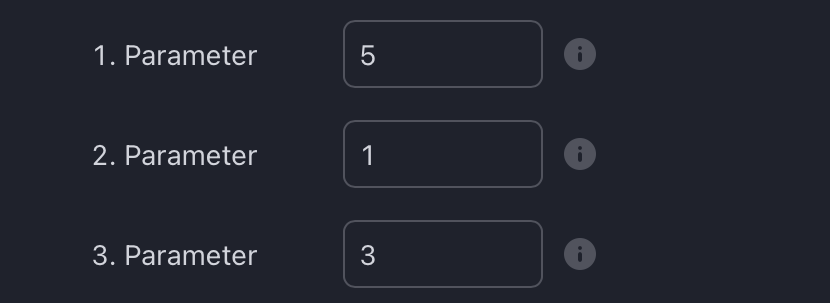

Chaikin Money Flow (CMF) is a technical indicator used in trading to measure the accumulation or distribution of a financial asset based on both price and volume. It combines price and volume data to provide insights into the buying and selling pressure behind an asset, helping traders identify potential trend reversals and confirm the strength of a trend.
The interpretation of CMF includes the following aspects:
CMF Trend Confirmation: When the CMF line is positive, it indicates that buying pressure is dominating, suggesting a potential uptrend or accumulation of the asset. Conversely, when the CMF line is negative, it suggests selling pressure is dominating, indicating a potential downtrend or distribution of the asset.
Breakouts And Reversals: CMF can be used to confirm breakouts or breakdowns from key support or resistance levels. A rising CMF line that accompanies a price breakout suggests a strong buying pressure and supports the validity of the breakout. Conversely, a declining CMF line that accompanies a price breakdown indicates a strong selling pressure and supports the validity of the breakdown.
Volume Confirmation: CMF incorporates volume data, providing insights into the strength of price moves. When the CMF line shows a significant increase or decrease in conjunction with a price move, it confirms the strength and reliability of the trend.
Default Parameters
How To Set Parameters For Divergence Indicators
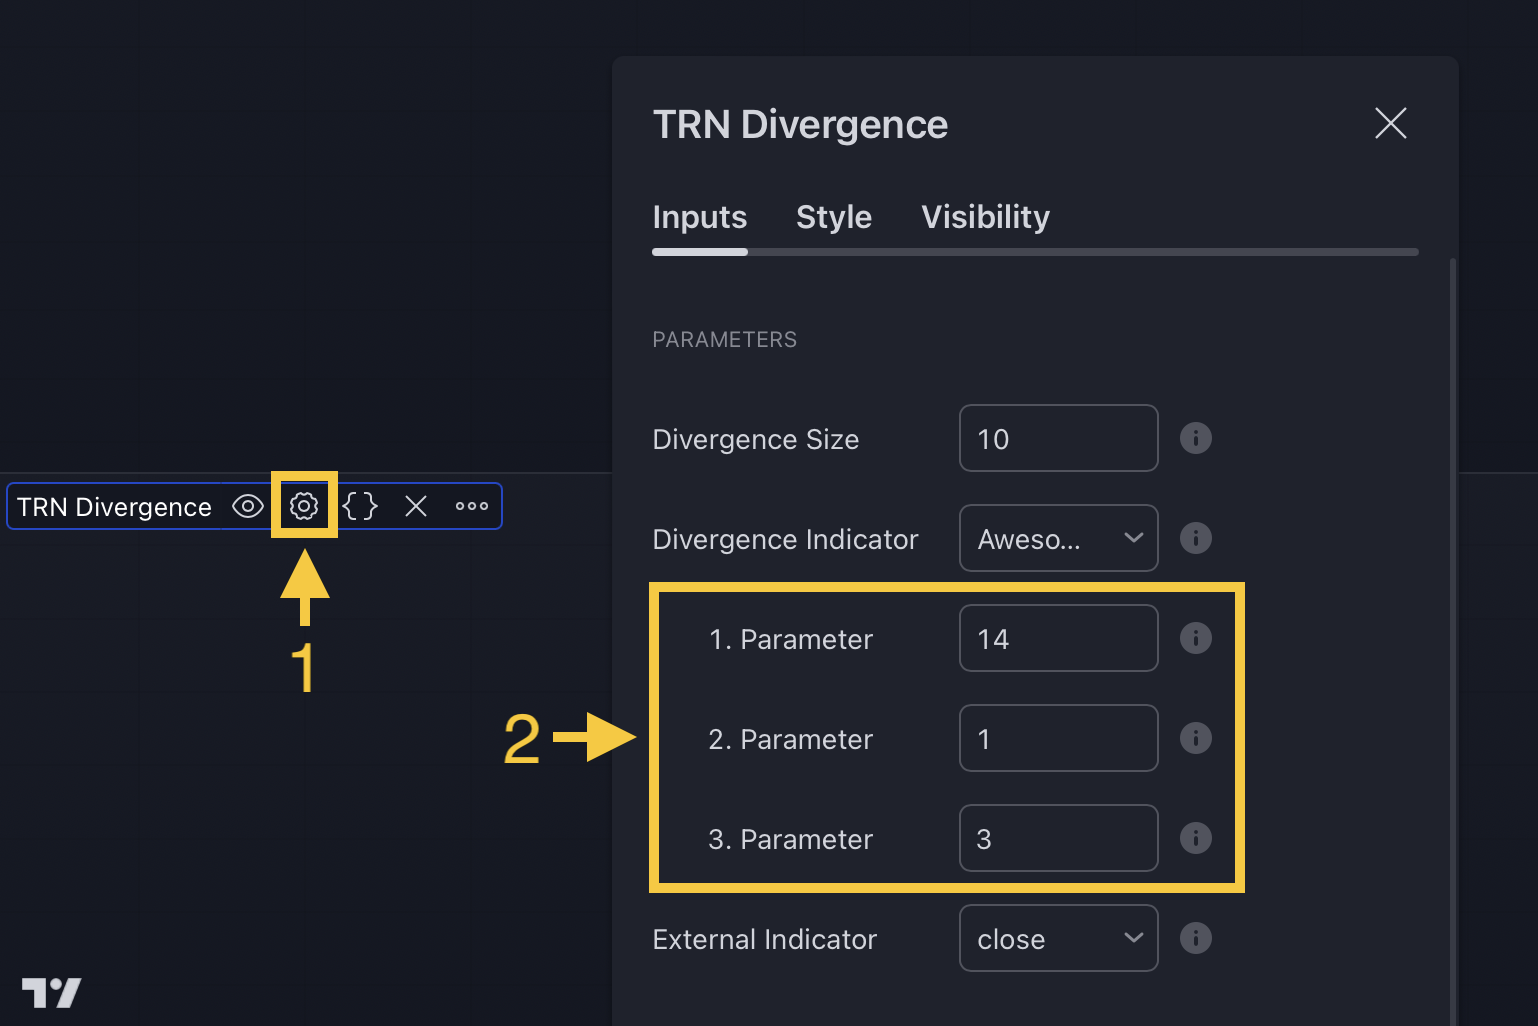
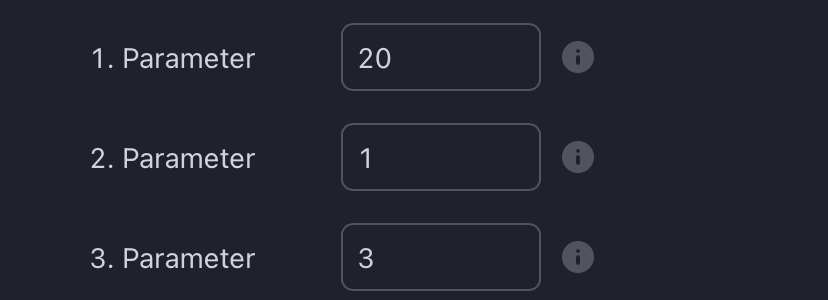
To begin, access the indicator settings (1). Look for the "Parameters" section (2) where you can fine-tune Parameters 1-3. The default settings are already optimized for the oscillators AO, RSI, CDV, W%R, MFI and Stochastic. For other divergence indicators, refer to the respective sections above associated with the dual oscillators to find their default configurations.
How To Use Divergence Detector
The divergence detector of SMT/Divergence Suite works by comparing the price of an asset to one of the 11 build in oscillators, such as Relative Strength Index (RSI) or Moving Average Convergence Divergence (MACD). Follow these steps to use the SMT/Divergence Suite properly:
1. Setup Divergence Detector
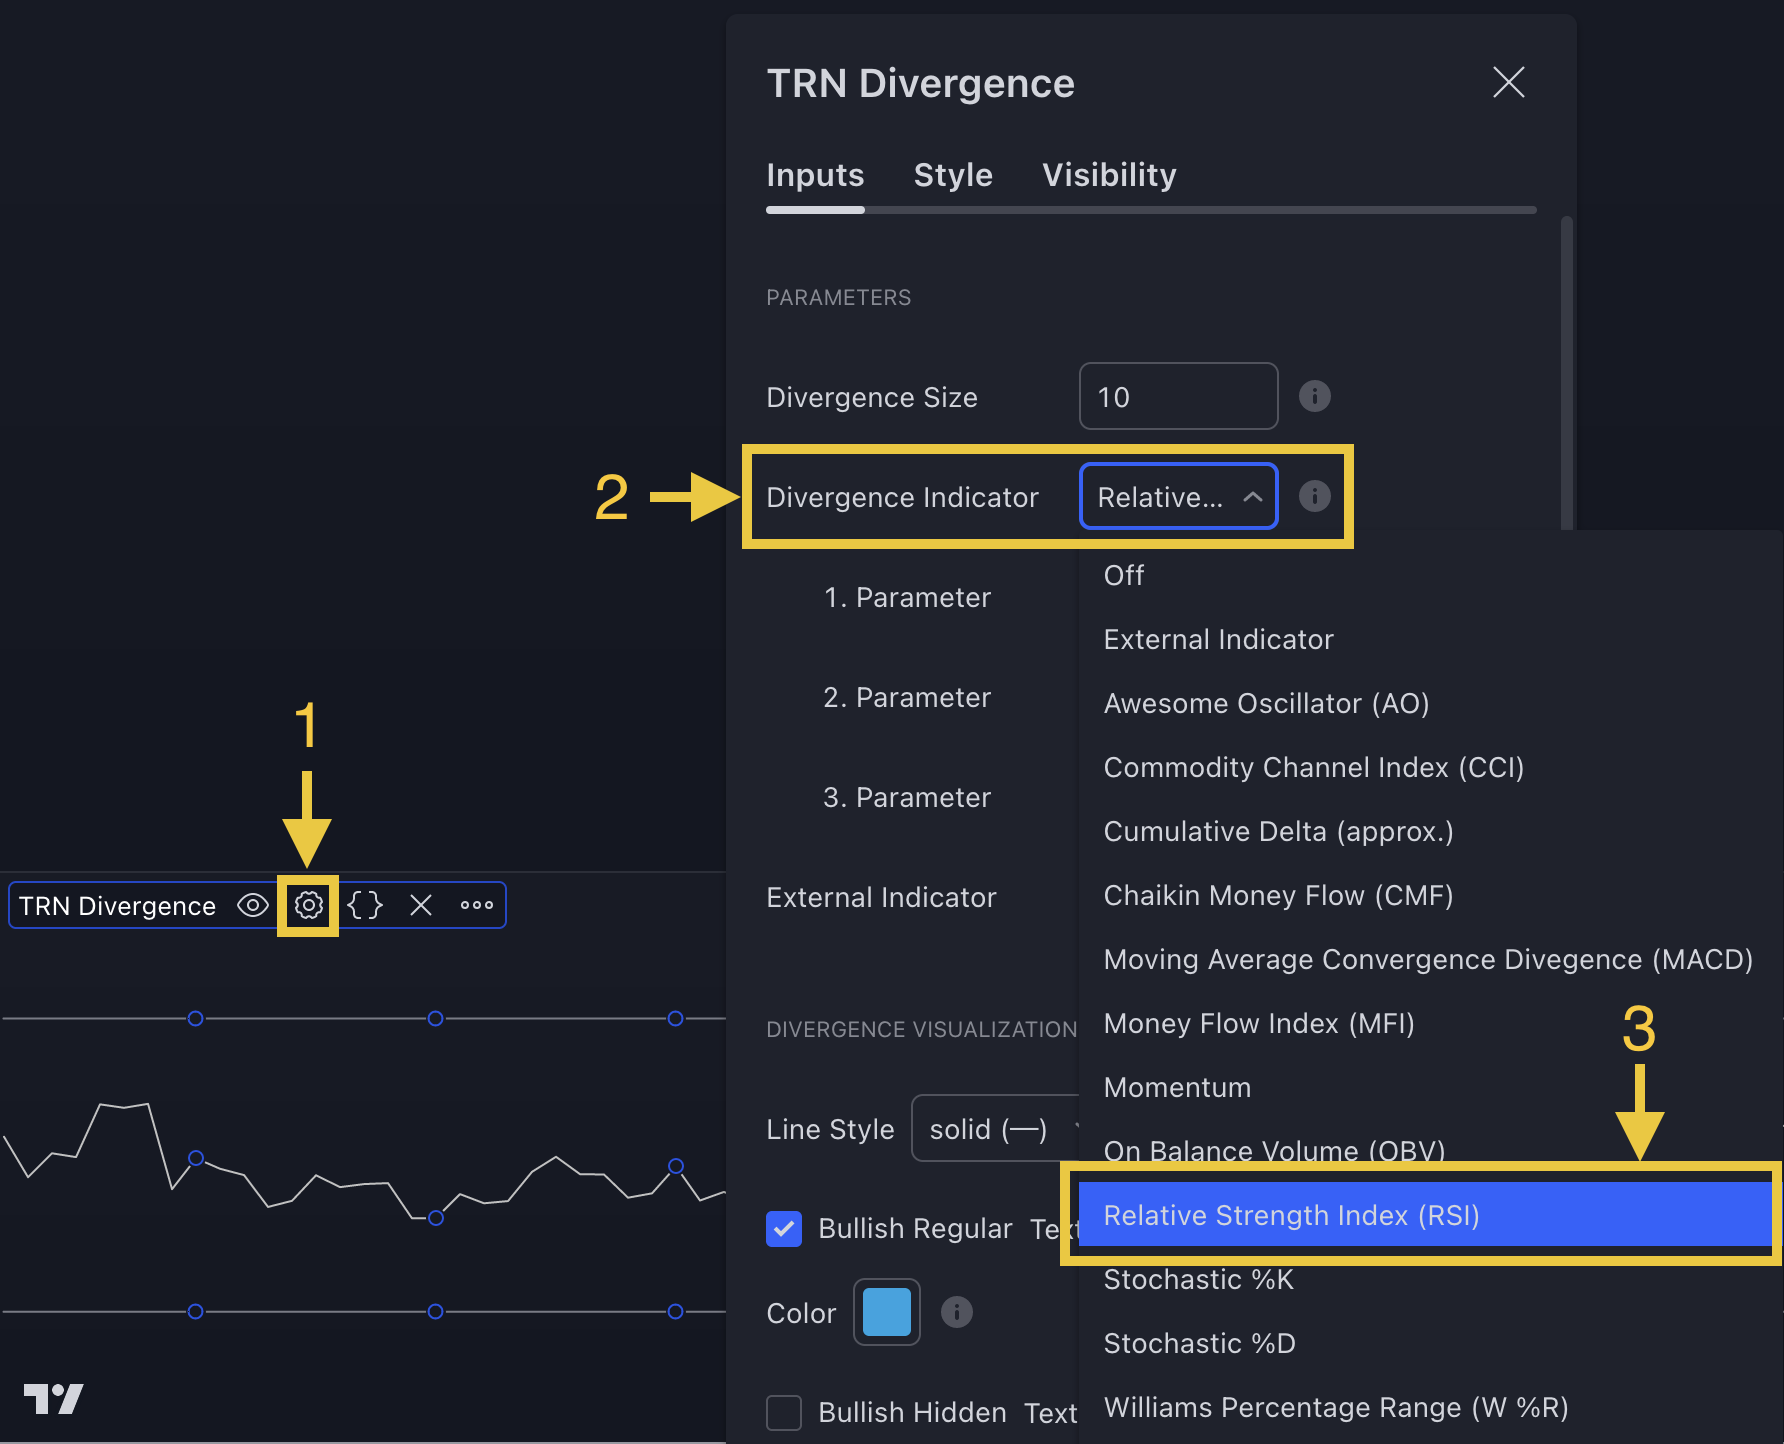
Go to indicator settings (1) and choose one of our build in oscillators under the section "Parameters" of the menu item "Inputs" (2), like for example the RSI (3) (see figure).
If you use the default settings of the SMT/Divergence Suite, the Awesome Oscillator (AO) will be the first oscillator you see when you add our tool to your chart.
2. Find Divergences
The indicator looks for divergences between the price and the indicator on the asset and timeframe of your choice, and then highlights these divergences with colored lines on the chart. Blue lines for bullish divergences and red lines for bearish divergences.

When a divergence is detected, the colored lines can serve as a visual cue to traders that a potential trend reversal is about to occur. Traders can then use this information to make informed trading decisions, such as entering or exiting a trade based on a signal from the TRN Bars or from one of the TRN Chart Patterns.
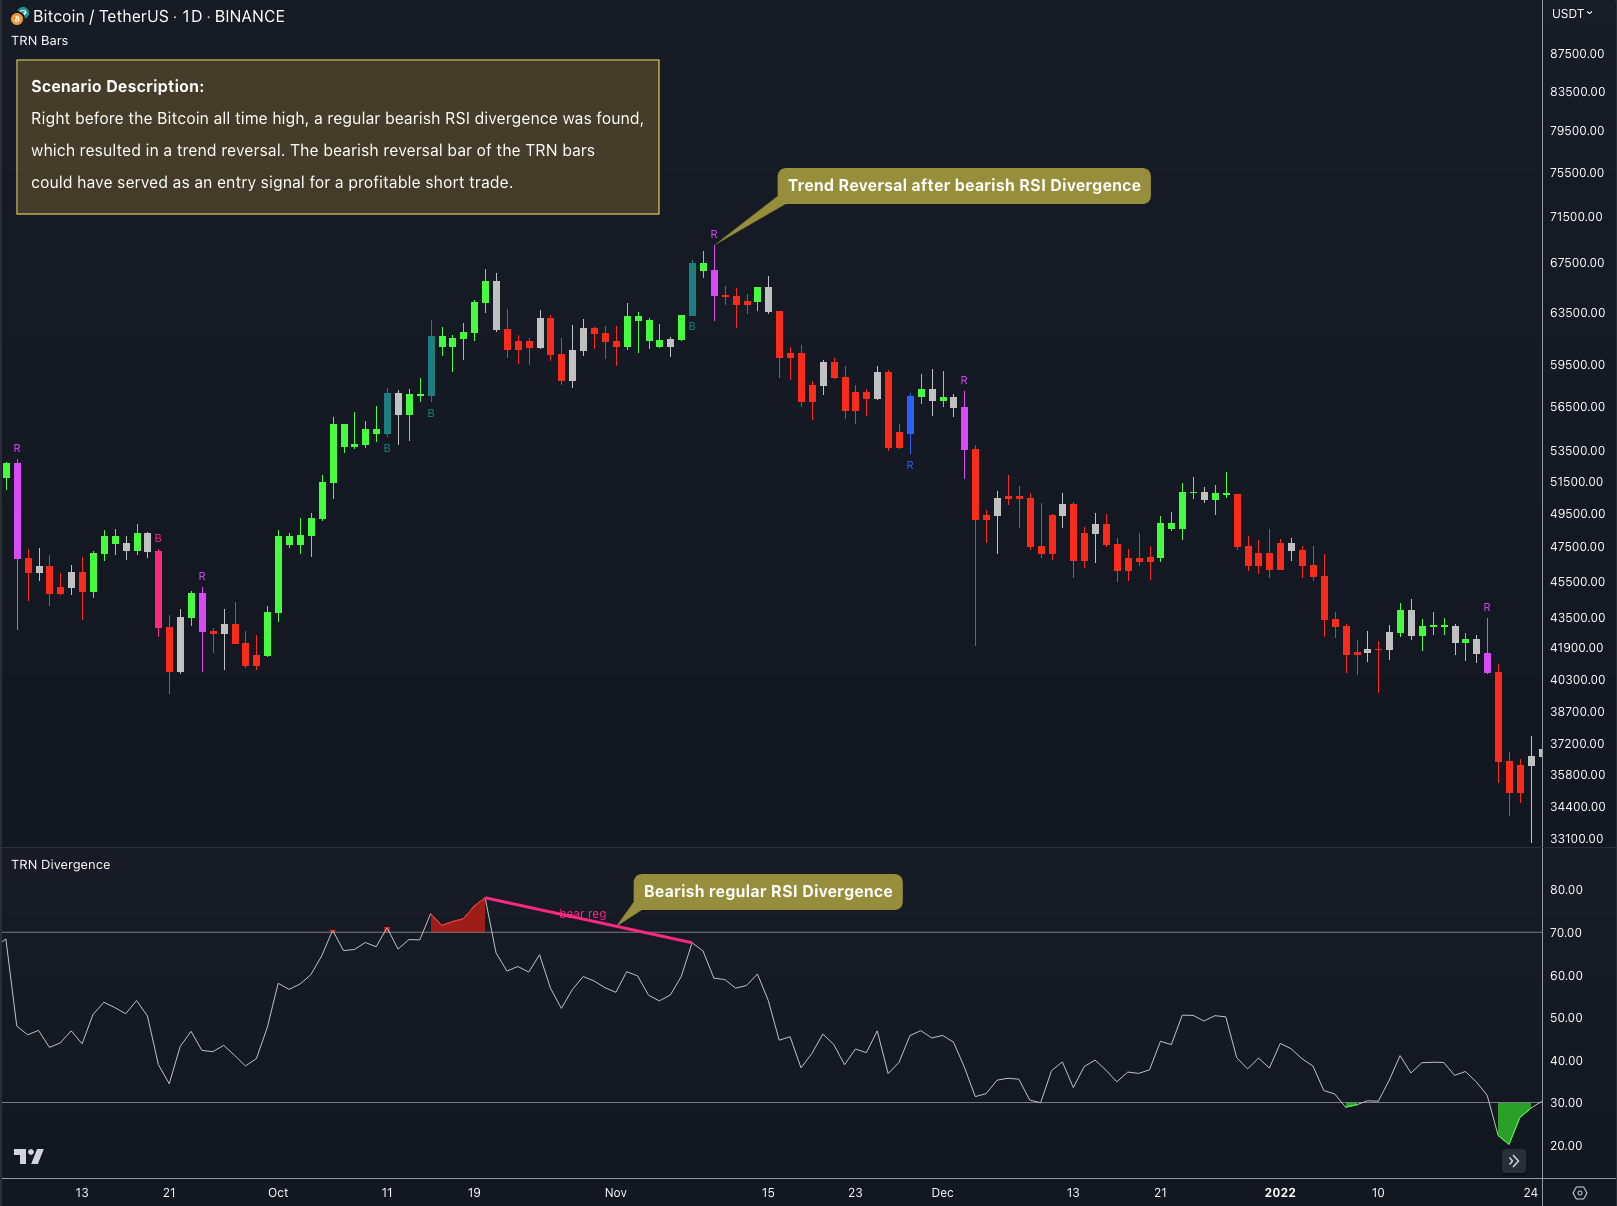
Bearish and bullish divergences are not foolproof indicators and should be used in conjunction with other analysis techniques and risk management strategies.
Have a look at our Combinations section to see possible combinations of the SMT/Divergence Suite with other TRN Trading tools.