TRN Bars
The innovative TRN Bars are designed to help traders to analyze markets in an intuitive way, by replacing the default candlesticks or chart bars. They show bullish and bearish trends based on color coding the bars and give high probability trade opportunities with special colors.
How To Setup TRN Bars
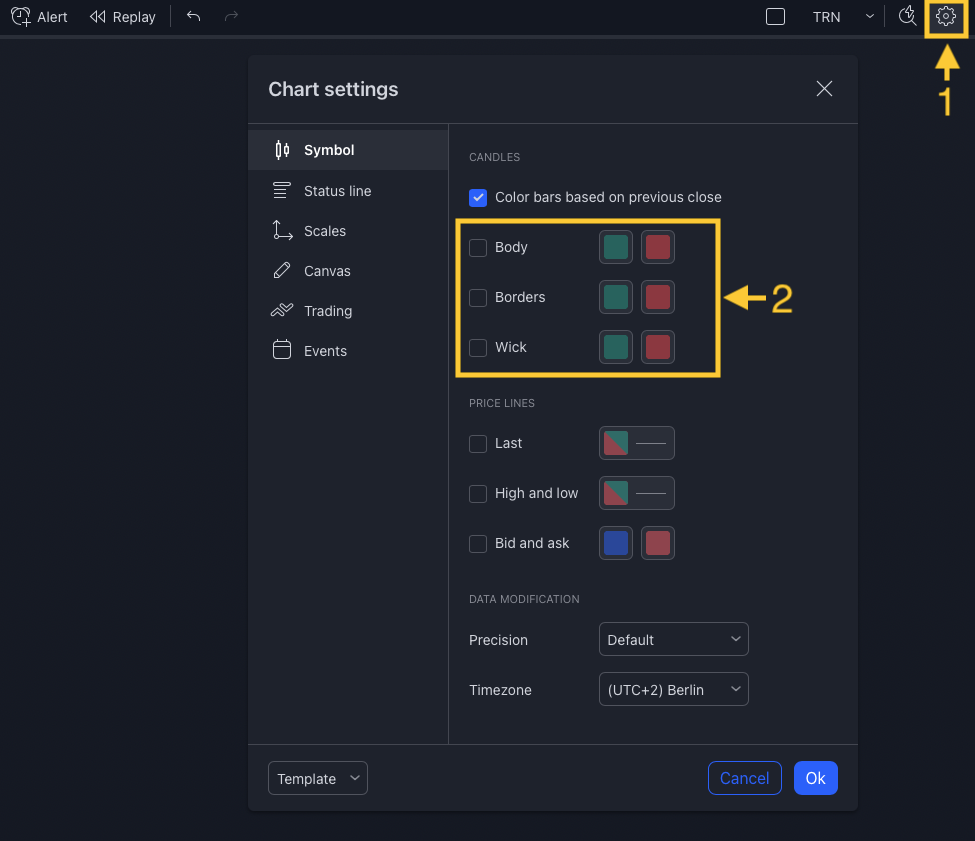
Add TRN Bars onto your chart and ensure the default TradingView candles are hidden. To achieve this, access "Chart Settings" (1) and disable "Body," "Borders," and "Wick" in the "Candles" section (2).
Bar Types
The TRN bars incorporate Signal Bars, distinguished by their distinct colors, to offer potential buy and sell signals. These Signal Bars play a crucial role when used in conjunction with other TRN tools like the Swing Suite, SMT/Divergence Suite, or our chart patterns. By leveraging the power of these combined tools, traders can enhance their trading decisions and gain deeper insights into market dynamics.
Visit our Combinations section to see possible combinations with the TRN Bars which deliver high probability signals.
Trend Bars
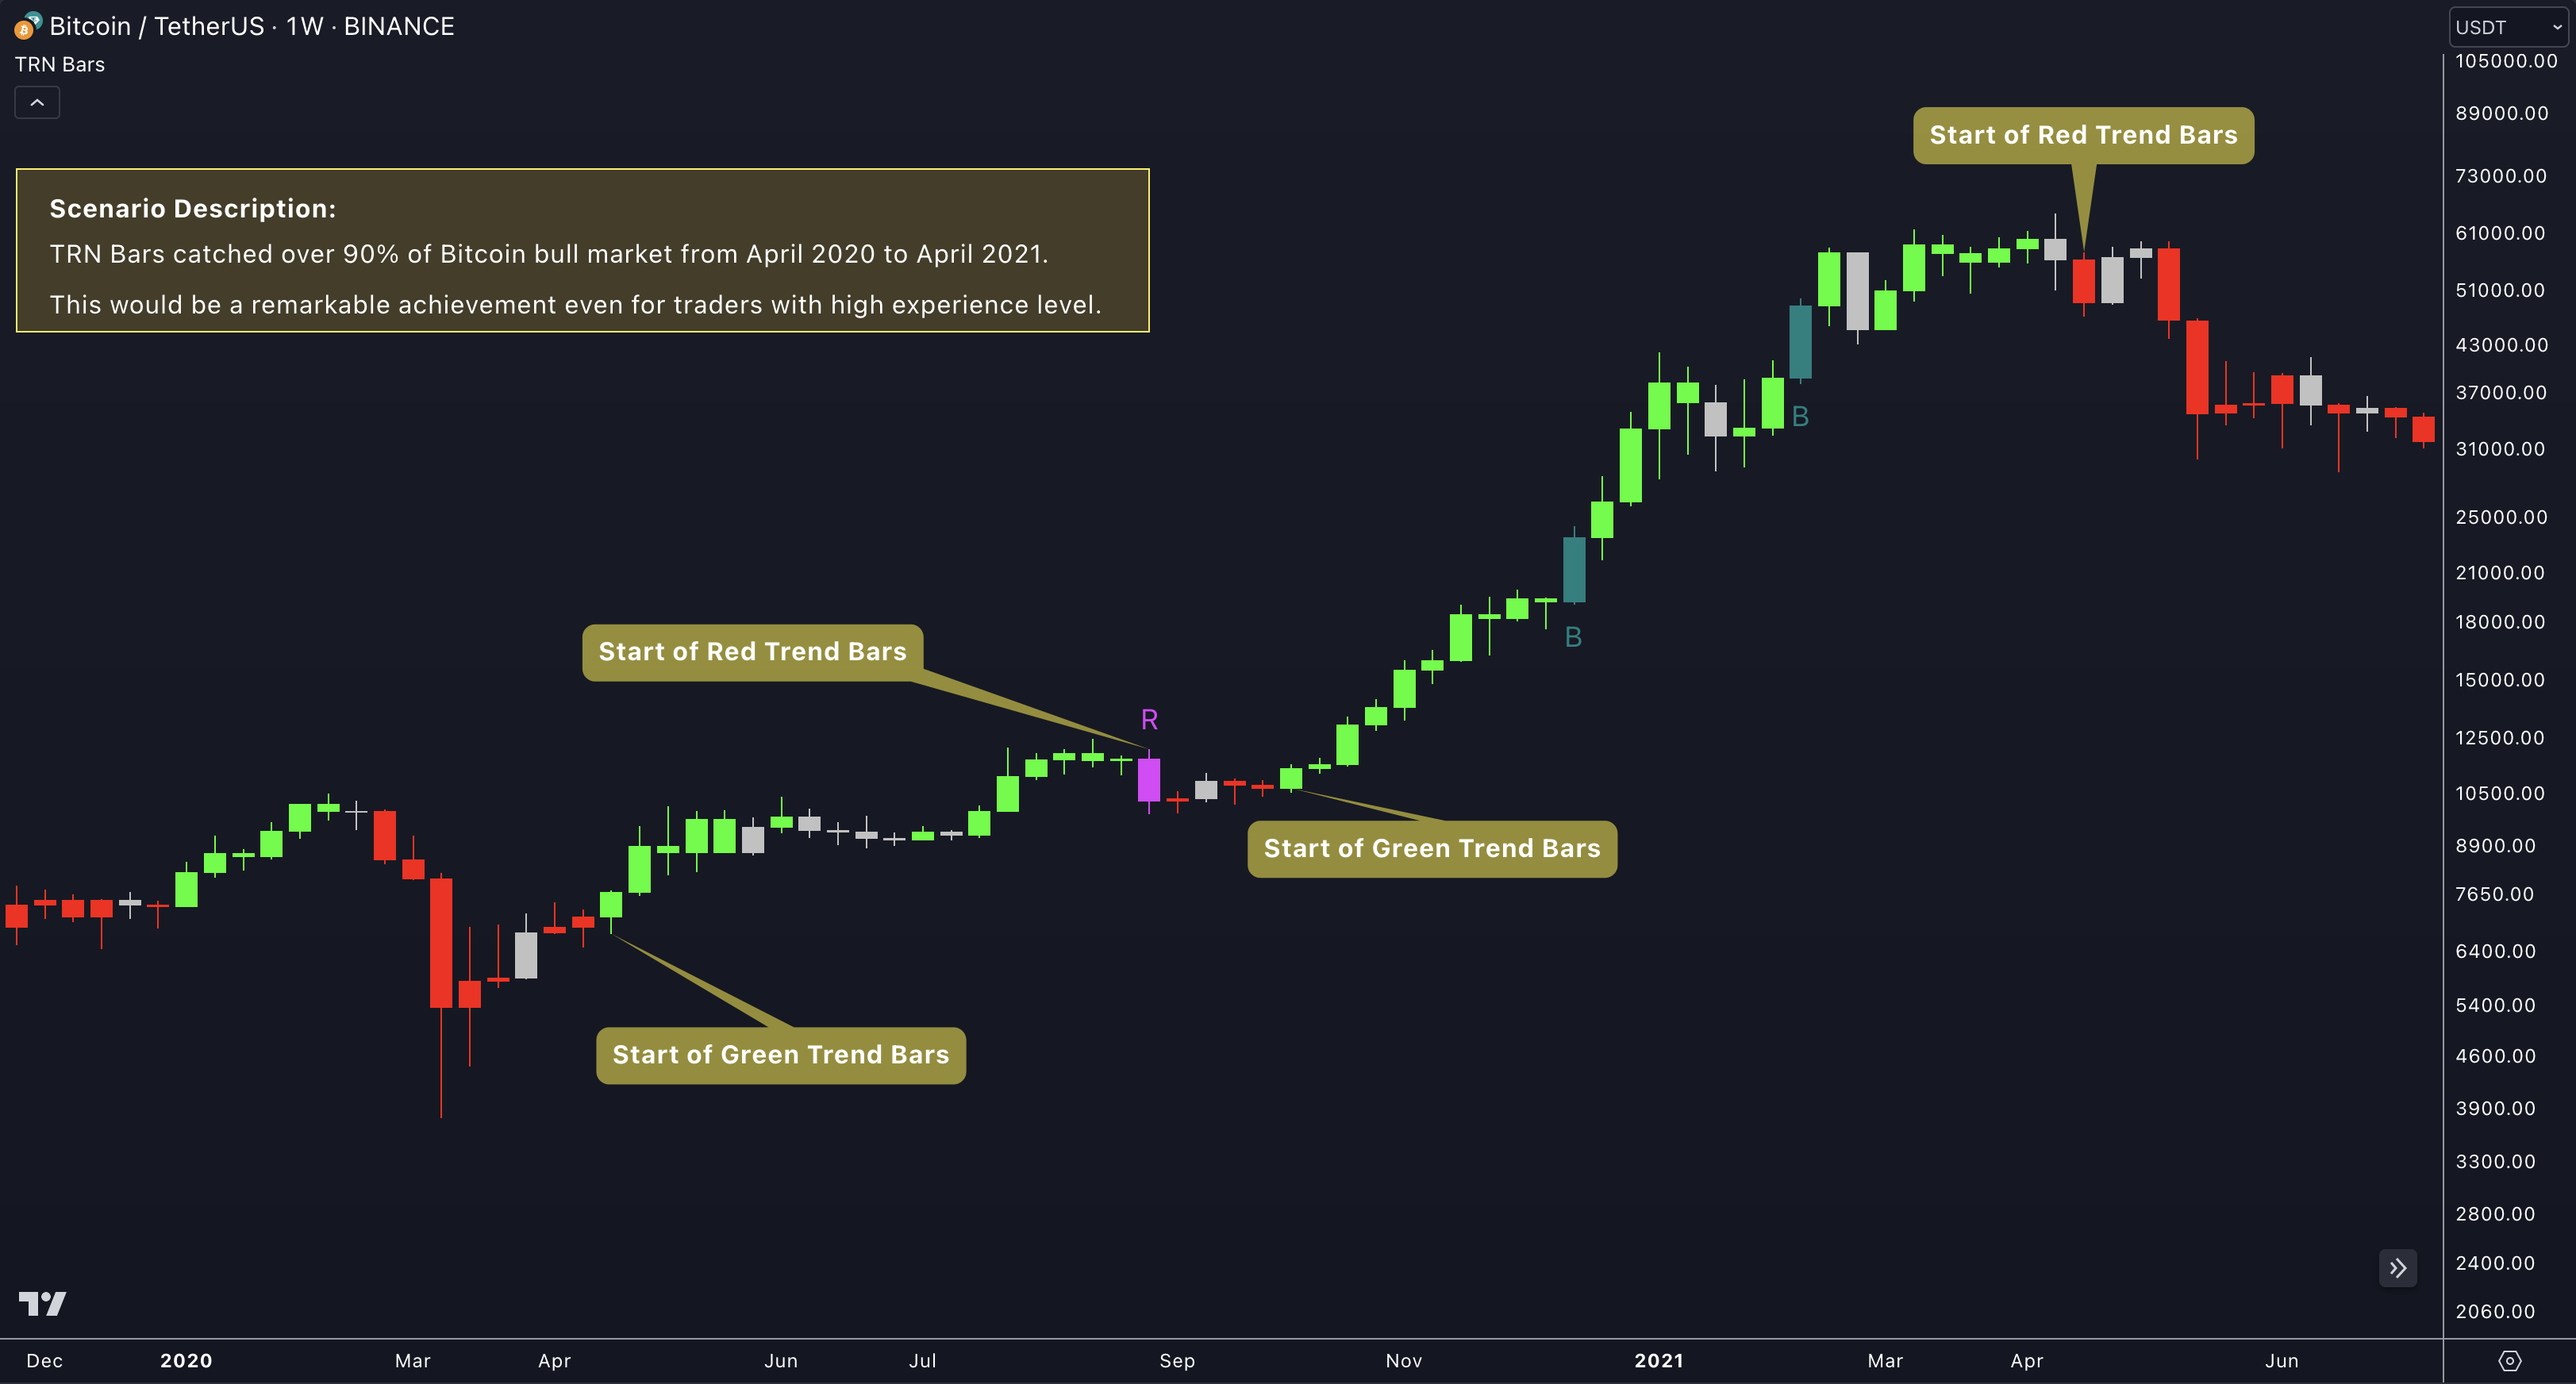
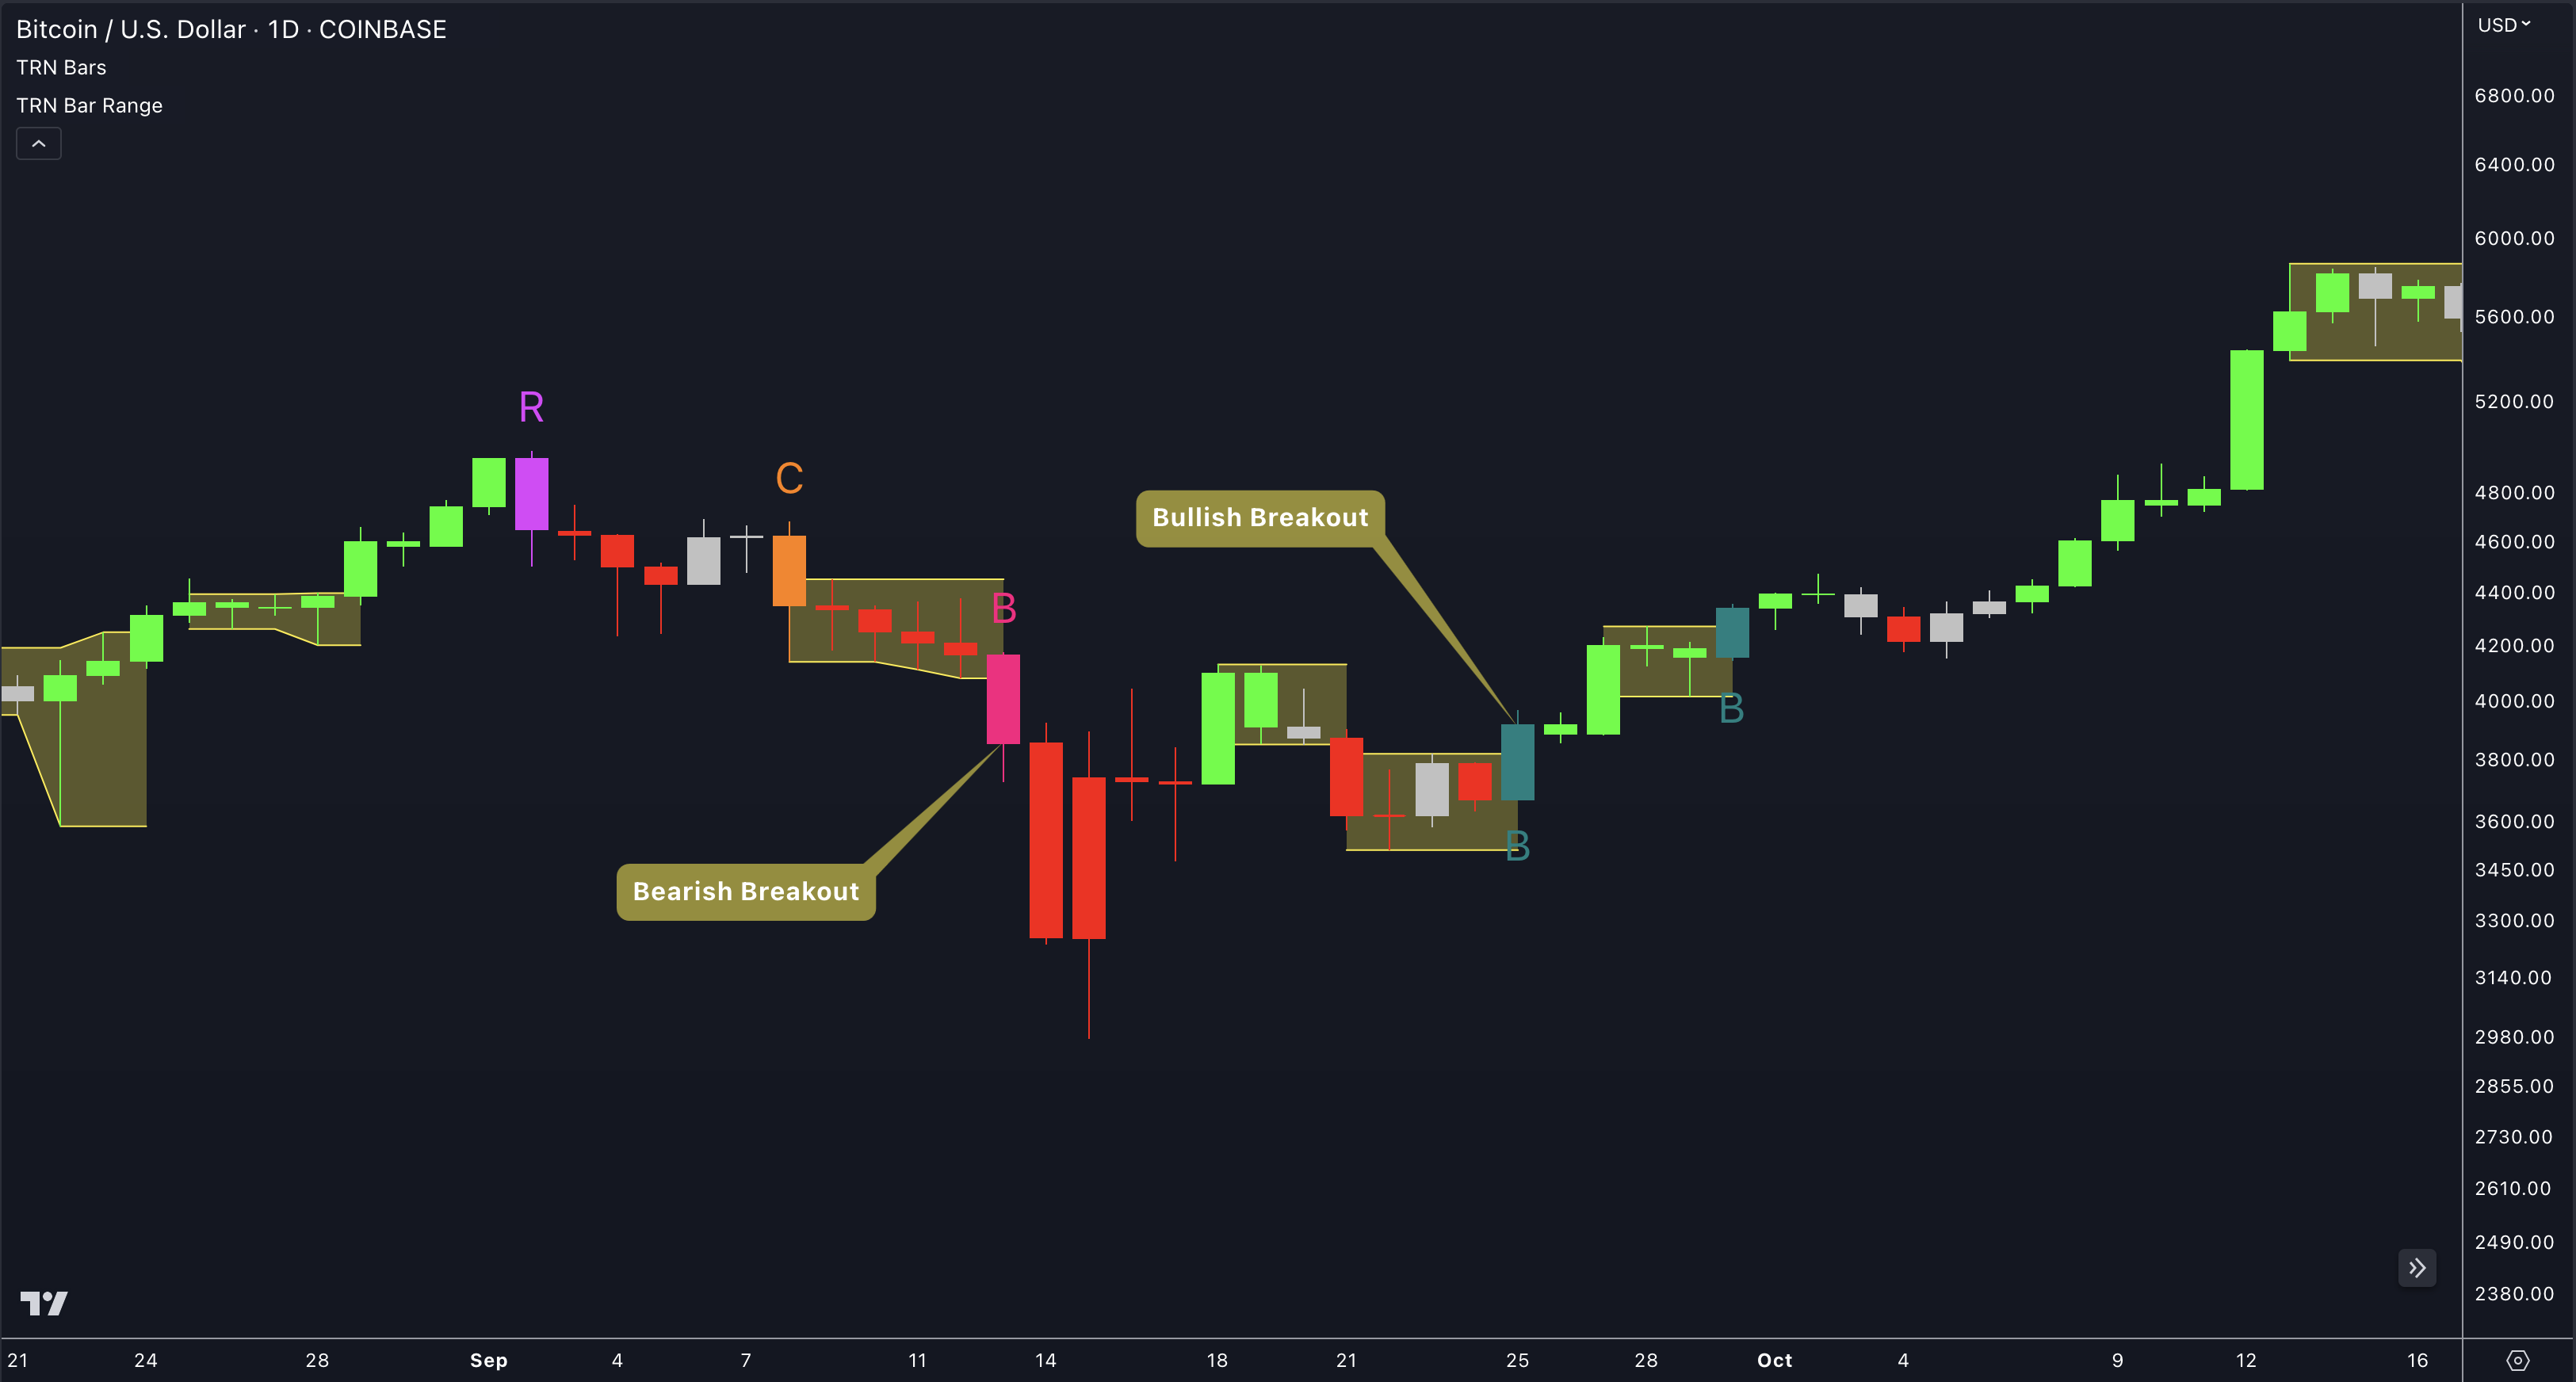
Green Bars signify a sustained uptrend, indicating a bullish market sentiment. On the other hand, Red Bars indicate a persistent downtrend, representing a bearish market sentiment. The transition from red to green denotes a bullish trend reversal, suggesting a shift from bearish to bullish sentiment. Conversely, the shift from green to red signals a bearish trend reversal, indicating a transition from bullish to bearish sentiment. By monitoring these color changes, traders can identify potential trend reversals and make informed trading decisions.
The presence of gray and black bars indicates a neutral market state, often observed before an impending color change from red to green or green to red. These neutral bars serve as a transition phase between the previous trend and the potential reversal.
Reversal Bars
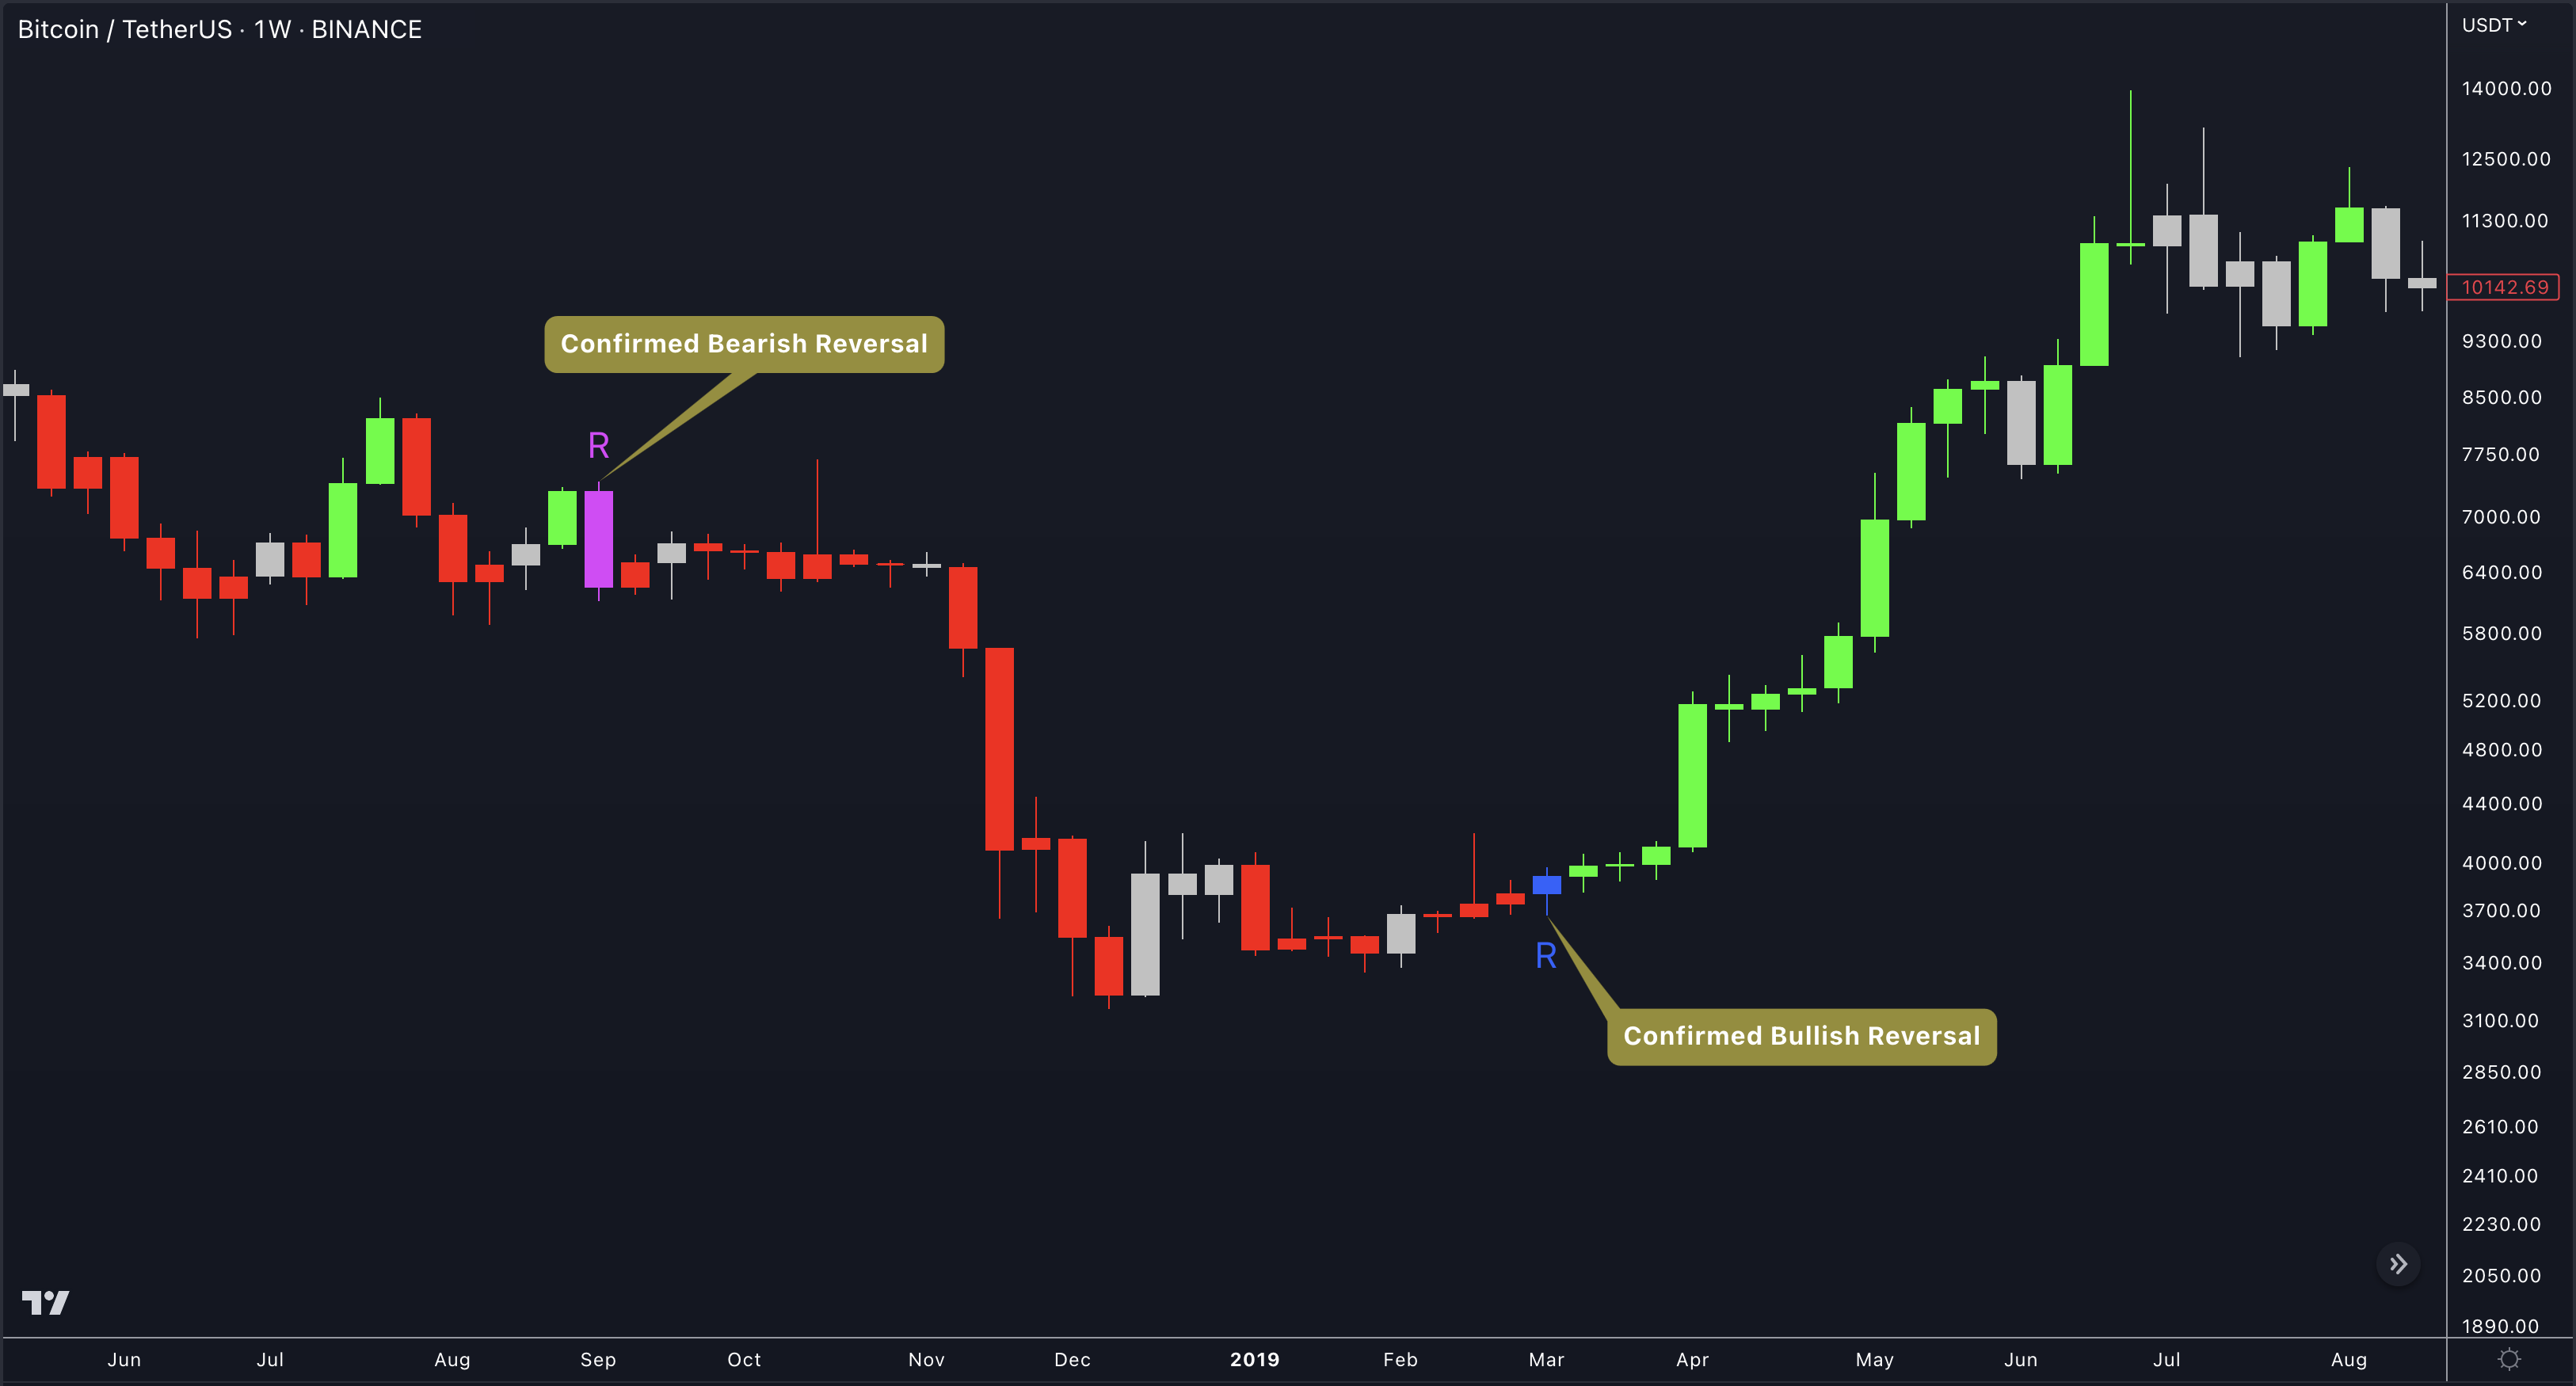
The presence of blue Reversal Bars indicates a trend reversal to the upside, while pink Reversal Bars indicate a reversal to the downside. These bars not only serve as signals for potential trend shifts but also present favorable opportunities to enter the market or increase one's position size. When combined with our suite of complementary tools, such as Swing Suite, SMT/Divergence Suite, and our chart patterns, these Reversal Bars can unlock trading opportunities with a higher probability of success.
Continuation Bars
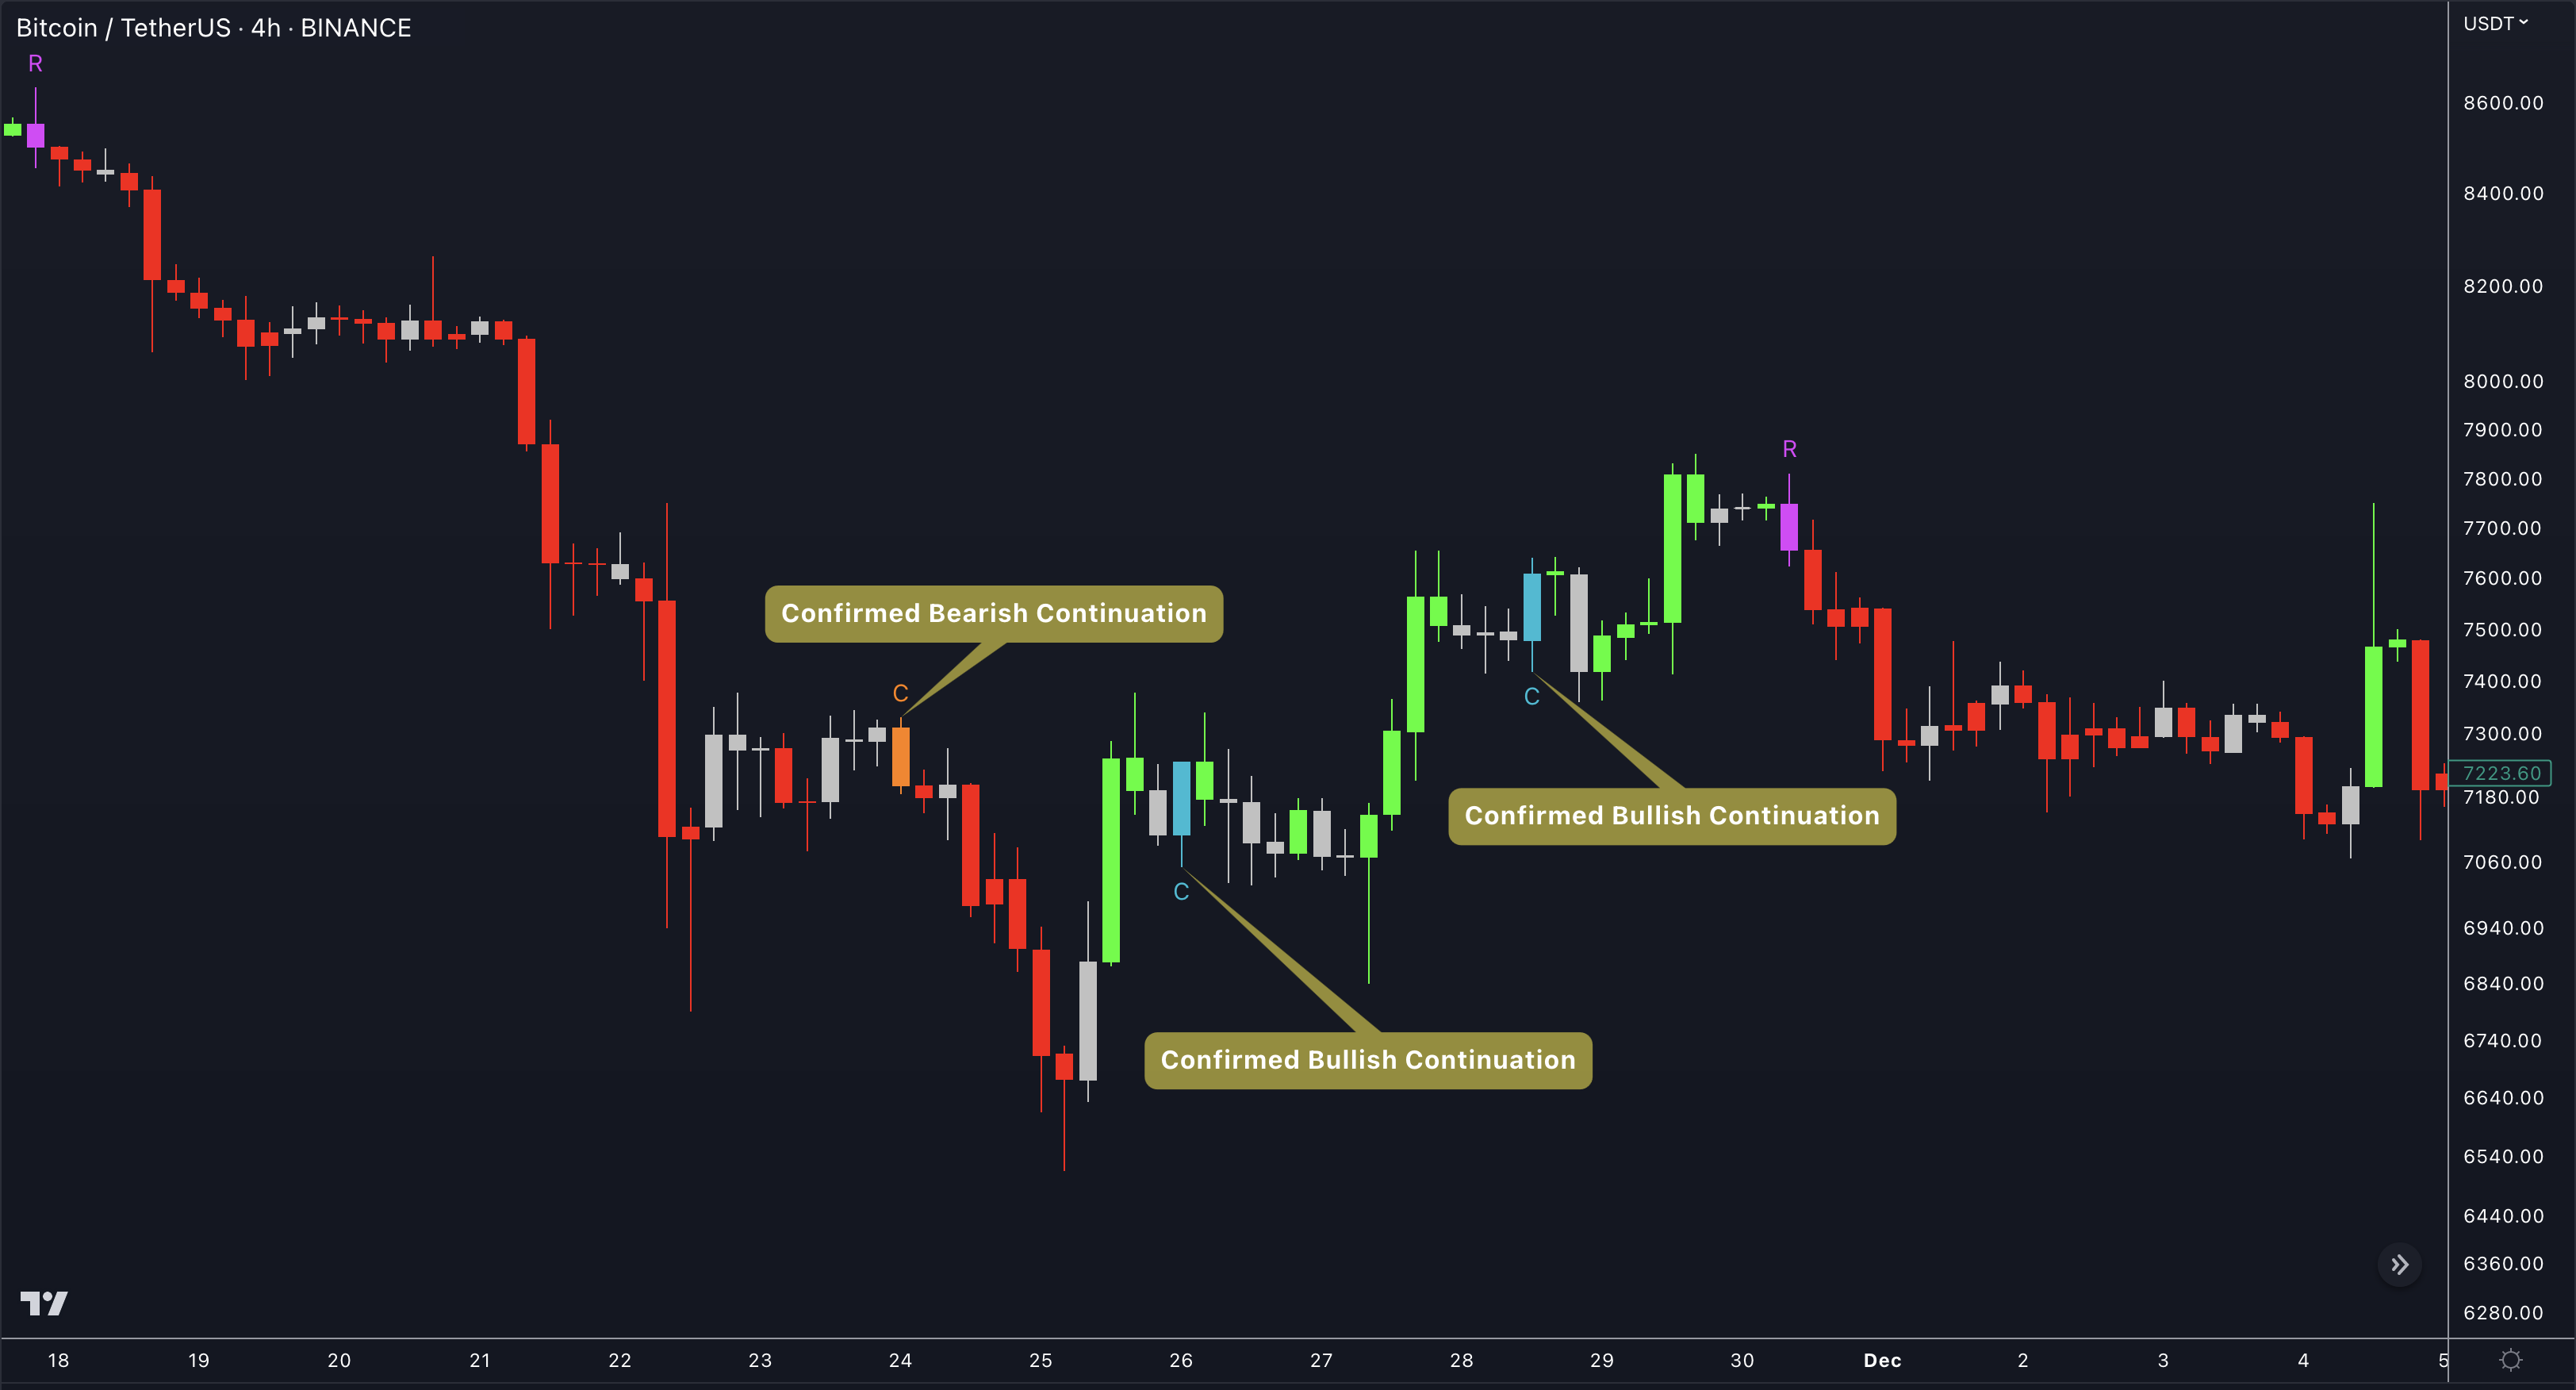
In addition to the reversal bars, our TRN Bars also include bullish continuation bars (colored turquoise) and bearish continuation bars (colored orange). These bars act as signals for the continuation of an existing trend. Similar to the reversal bars, they can be utilized as entry points or opportunities to augment one's position size.
Breakout Bars
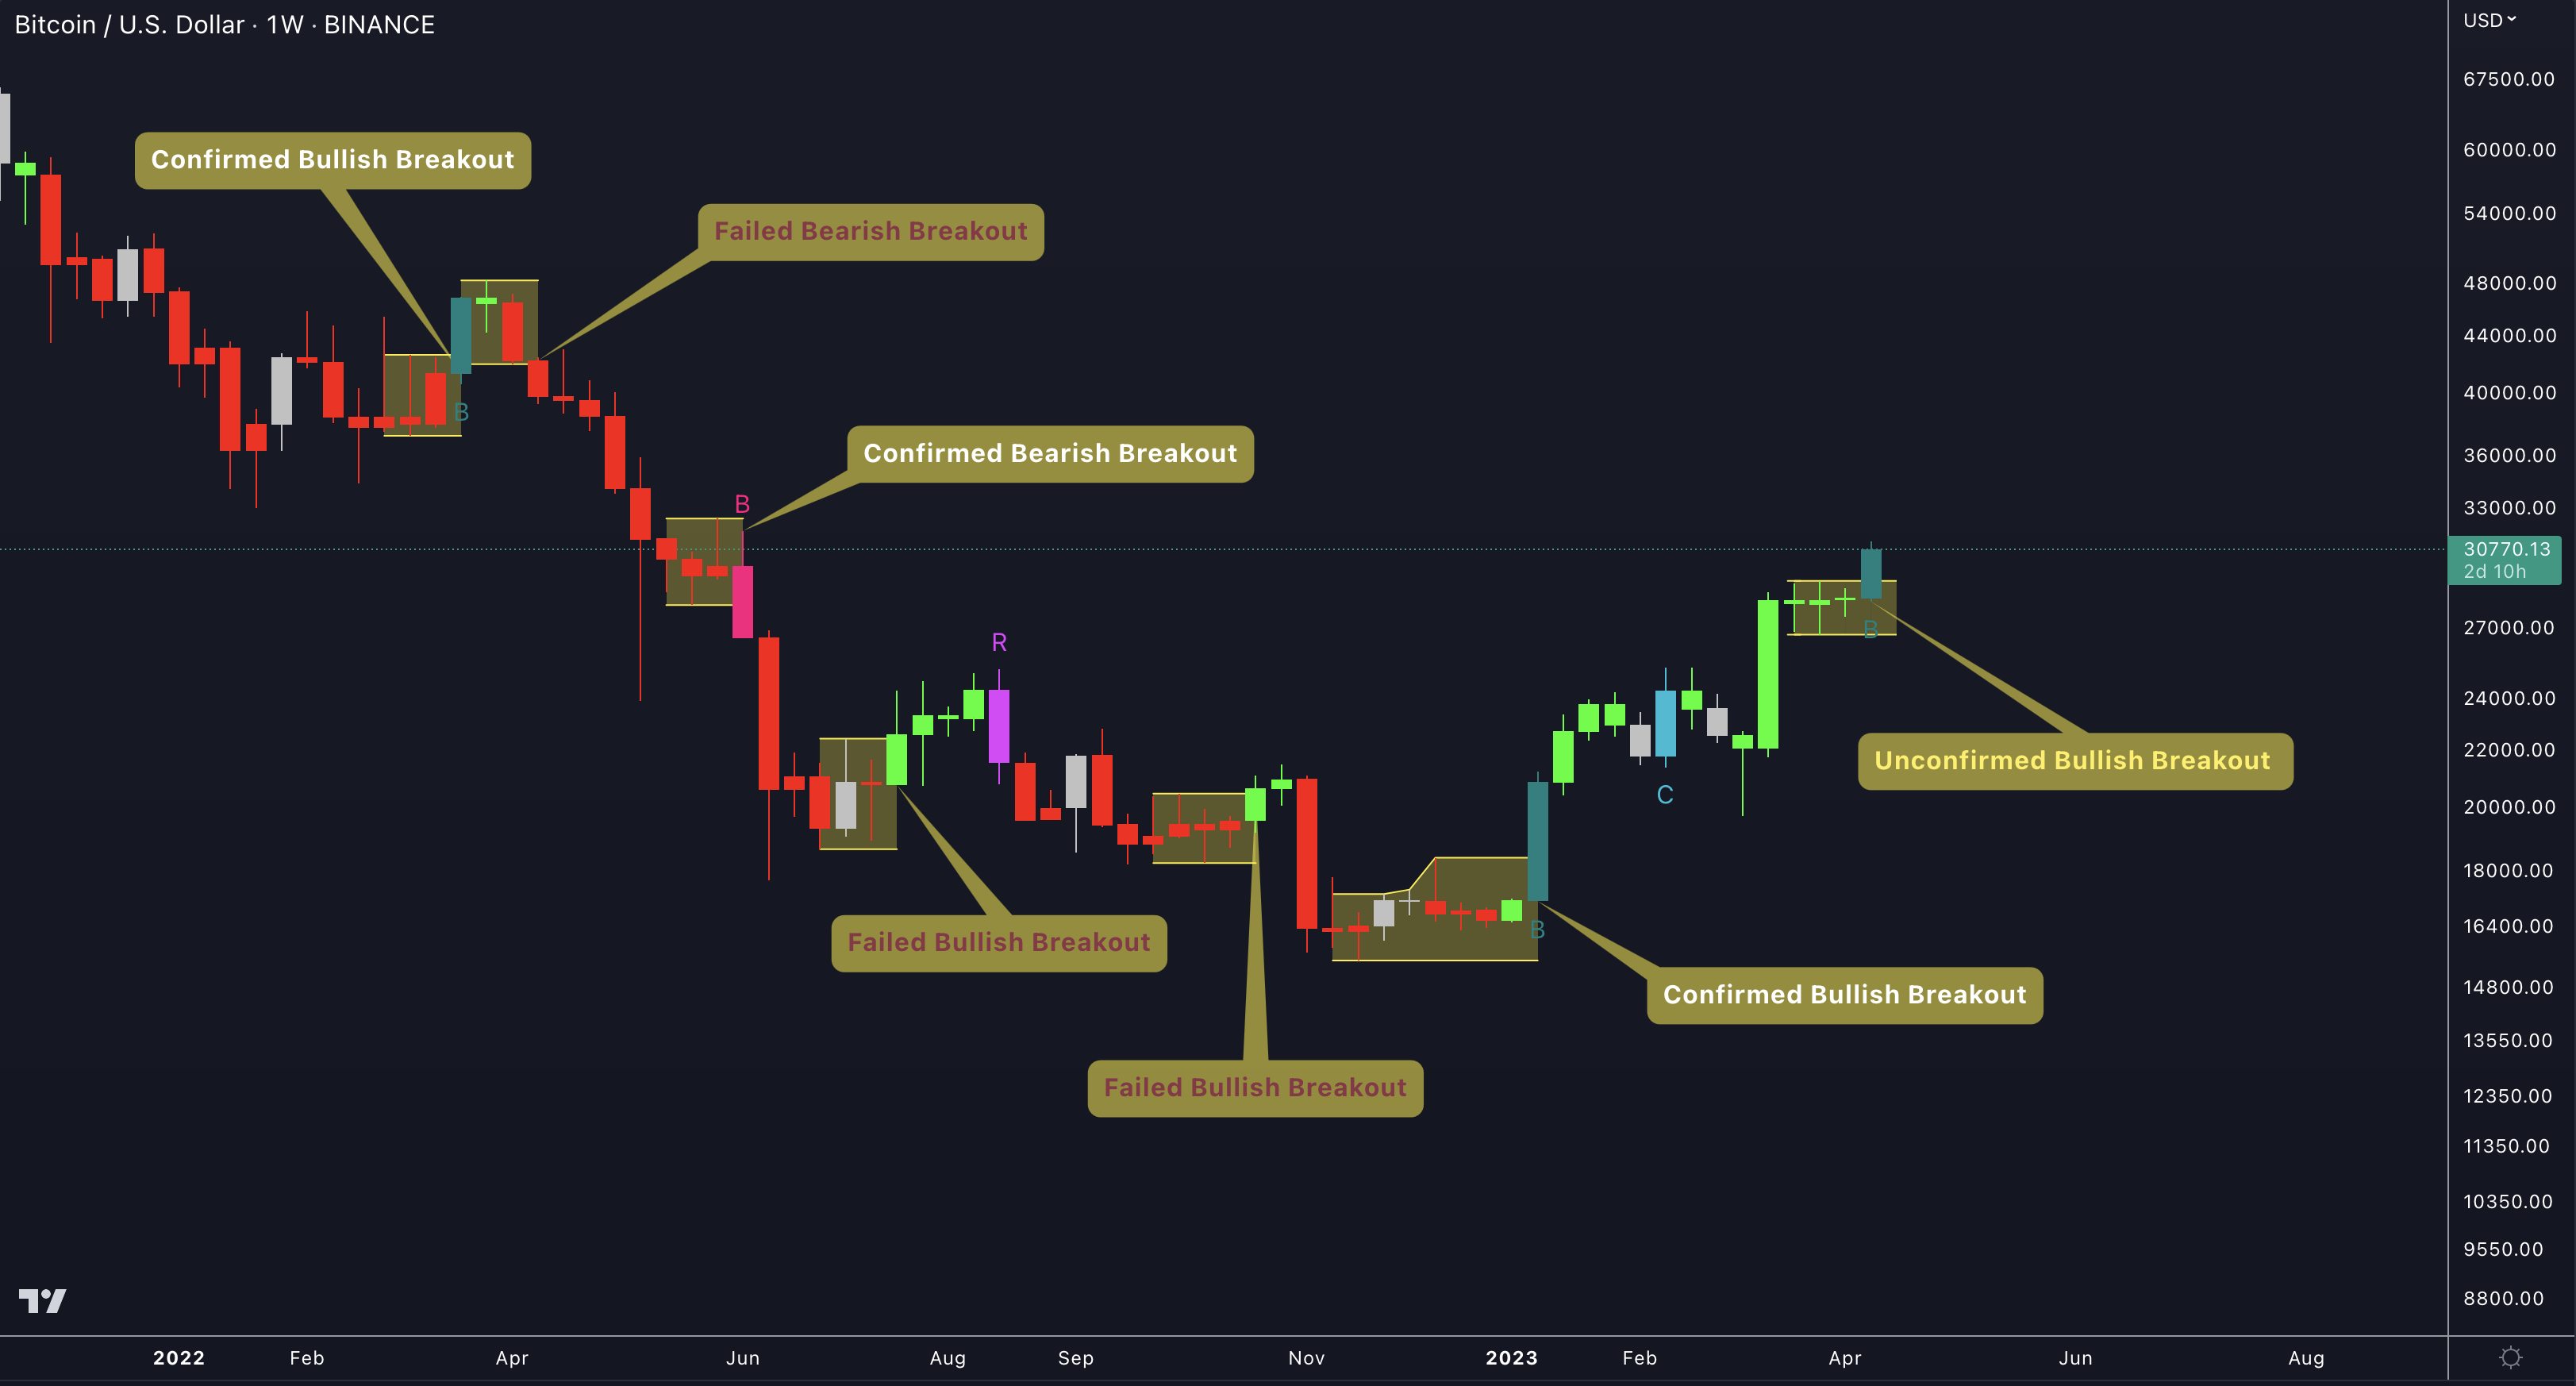
The dark green breakout bars within our TRN Bars are significant indicators of a breakout from a price range. They signify the continuation or potential change in a trend following a consolidation phase. As such, these bars hold dual functionality, serving as reversal signals and validating the persistence of an ongoing trend.
TRN Bar Range
A price range in trading refers to the range of prices at which a particular asset or security is traded over a given period of time. It represents the high and low prices of the asset during that period, and is often used as a measure of volatility.
For example, if a stock is trading in a price range of $50 to $60 over a month, this means that the highest price during that period was $60, and the lowest was $50. Traders may use this information to determine potential entry and exit points for trades, as well as to assess risk and reward.
Price ranges can vary greatly depending on the asset being traded and the time frame being considered. In the case of cryptocurrencies, which can be highly volatile, price ranges may be much wider than those for more stable assets like stocks or bonds.
How To Use TRN Bar Range
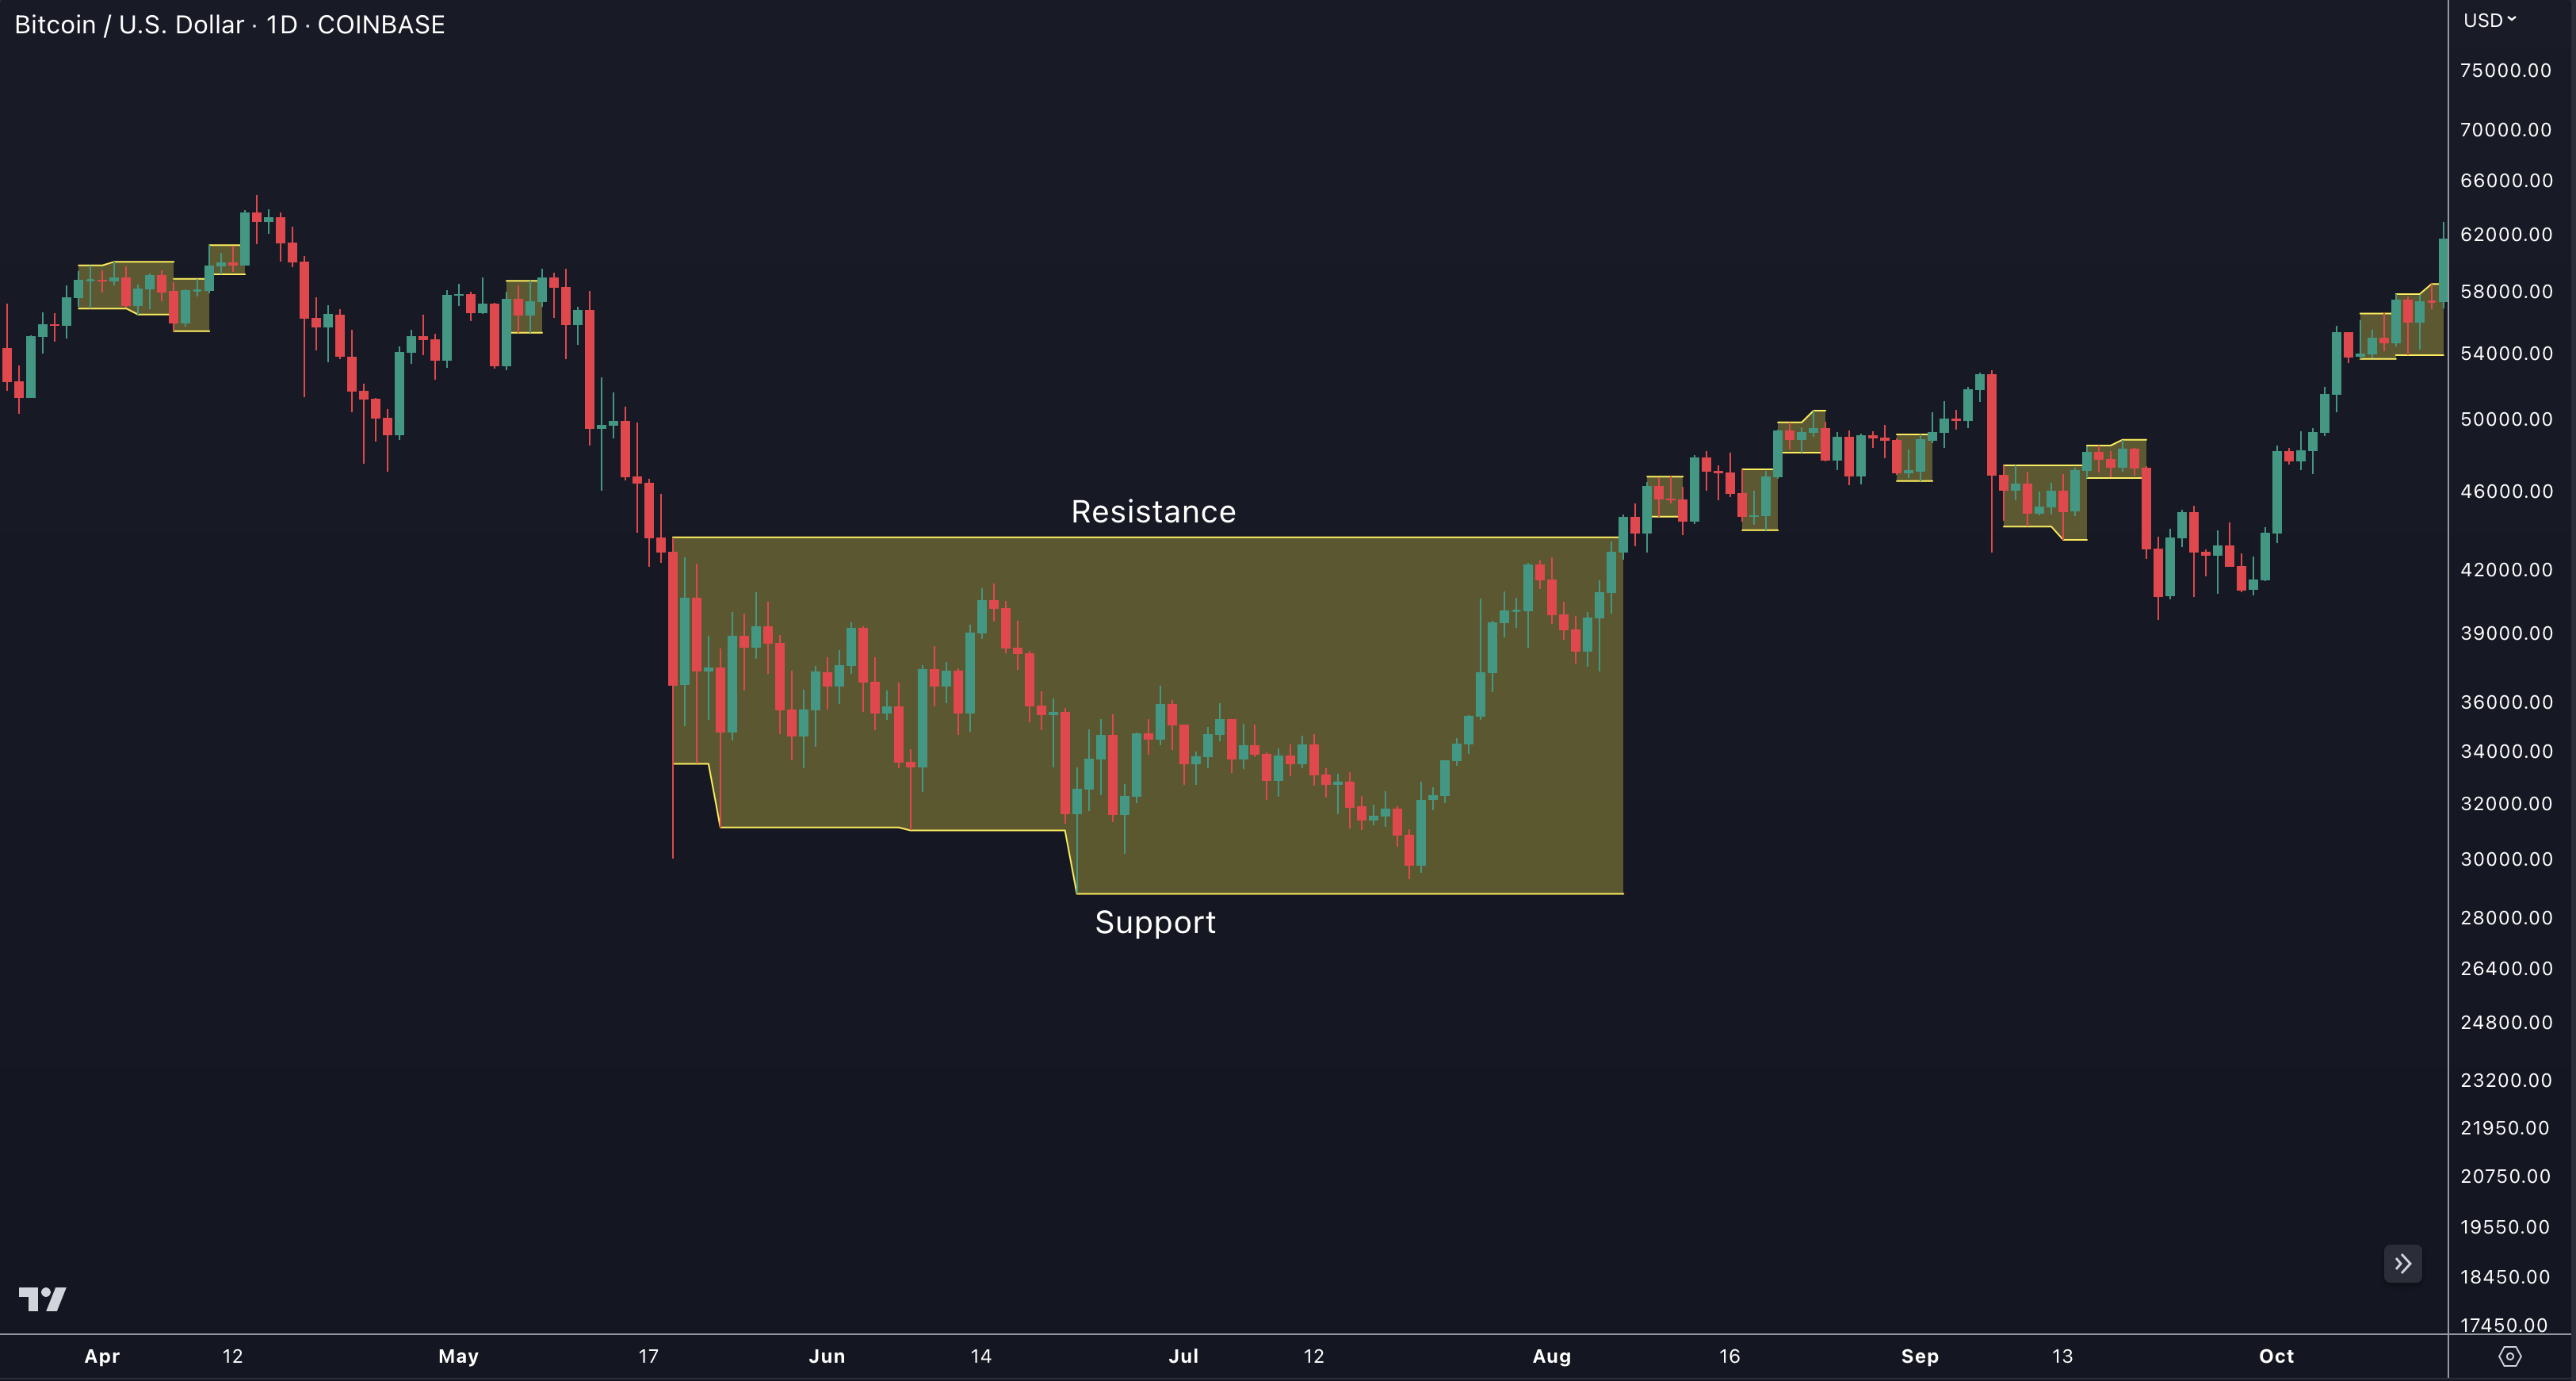
Ranges can be valuable for traders as they provide information about the potential levels of support and resistance in the market. Here are a few ways you can use TRN Bar Range in your trading:
Identify Support And Resistance Levels
TRN Bar range can help you identify key support and resistance levels on a chart. Support levels are price levels where buying pressure is expected to be strong enough to prevent the price from falling further, while resistance levels are price levels where selling pressure is expected to be strong enough to prevent the price from rising further. By observing price ranges and identifying these levels, you can make more informed decisions about entering or exiting trades.
Breakout Trading
Price ranges can also provide insights into potential breakout opportunities. Breakouts occur when the price breaks out of a defined range, signaling a potential shift in market sentiment and the start of a new trend. The Color highlighted Breakout Bars from the TRN Bars are signaling a confirmed breakout of a price range.
Traders can enter positions in the direction of the breakout and set appropriate stop-loss orders to manage risk.
Stop Placement
Price ranges can help traders determine appropriate levels for placing stop-loss orders. If you enter a trade within a price range, you may set your stop-loss order just outside the range, above resistance for short positions or below support for long positions. Placing stops outside the range can help protect your capital in case the price breaks out of the range and moves against your position.
Volatility Assessment
Price ranges can provide insights into market volatility. Narrow ranges typically indicate low volatility and a period of consolidation, while wider ranges suggest higher volatility and potential trading opportunities. By analyzing price ranges over different time frames, you can gauge the overall volatility of the market and adjust your trading strategies accordingly.
TRN Dynamic Trend
The Dynamic Trend is based on the ADXVMA (Average Directional Index Volatility Moving Average). It's a technical indicator that combines elements from the Average Directional Index (ADX) and volatility to produce a moving average line that adapts to changing market volatility. This adaptive behavior can provide more relevant information for traders when compared to traditional moving averages which don't consider volatility.
Inspired by Fat Tails
Determine Market Trend Strength
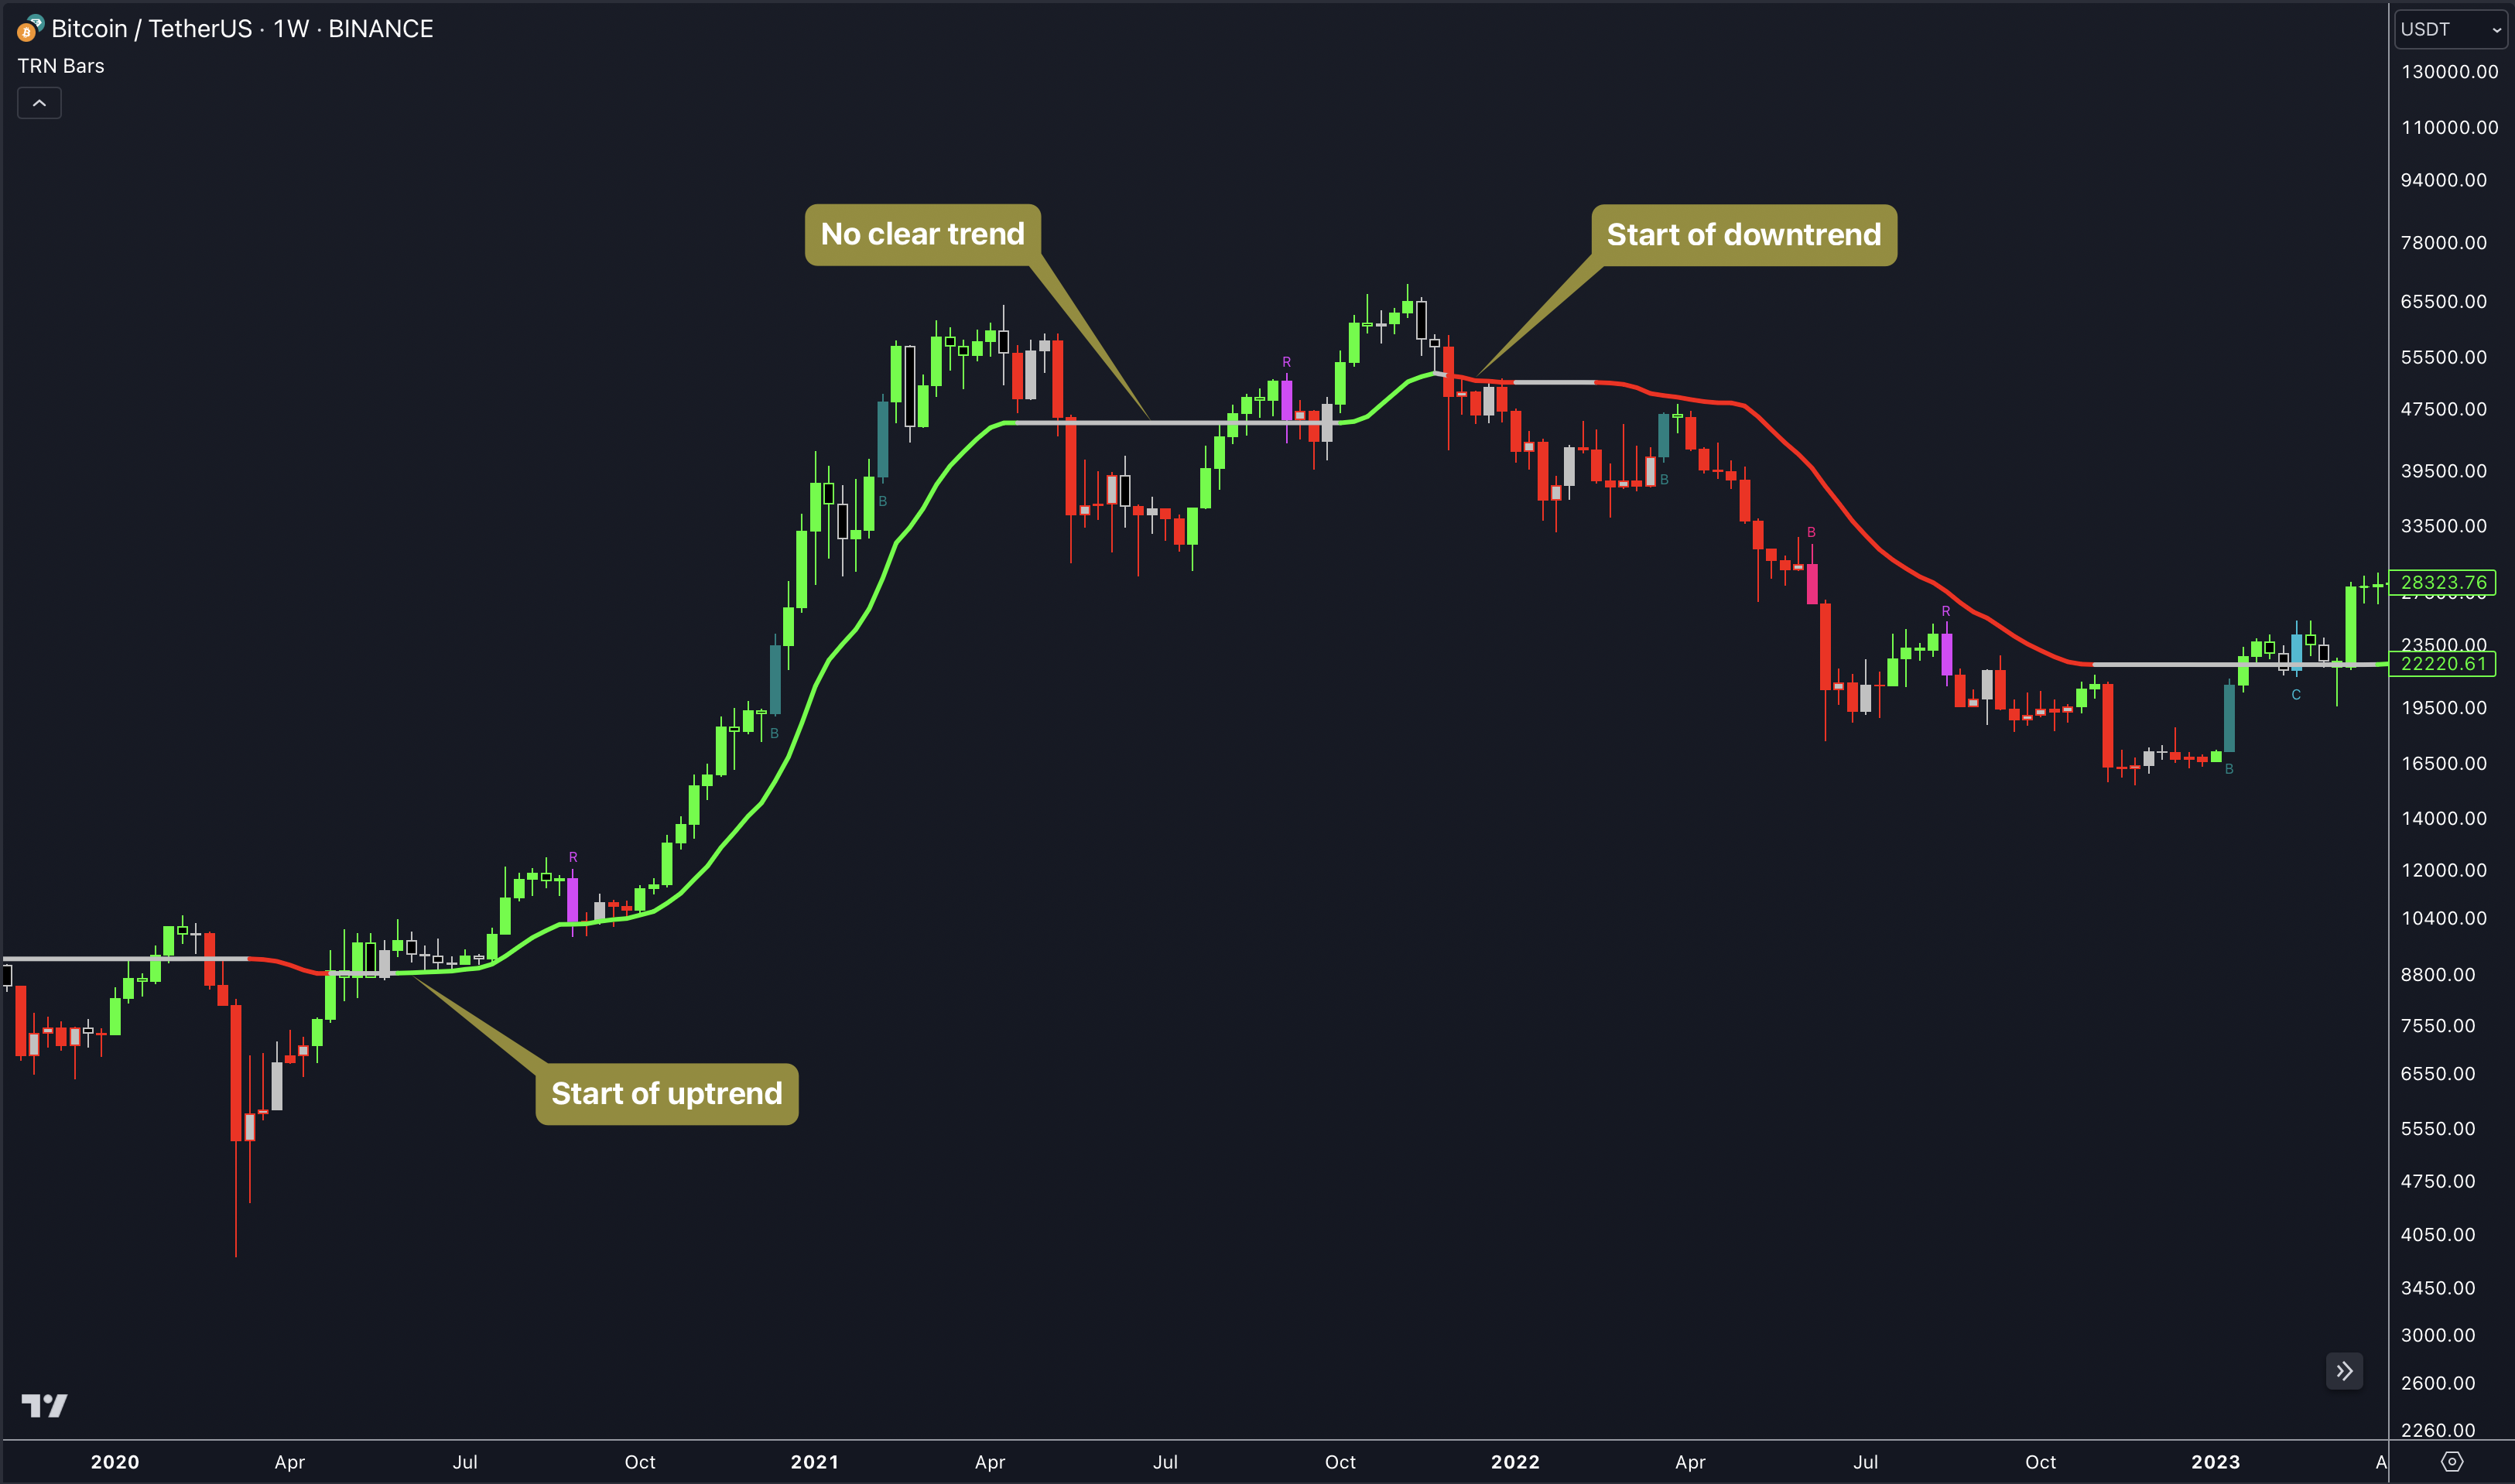
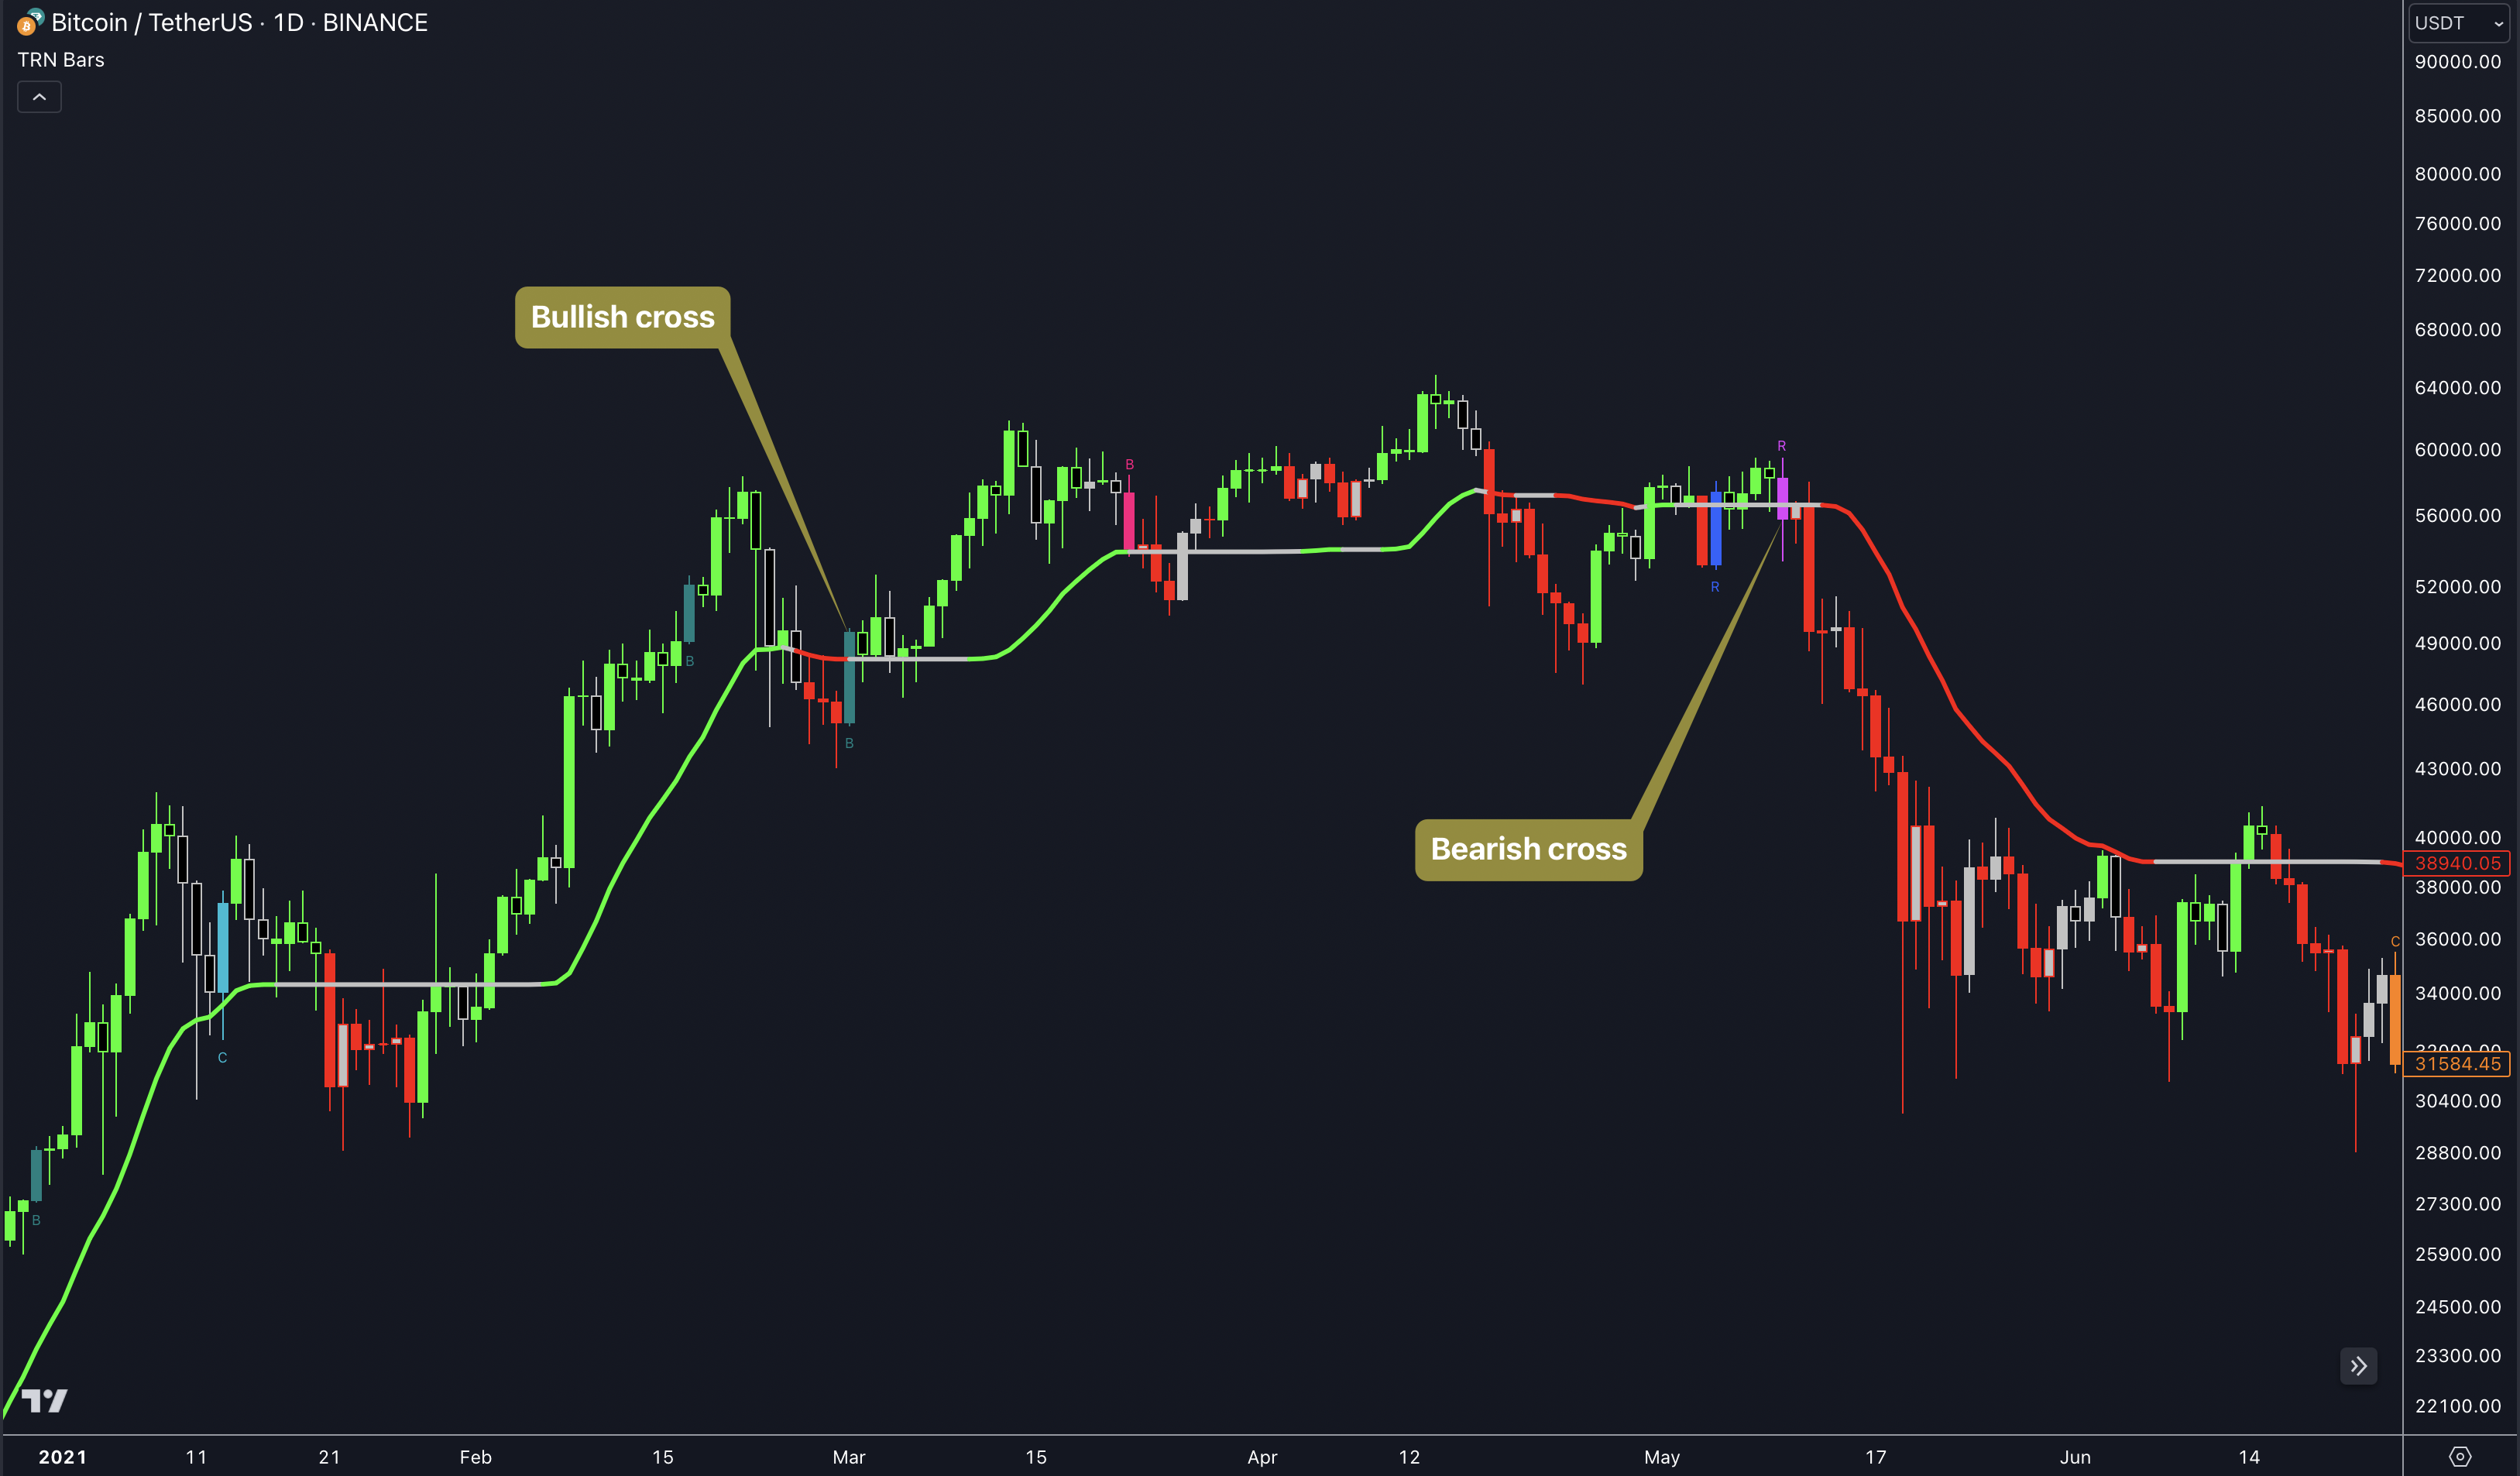
Like the ADXVMA, the Dynamic Trend can help traders identify the strength of a trend. Generally, a rising Dynamic Trend line, displayed in green, can indicate that an uptrend is strengthening, while a falling Dynamic Trend, displayed in red, suggests the trend may be weakening and a downtrend is strengthening. The Dynamic Trend turns gray when there is insufficient clarity to establish a distinct trend.
Identify potential trade entries and exits: When used in conjunction with price action, the Dynamic Trend can provide potential trade signals. For example, if the price crosses above the Dynamic Trend, it may be a bullish sign, suggesting a potential buy entry. Conversely, if the price crosses below the Dynamic Trend, it may indicate bearish conditions and a potential sell signal.
How To Use The Dynamic Trend In Trading:
Trend Identification
Observe the Dynamic Trend's color. When it's on the rise and appears green, it indicates a bullish trend. Conversely, if it's in decline and displayed in red, it signals a bearish trend. In the event of a bearish signal, such as a pattern breakdown or a bearish Signal Bar, and the Dynamic Trend is red, it provides additional confirmation to the bearish signal. Likewise, bullish signals gain added conviction when the Dynamic Trend is green.
Crossovers
As with other moving averages, crossovers between the Dynamic Trend and the price can be significant.
Price crossing above Dynamic Trend: This can be considered a bullish signal.
Price crossing below Dynamic Trend: This can be interpreted as a bearish signal.
If you currently hold a position, both bullish and bearish crossovers can serve as potential exit signals. For instance, in the case of a long position, a bearish crossover can indicate a potential shift in sentiment, signaling a bearish reversal and a potential opportunity to close your long position.
Filtering Noise:
Due to its adaptive nature, the Dynamic Trend can be a useful tool to filter out market noise. When the market is choppy or consolidating, the Dynamic Trend tends to remain flat and colored gray, signaling traders to potentially stay out of trades.
Stop Losses:
The Dynamic Trend can also be used as a dynamic stop loss. For instance, in a long trade, traders can use the Dynamic Trend as a trailing stop, selling their position if the price crosses below the Dynamic Trend.
How To Use TRN Bars
Reversals And Continuations
If you are already in a position, a reversal bar can be a buy or sell signal to close the position. A continuation bar, on the other hand, can be a signal for the possibility of increasing a position. Breakout bars can also serve as both a reversal and continuation signal for an existing position, depending on the direction of the breakout.
Especially on High timeframes, like on the daily or weekly, reversal and continuation signals from the TRN Bars can have favorable odds for success.
Breakout Conditions And Entry Signals
The versatility of TRN Bars extends beyond their individual functionality. They also act as breakout conditions for several of our chart patterns, including Harmonic Patterns Suite and Consolidation And Range Pattern. When combined with other signals, such as those from SMT/Divergence Suite, the Signal Bars provide valuable entry signals for setups with highly favorable odds. By integrating these multiple indicators, traders can enhance their trading strategies and increase the likelihood of successful trades. The synchronized collaboration of TRN Bars with other TRN tools enables traders to seize opportunities with greater confidence and accuracy.
Check out our Combinations section to learn about all the possible setups with the TRN Bars in combination with other TRN Tools like Swing Suite or SMT/Divergence Suite.
Monitor Your Trades With the TRN Bars
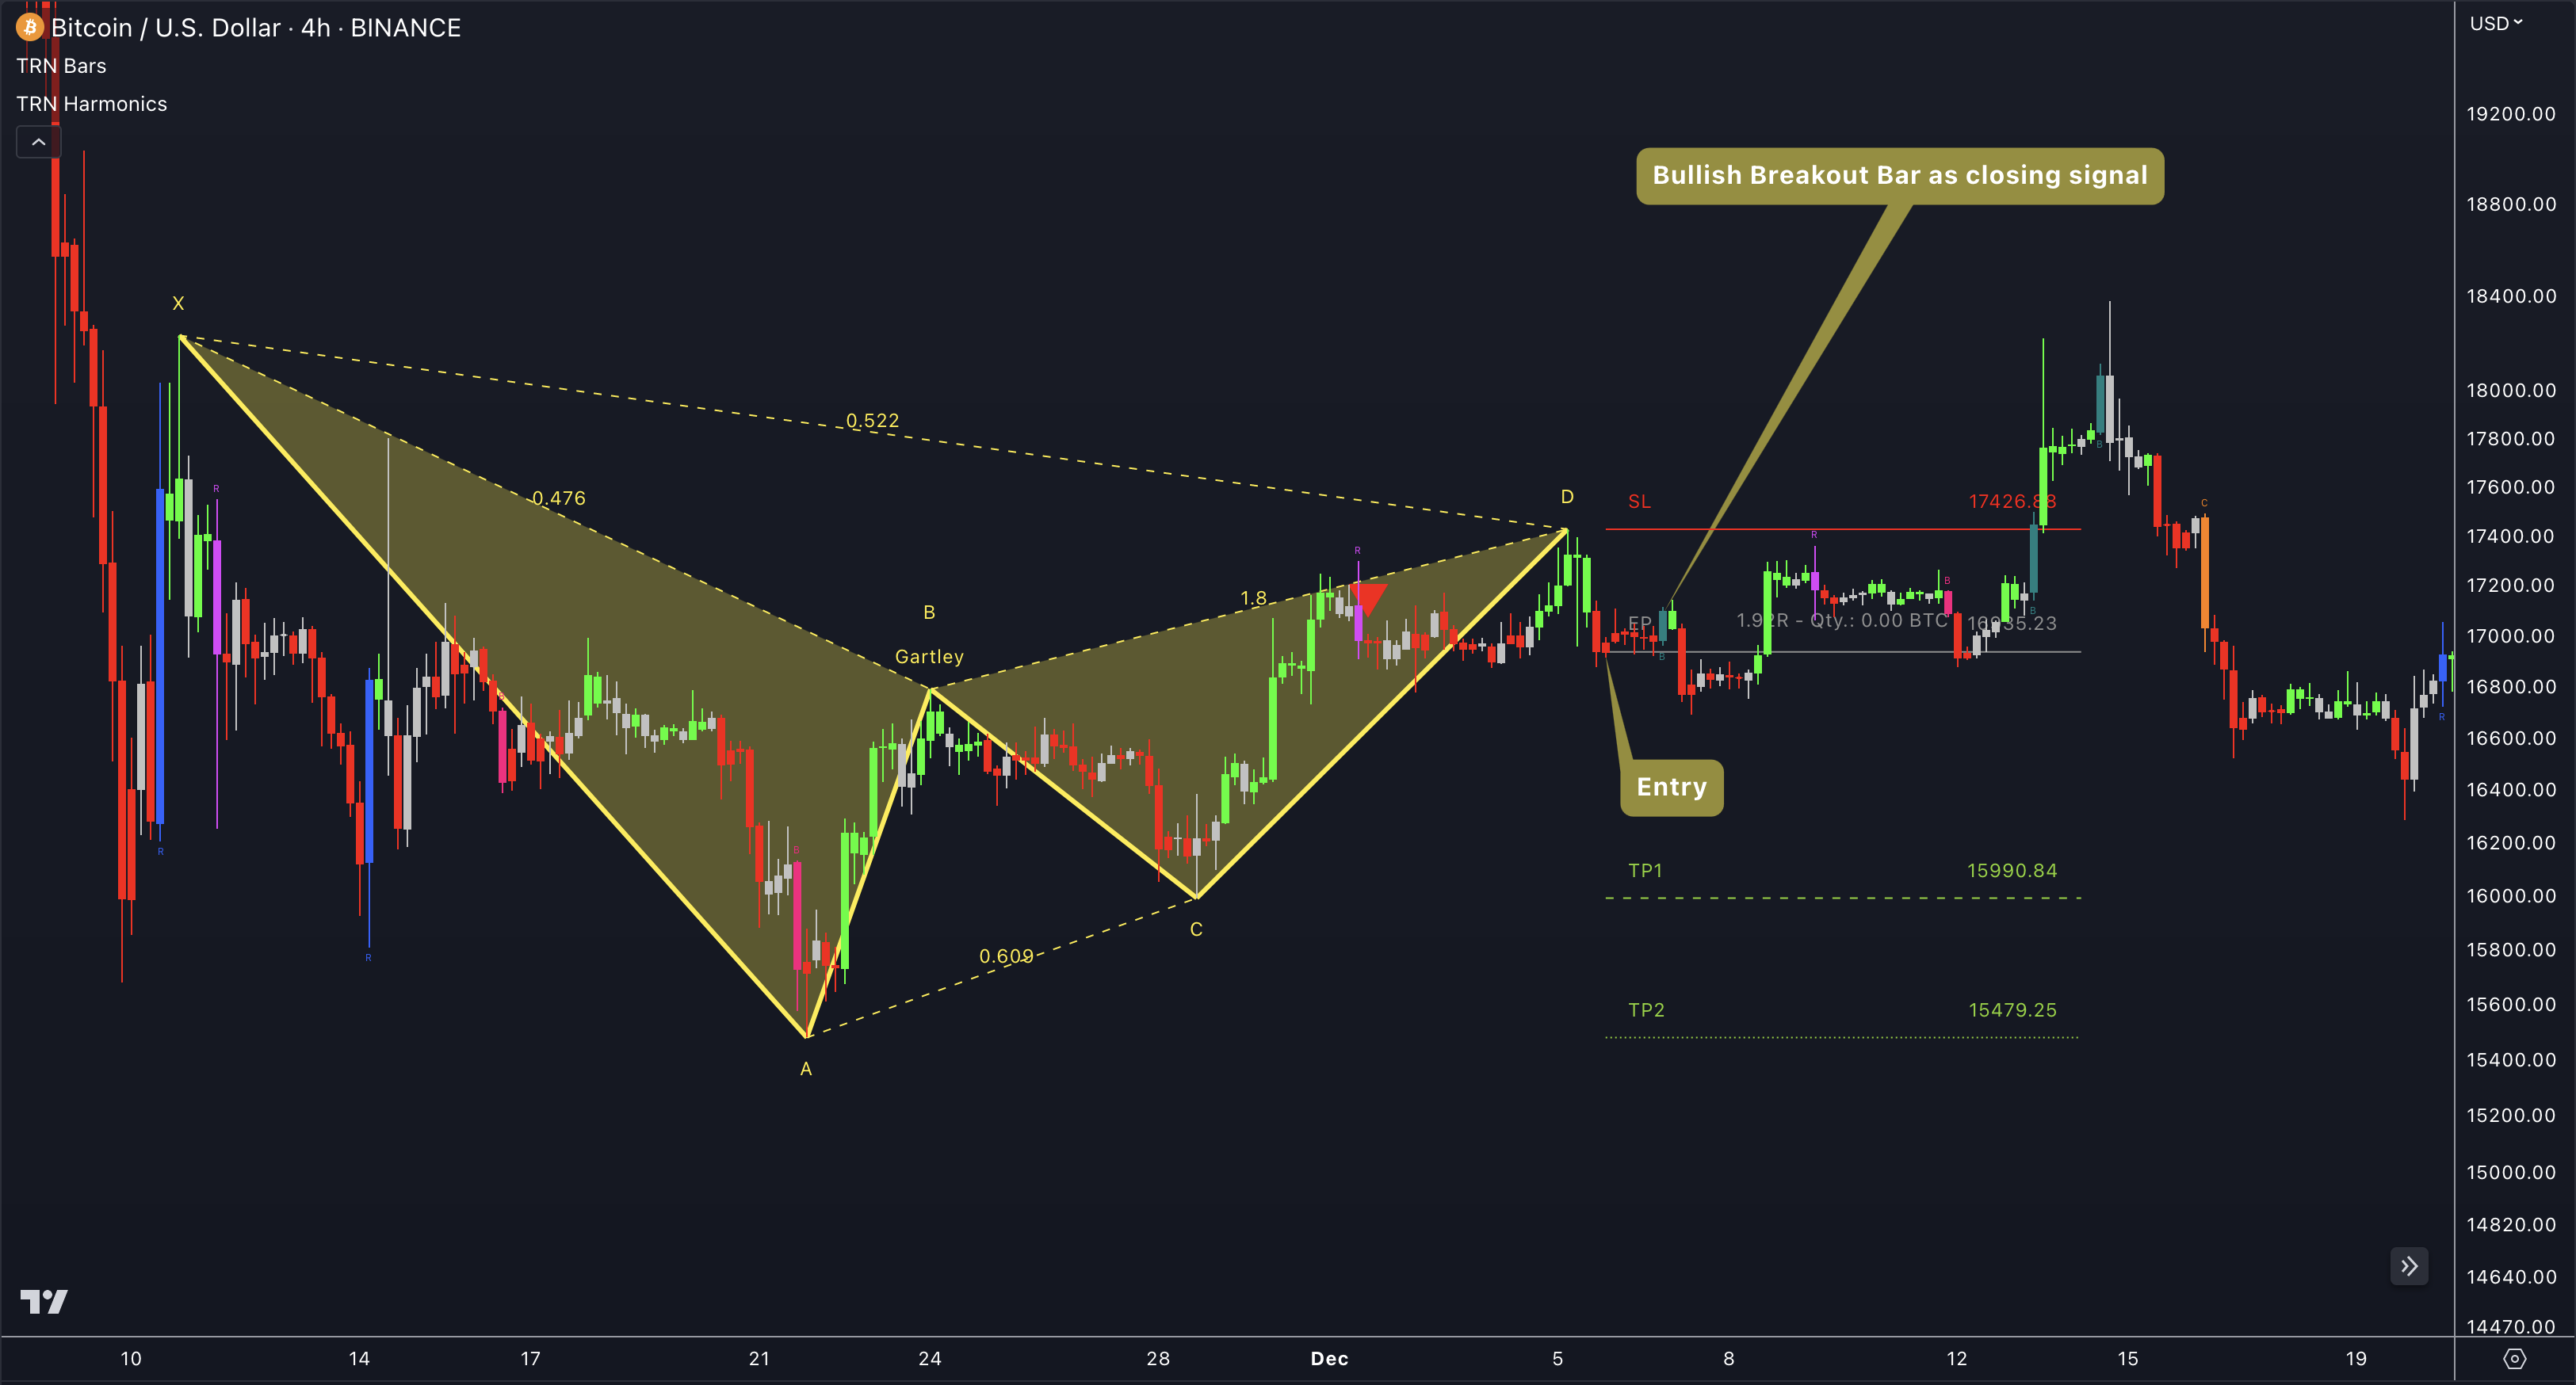
When you find yourself holding a position following a confirmed breakout from a TRN chart pattern, the presence of Signal Bars becomes instrumental in determining whether you should maintain your trade or consider closing your position.
If you happen to be in a short position, similar to the example provided, subsequent to a pattern breakdown, it is crucial to monitor the emergence of bullish Signal Bars, such as the blue reversal bars. In the case of being in a long position, it is of utmost importance to closely observe the appearance of bearish Signal Bars, such as the pink reversal bars.
These bars signify a potential shift in the prevailing trend and can act as an exit signal, particularly if they manifest frequently or coincide with significant support or resistance zones. Keeping a keen eye on these Signal Bars enables you to make well-timed decisions regarding the continuation or closure of your trade.
In the provided illustration, a breakout from a TRN Gartley pattern on the BTC/USD 4-hour chart was confirmed. Following the entry point, a price range materialized, ultimately breaking upwards towards the end. In this particular scenario, the confirmed bullish breakout bar would have served as the signal to close the position, effectively avoiding a larger loss. Closing the position at that point would have prevented the pattern from subsequently triggering the stop-loss, thus minimizing potential losses.
Discover the power of our TRN Bars Alerts! Stay informed effortlessly as they notify you of trend changes, signal bar occurrences or confirmations, and even detect range breakouts. Delve into our dedicated TRN Bars Alerts section to master their effective usage.
While signals from TRN Bars and TRN Chart Patterns can be informative, it is important to recognize that their reliability may vary. Various external factors can impact market prices, and it is essential to consider your risk tolerance and investment goals when executing trades.