Swing Suite
The Swing Suite is a technical analysis tool used to identify and highlight swings or significant price movements in a market. It helps traders visualize the price action and identify key turning points or trends in the market. It also has an integrated divergence detector that looks for bullish and bearish divergences on up to 12 different oscillators and highlights them in color.
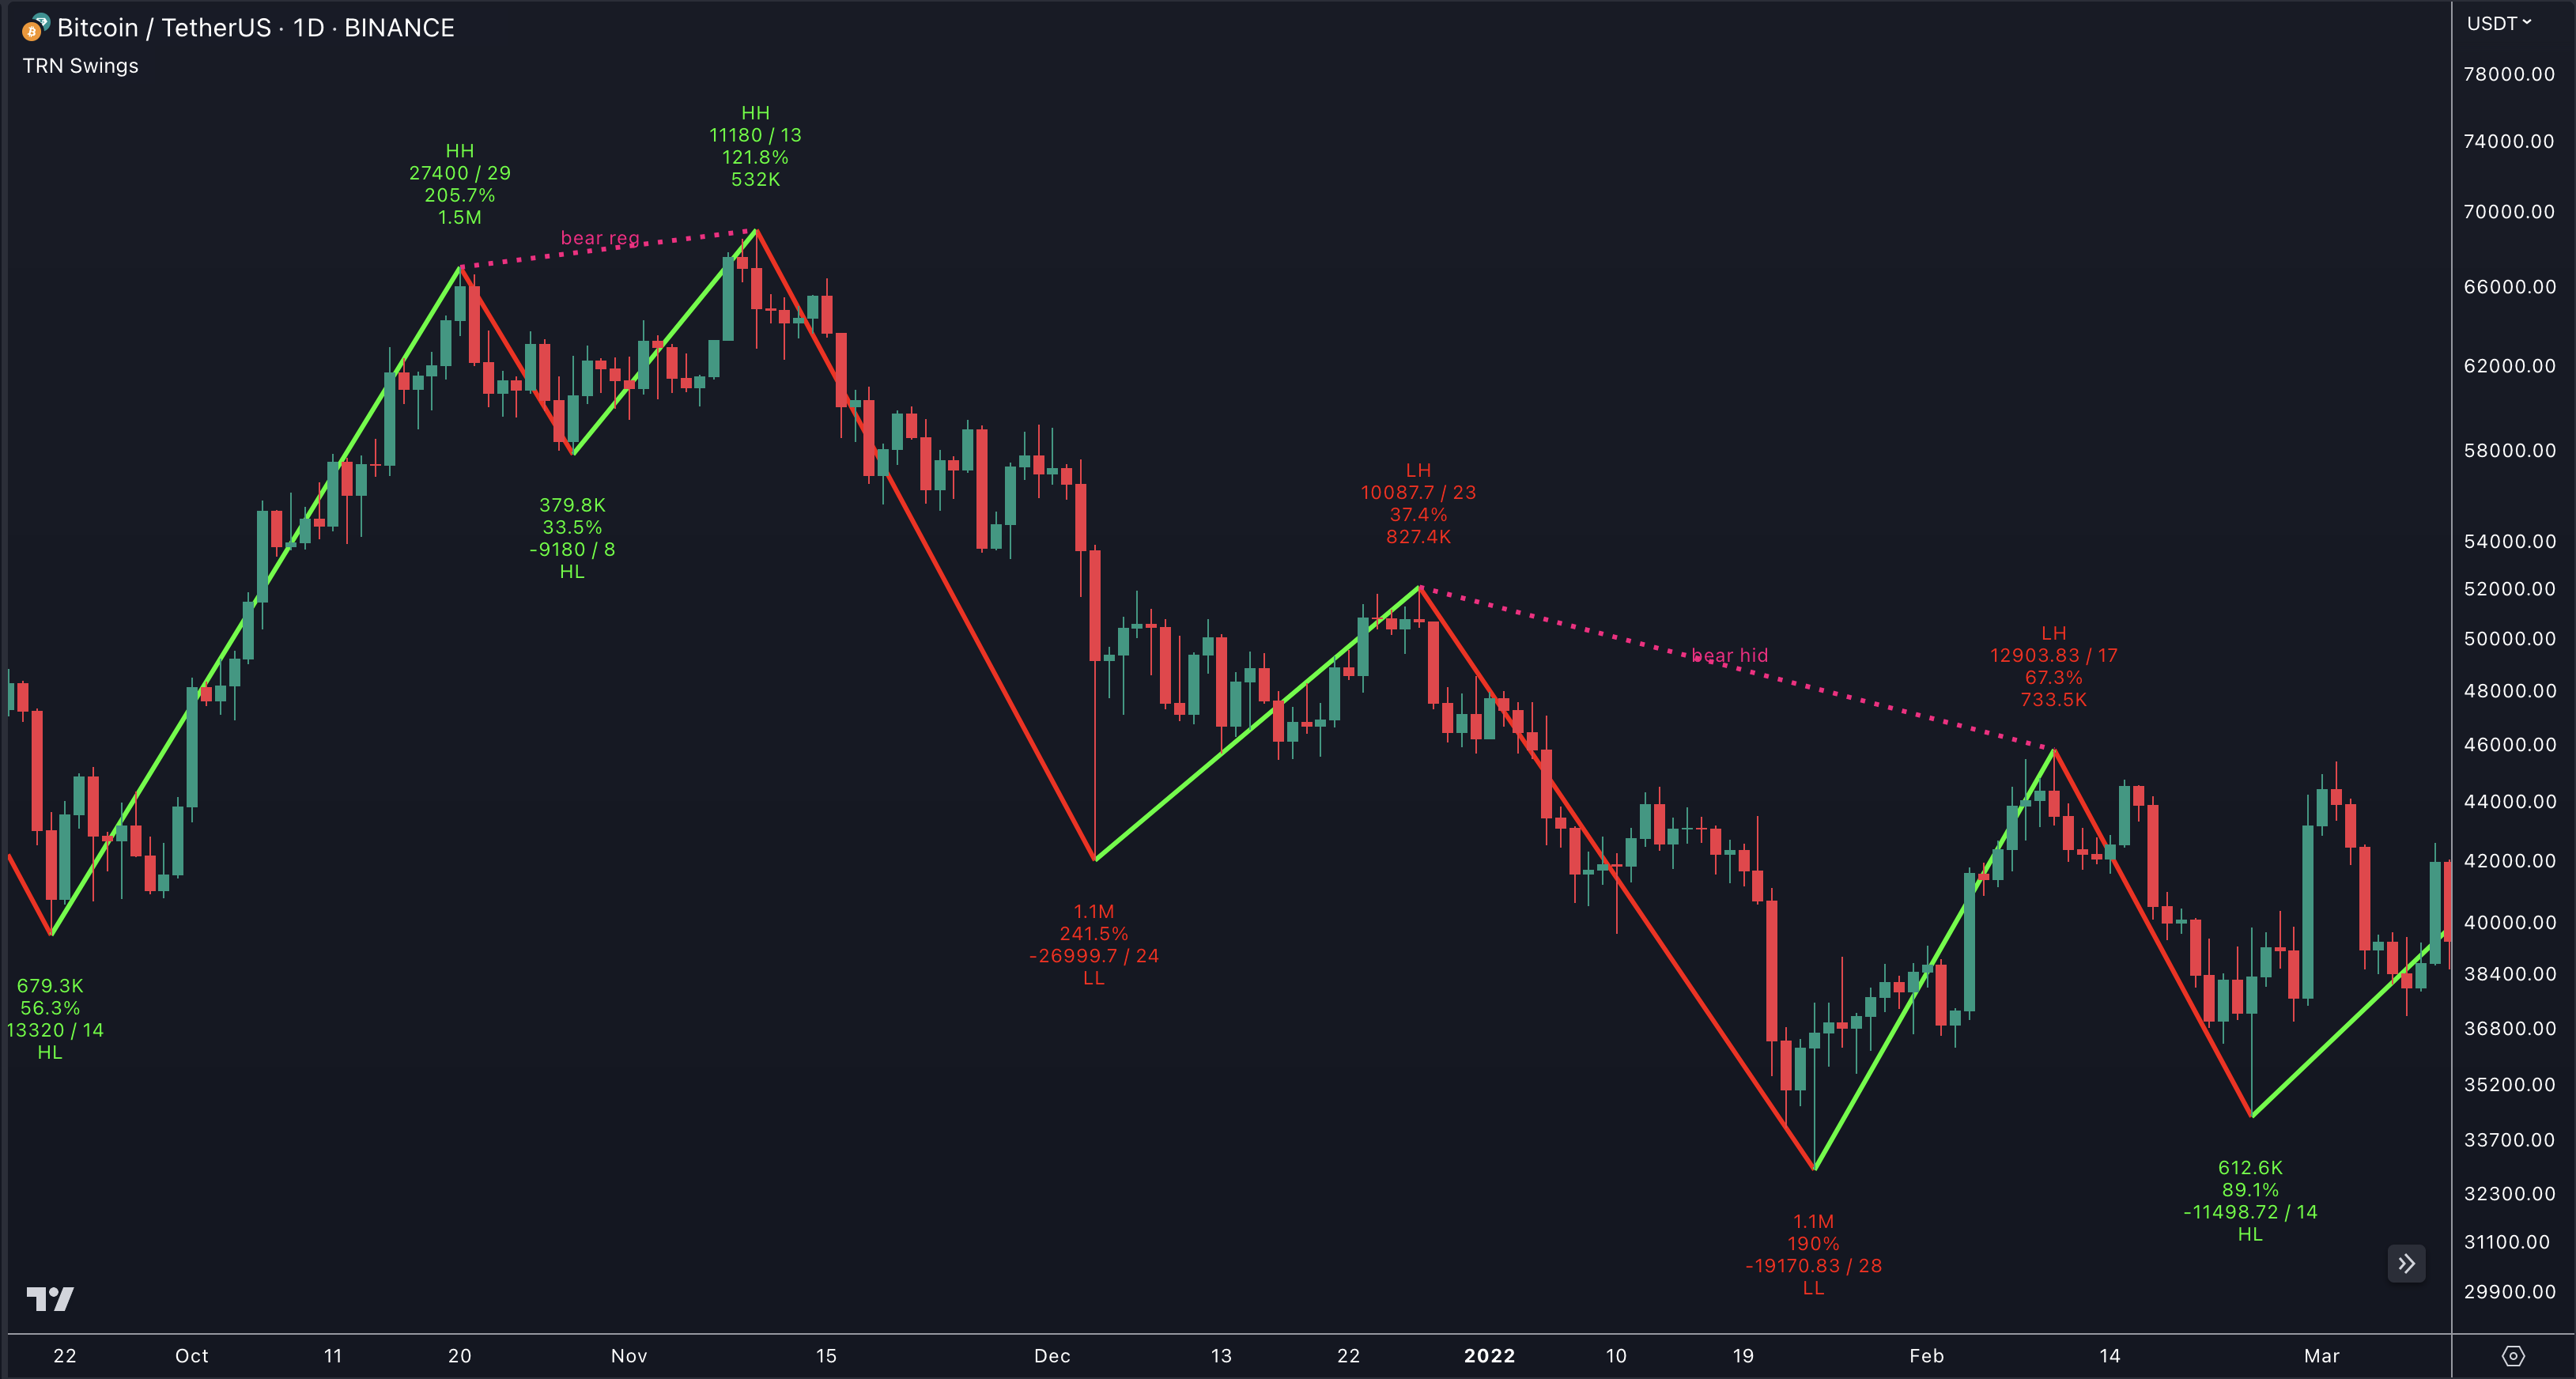
The Swing Suite is based on the concept of swings, which are defined as the successive higher highs (HH) and higher lows (HL) in an uptrend or the successive lower highs (LH) and lower lows (LL) in a downtrend. These swings represent the natural ebb and flow of price movement and can provide valuable information about the overall market structure and trend direction.
How Does Swing Suite Work?
The indicator typically plots lines or markers on a price chart to indicate the swings. It marks the swing highs (peaks) and swing lows (troughs) to create a visual representation of the price movement.
Here are some key features and uses of SMT/Divergence Suite:
Swing Highs And Lows
The indicator identifies and marks the swing highs and lows on a price chart, allowing traders to visually see the turning points in the market. Swing highs are peaks where the price temporarily stops rising and starts declining, while swing lows are troughs where the price temporarily stops falling and starts rising.
Trend Identification
By connecting the swing highs and lows, traders can identify and analyze the prevailing trend in the market. An uptrend is characterized by higher swing highs and higher swing lows, while a downtrend is characterized by lower swing highs and lower swing lows. The indicator helps traders visually assess the strength and continuity of the trend.
Support And Resistance Levels
The swing highs and lows can act as support and resistance levels. Swing highs may act as resistance levels where selling pressure increases, while swing lows may act as support levels where buying pressure increases. Traders often pay attention to these levels as potential areas for trade entries, exits, or placing stop-loss orders.
Pattern Recognition
The swings identified by the indicator can help traders recognize chart patterns, such as double tops, double bottoms, head and shoulders, or triangles. These patterns can provide insights into potential trend reversals or continuation patterns.
Trade Entry And Exit
Traders may use TRN Swing to determine potential trade entry and exit points. For example, in an uptrend, traders may look for opportunities to enter long positions near swing lows or on pullbacks to support levels. Conversely, in a downtrend, traders may consider short positions near swing highs or on retracements to resistance levels.
It's important to note that Swing Suite is a visual tool and does not provide specific buy or sell signals. It serves as a guide for traders to analyze the price structure and make informed trading decisions based on their trading strategy and additional technical analysis techniques as for example our TRN Chart Patterns or the TRN Bars.
Divergence Detector
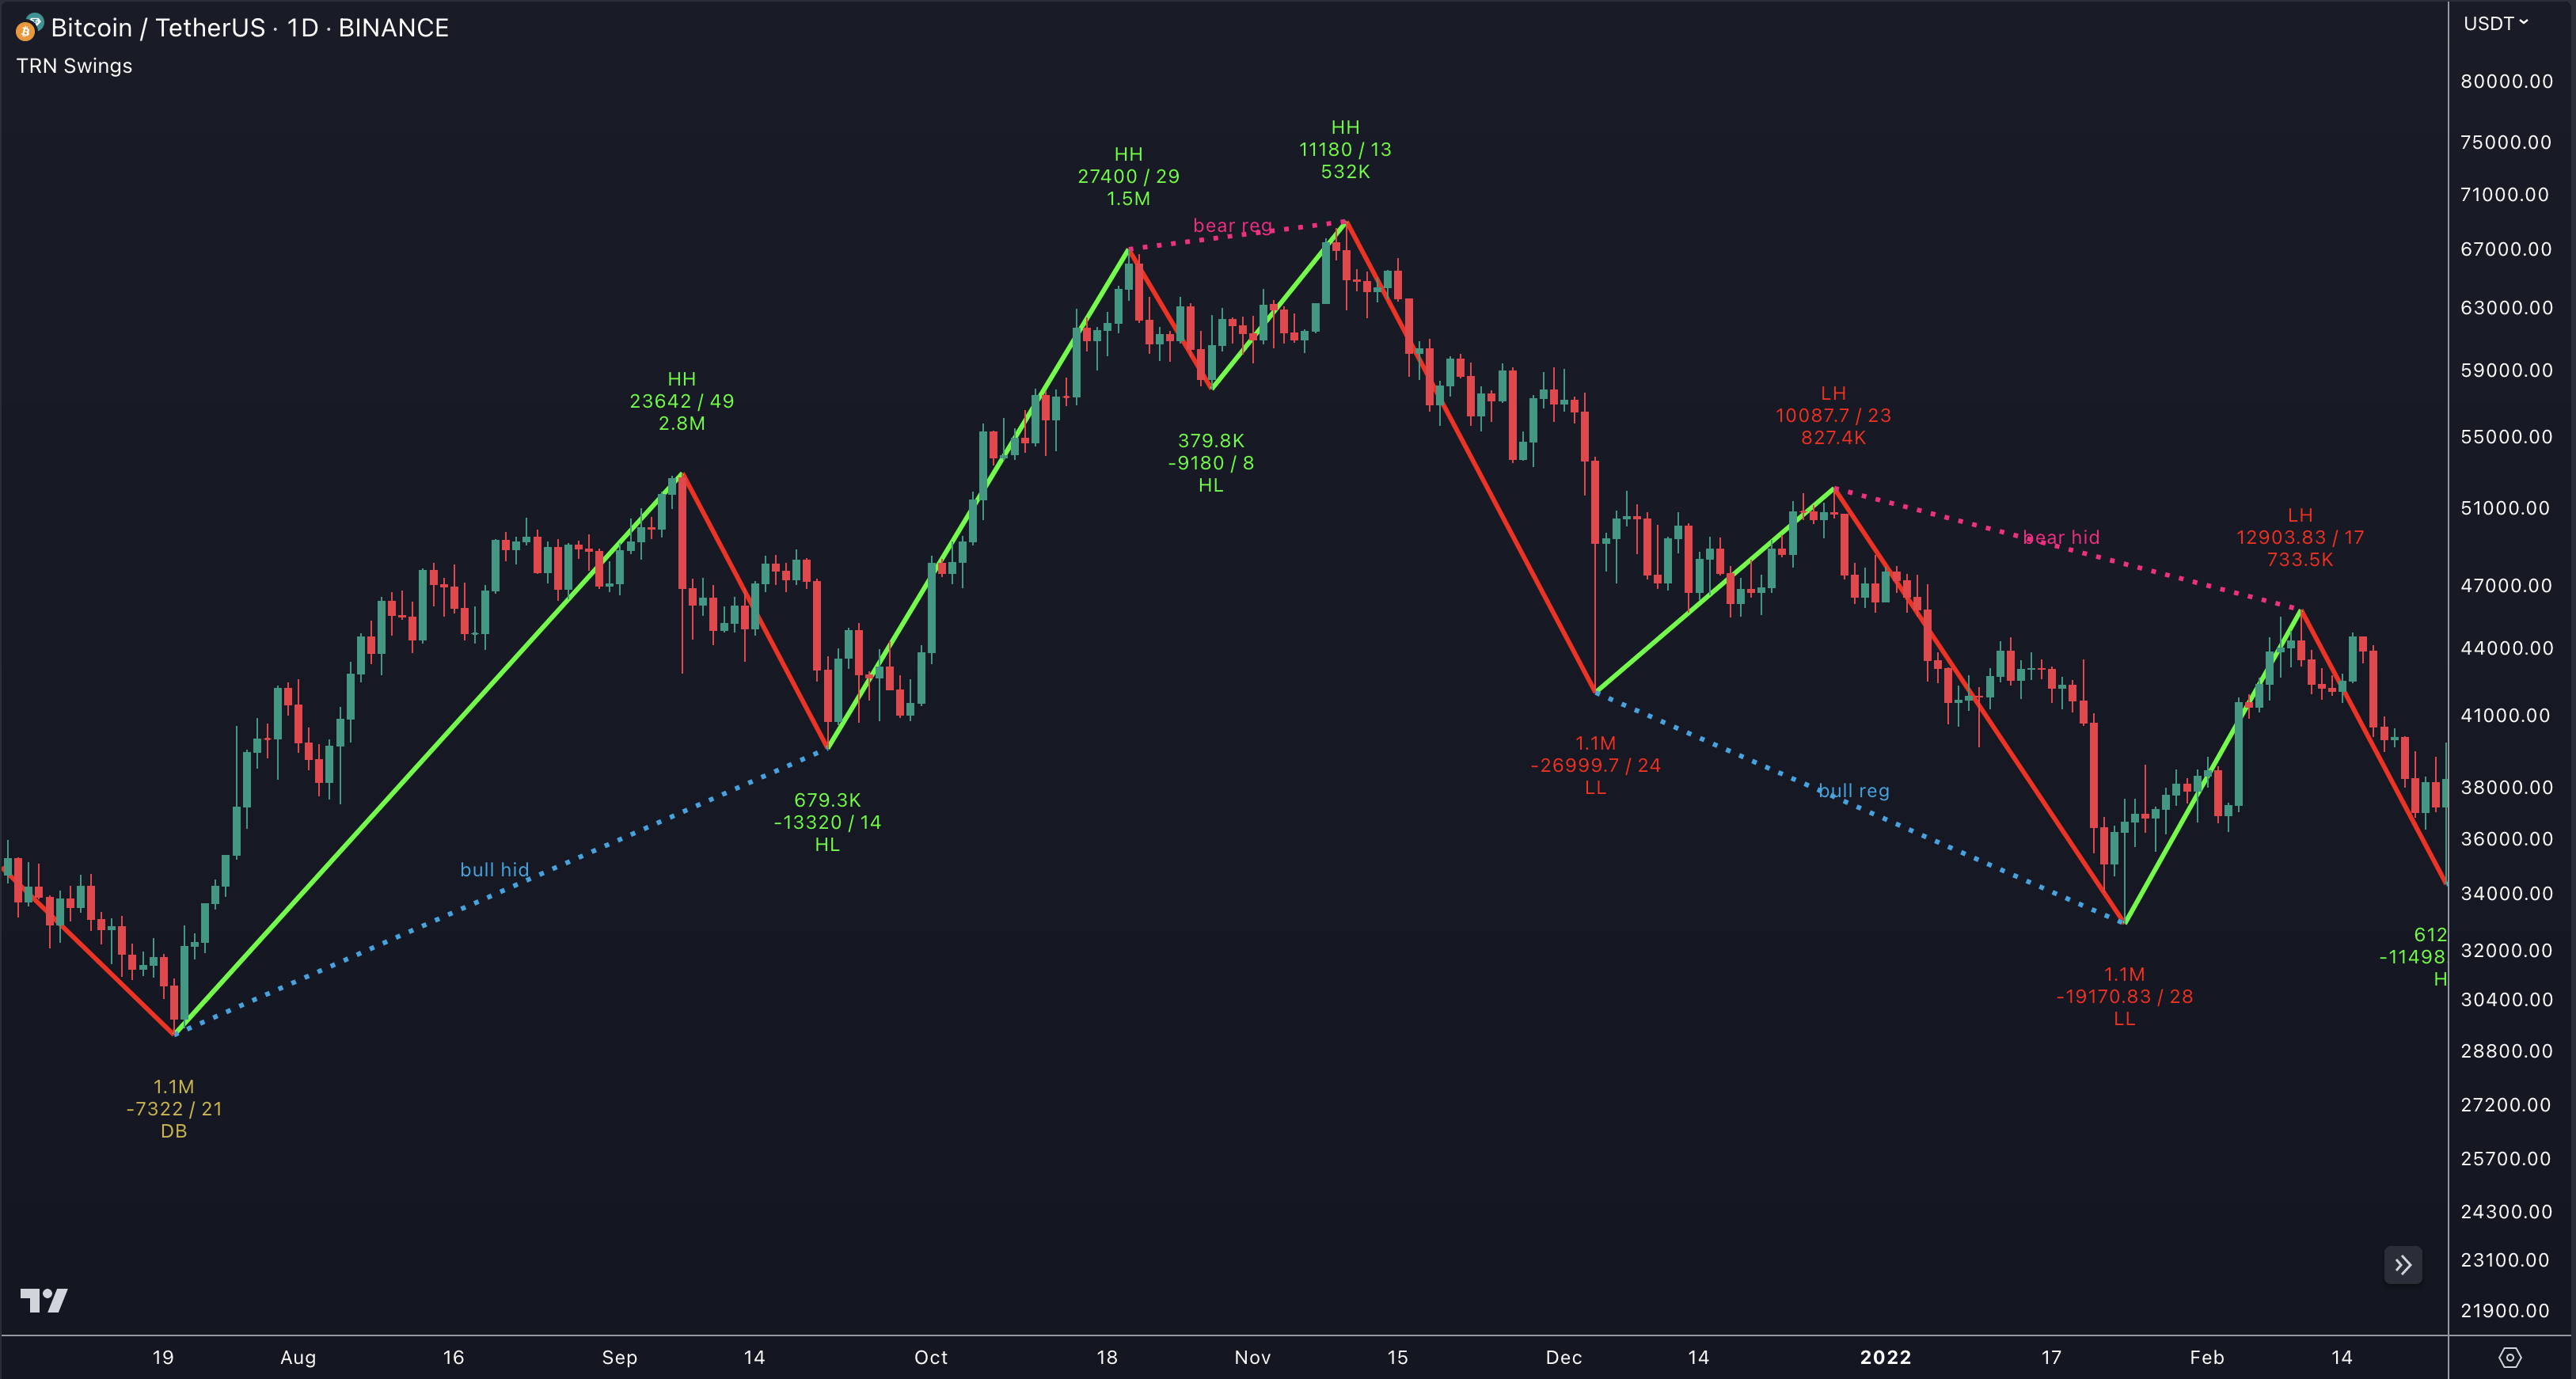
The build in divergence detector operates by comparing an asset's price against its technical indicators, like the Relative Strength Index (RSI) or Moving Average Convergence Divergence (MACD) and deftly marking disparities with vividly colored lines. Bullish divergences are distinguished with luminous blue lines, while bearish divergences are denoted by striking red lines.
Setup Divergence Detector
Go to indicator settings (1) and choose one of our build in divergence indicators under the section "Divergence Detection" of the menu item "Inputs" (2), like for example the Awesome Oscillator (AO) (3). A selection of 11 distinct indicators is at your disposal to contrast with the price.
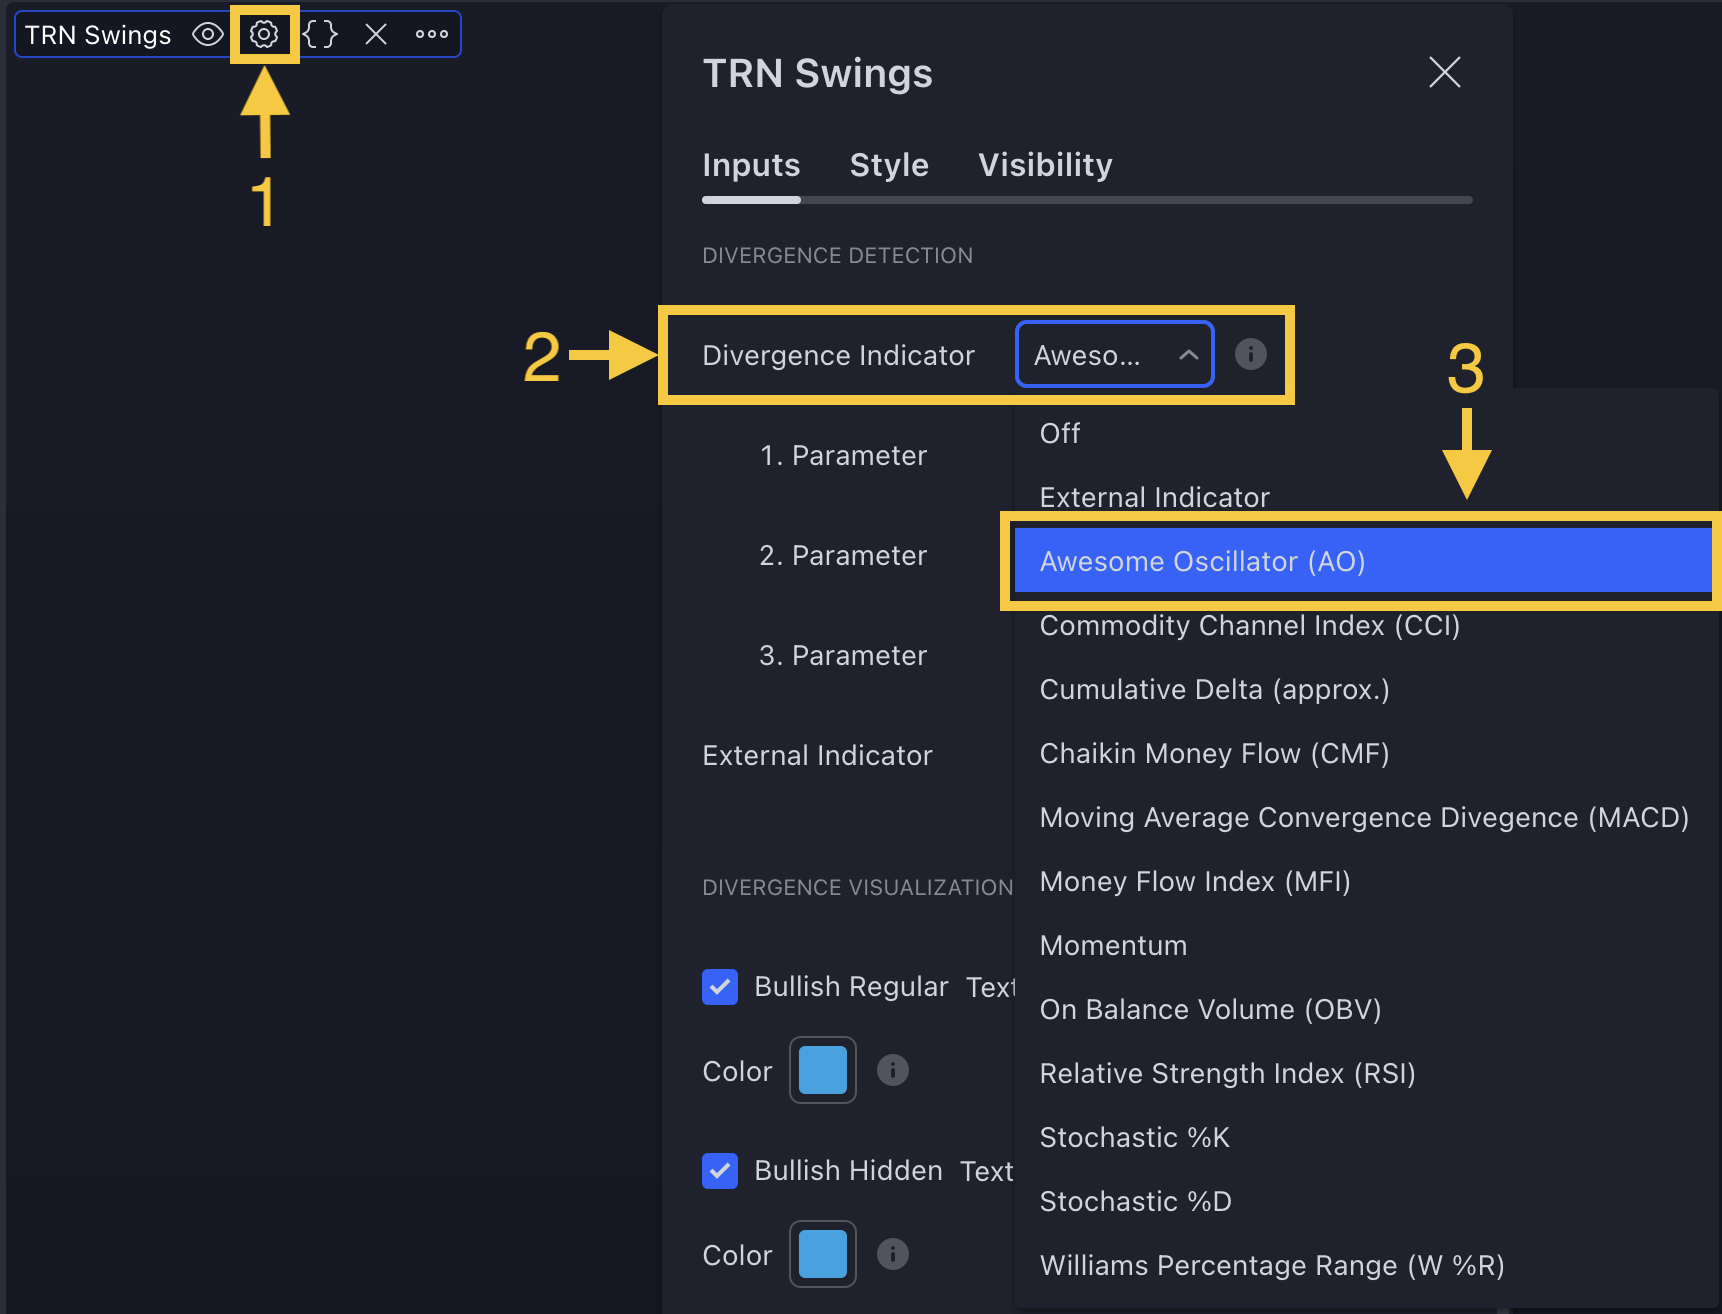
The 11 divergence indicators are the same ones build in our tool SMT/Divergence Suite. Visit our 12 Oscillators And Just One Tool section to learn more about them.
If you use the default settings of SMT/Divergence Suite, the Awesome Oscillator (AO) will be the first oscillator you see when you add our tool to your chart.
How To Use Divergence Detector
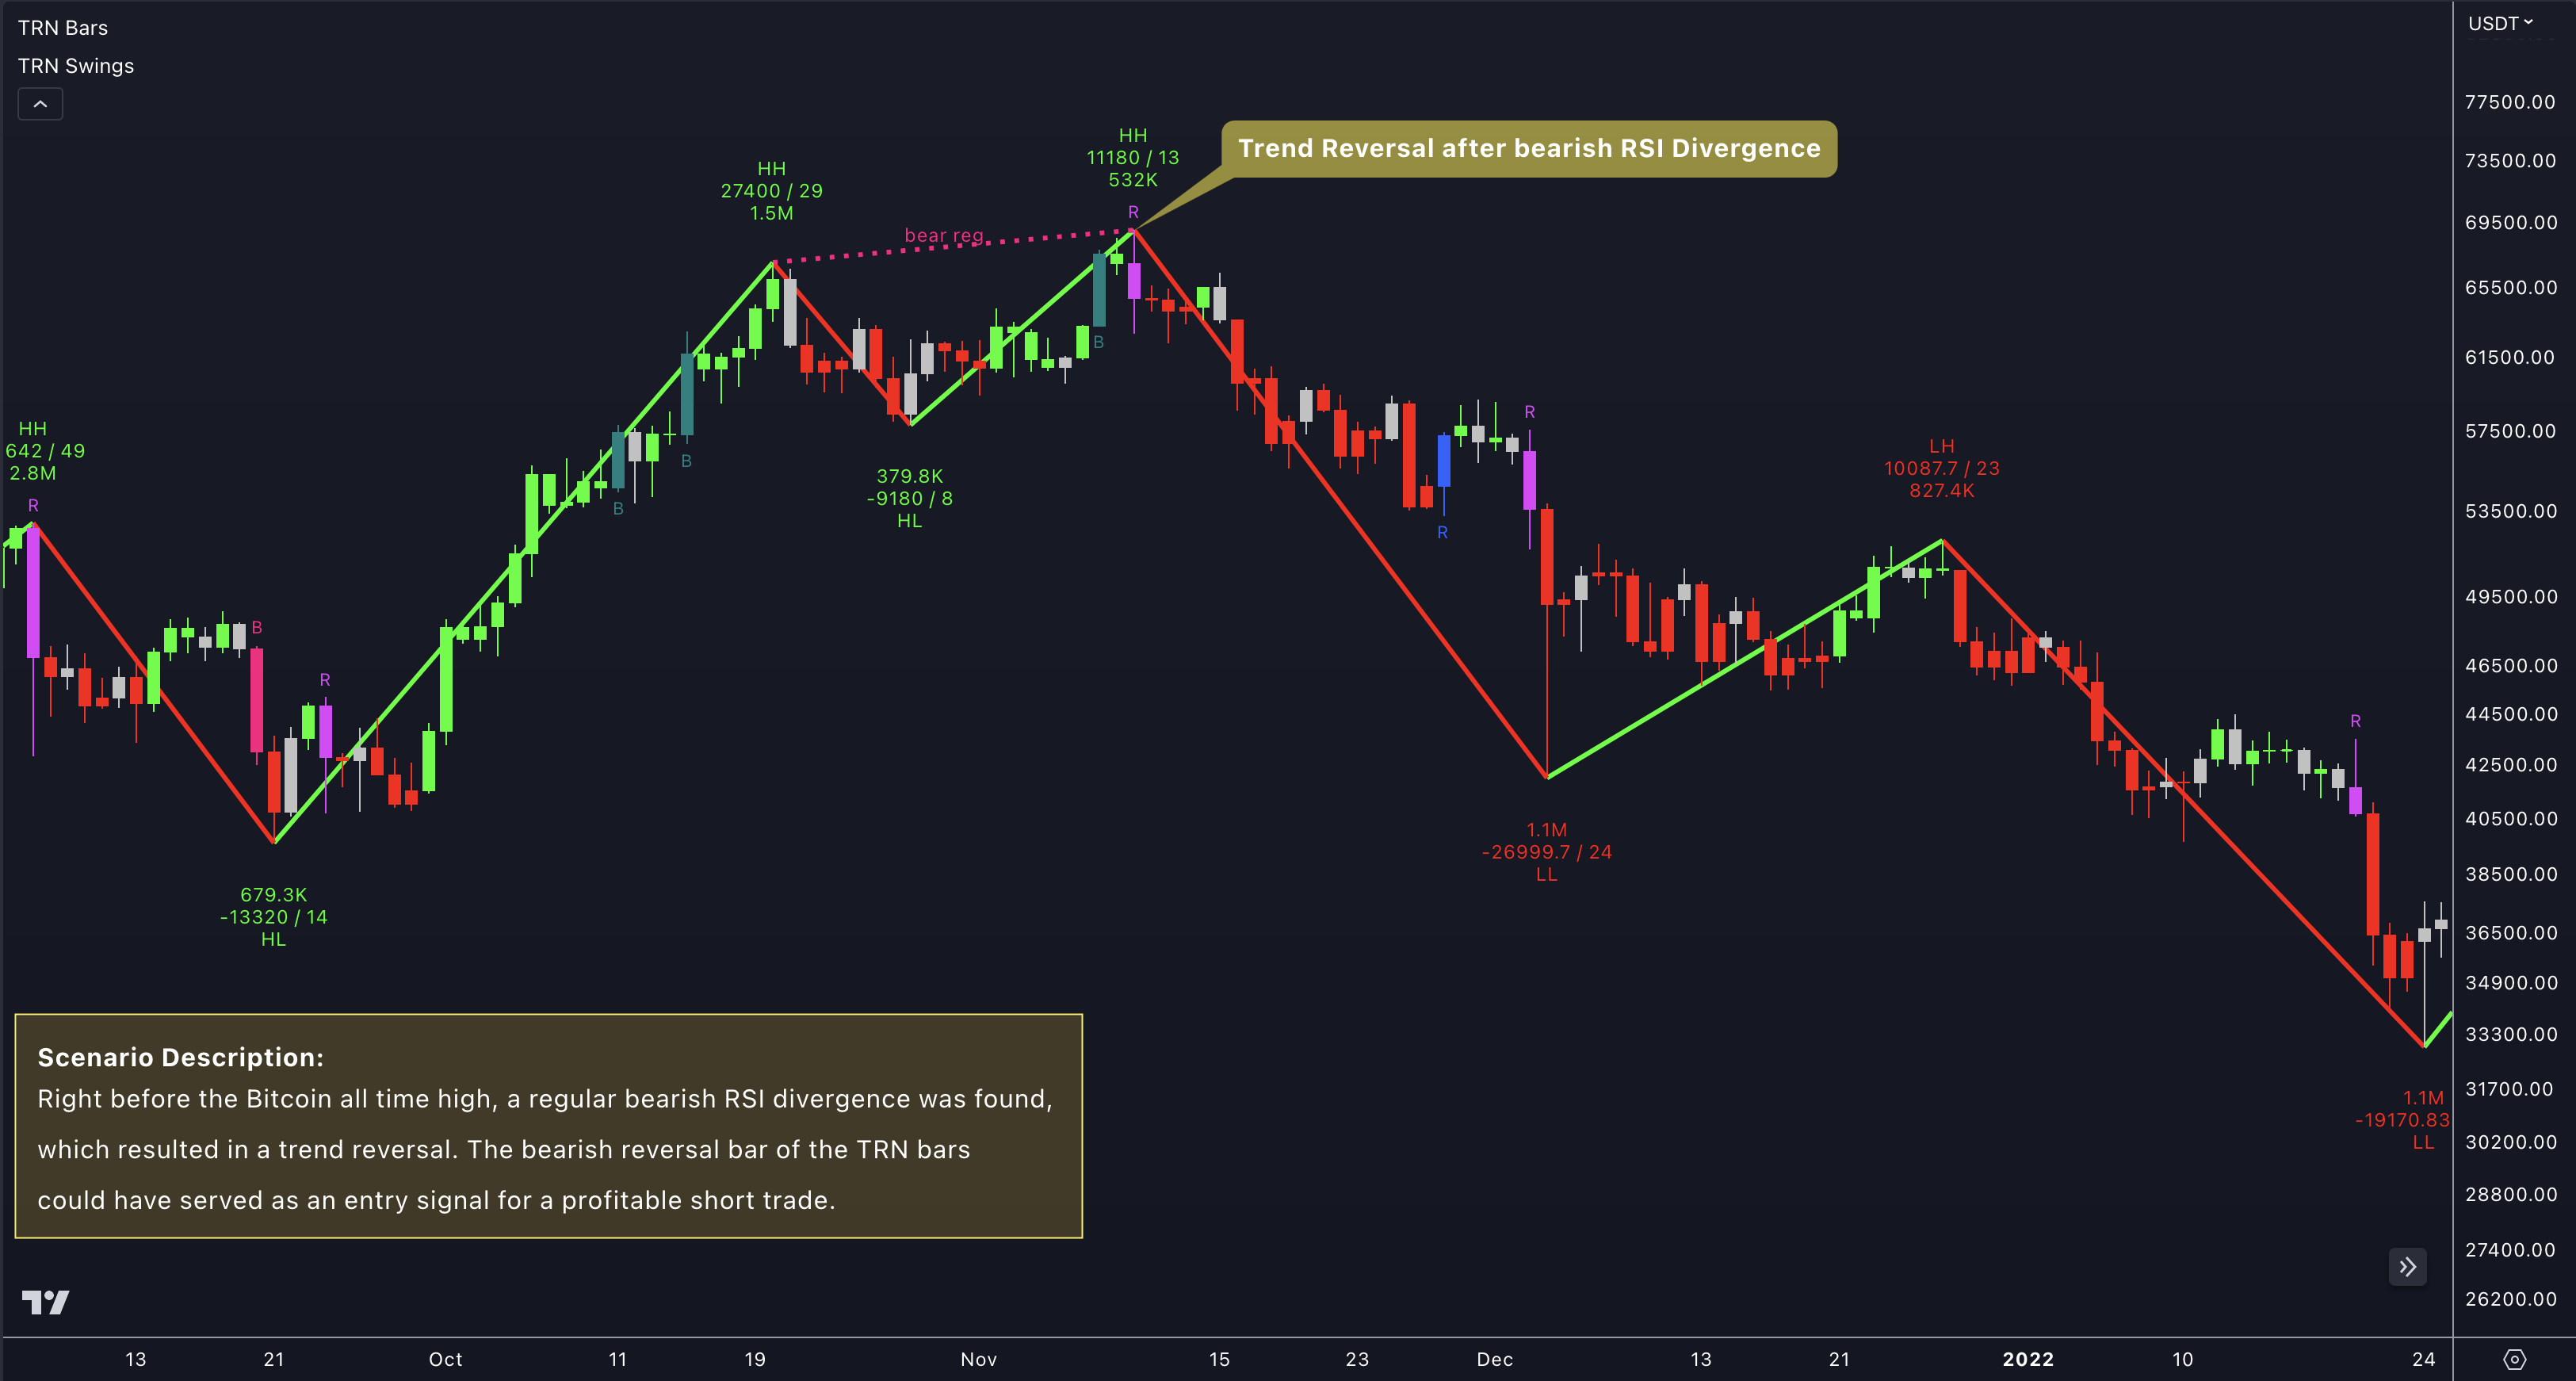
Upon detecting a divergence, the colored lines acts as a visual indicator for traders, signaling an imminent possibility of a trend reversal. In response, traders can leverage this valuable insight to make informed decisions in their trading activities. For instance, they may choose to enter or exit a trade based on signals obtained from the TRN Bars (see figure below) or any of the TRN Chart Patterns, thus optimizing their trading strategies.
Combine Swing Suite with other technical indicators, like the TRN Chart Patterns, and risk management techniques to gain a comprehensive understanding of the market and improve their trading accuracy. Visit our Combinations section to see possible combinations with Swing Suite and it's build in divergence detector.
Statistics
Unveil the untapped potential of the advanced Swing Statistics! Gain invaluable insights into historical swings and turning points that will revolutionize your trading approach. Elevate your expertise by harnessing this treasure trove of data to supercharge signal reliability, while masterfully planning stop loss and take profit strategies with unrivaled accuracy.
Swing Suite empowers you with a roadmap of past occurrences, guiding you towards future prosperity. Embrace the cutting-edge technology that paves the way for enhanced trading proficiency.
How To Setup Swing Statistics
To configure Swing Statistics, follow these simple steps:
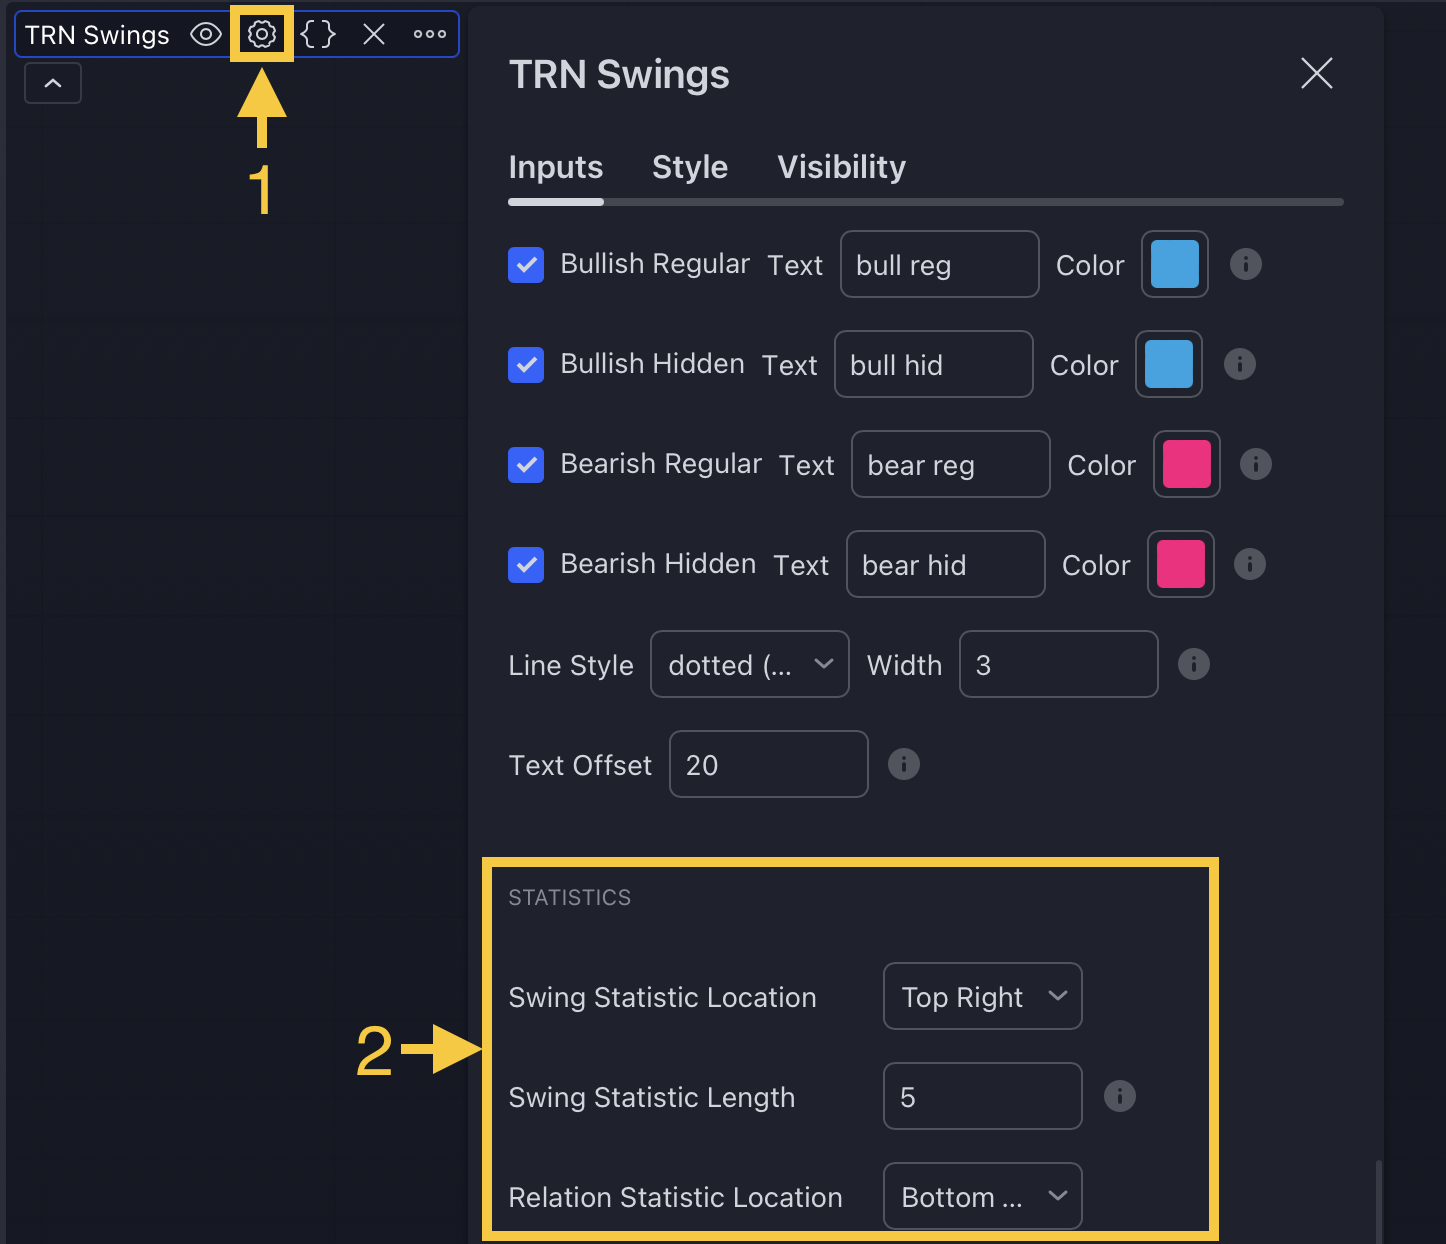
- Access the indicator settings (1).
- Scroll down to the "Statistics" section (2).
- Within this section, you have the option to adjust the Length of the Swing Statistic. By default, it is set to 5 swings. This value determines the number of past swings considered when calculating the average swing length.
Make sure to customize the Length according to your preferences to obtain the most relevant and accurate swing analysis for your trading needs.
Furthermore, you have the flexibility to select the Location of the Swing Statistic and the Relation Statistic on your chart. This enables you to customize the display to provide a perfect overview of all essential information at a glance. Tailor the chart layout according to your preferences, ensuring that the critical data is easily accessible and readily available for your trading decisions.
How To Read Statistics
Within Swing Suite lie two powerful statistics, each offering distinct insights to empower your trading prowess.
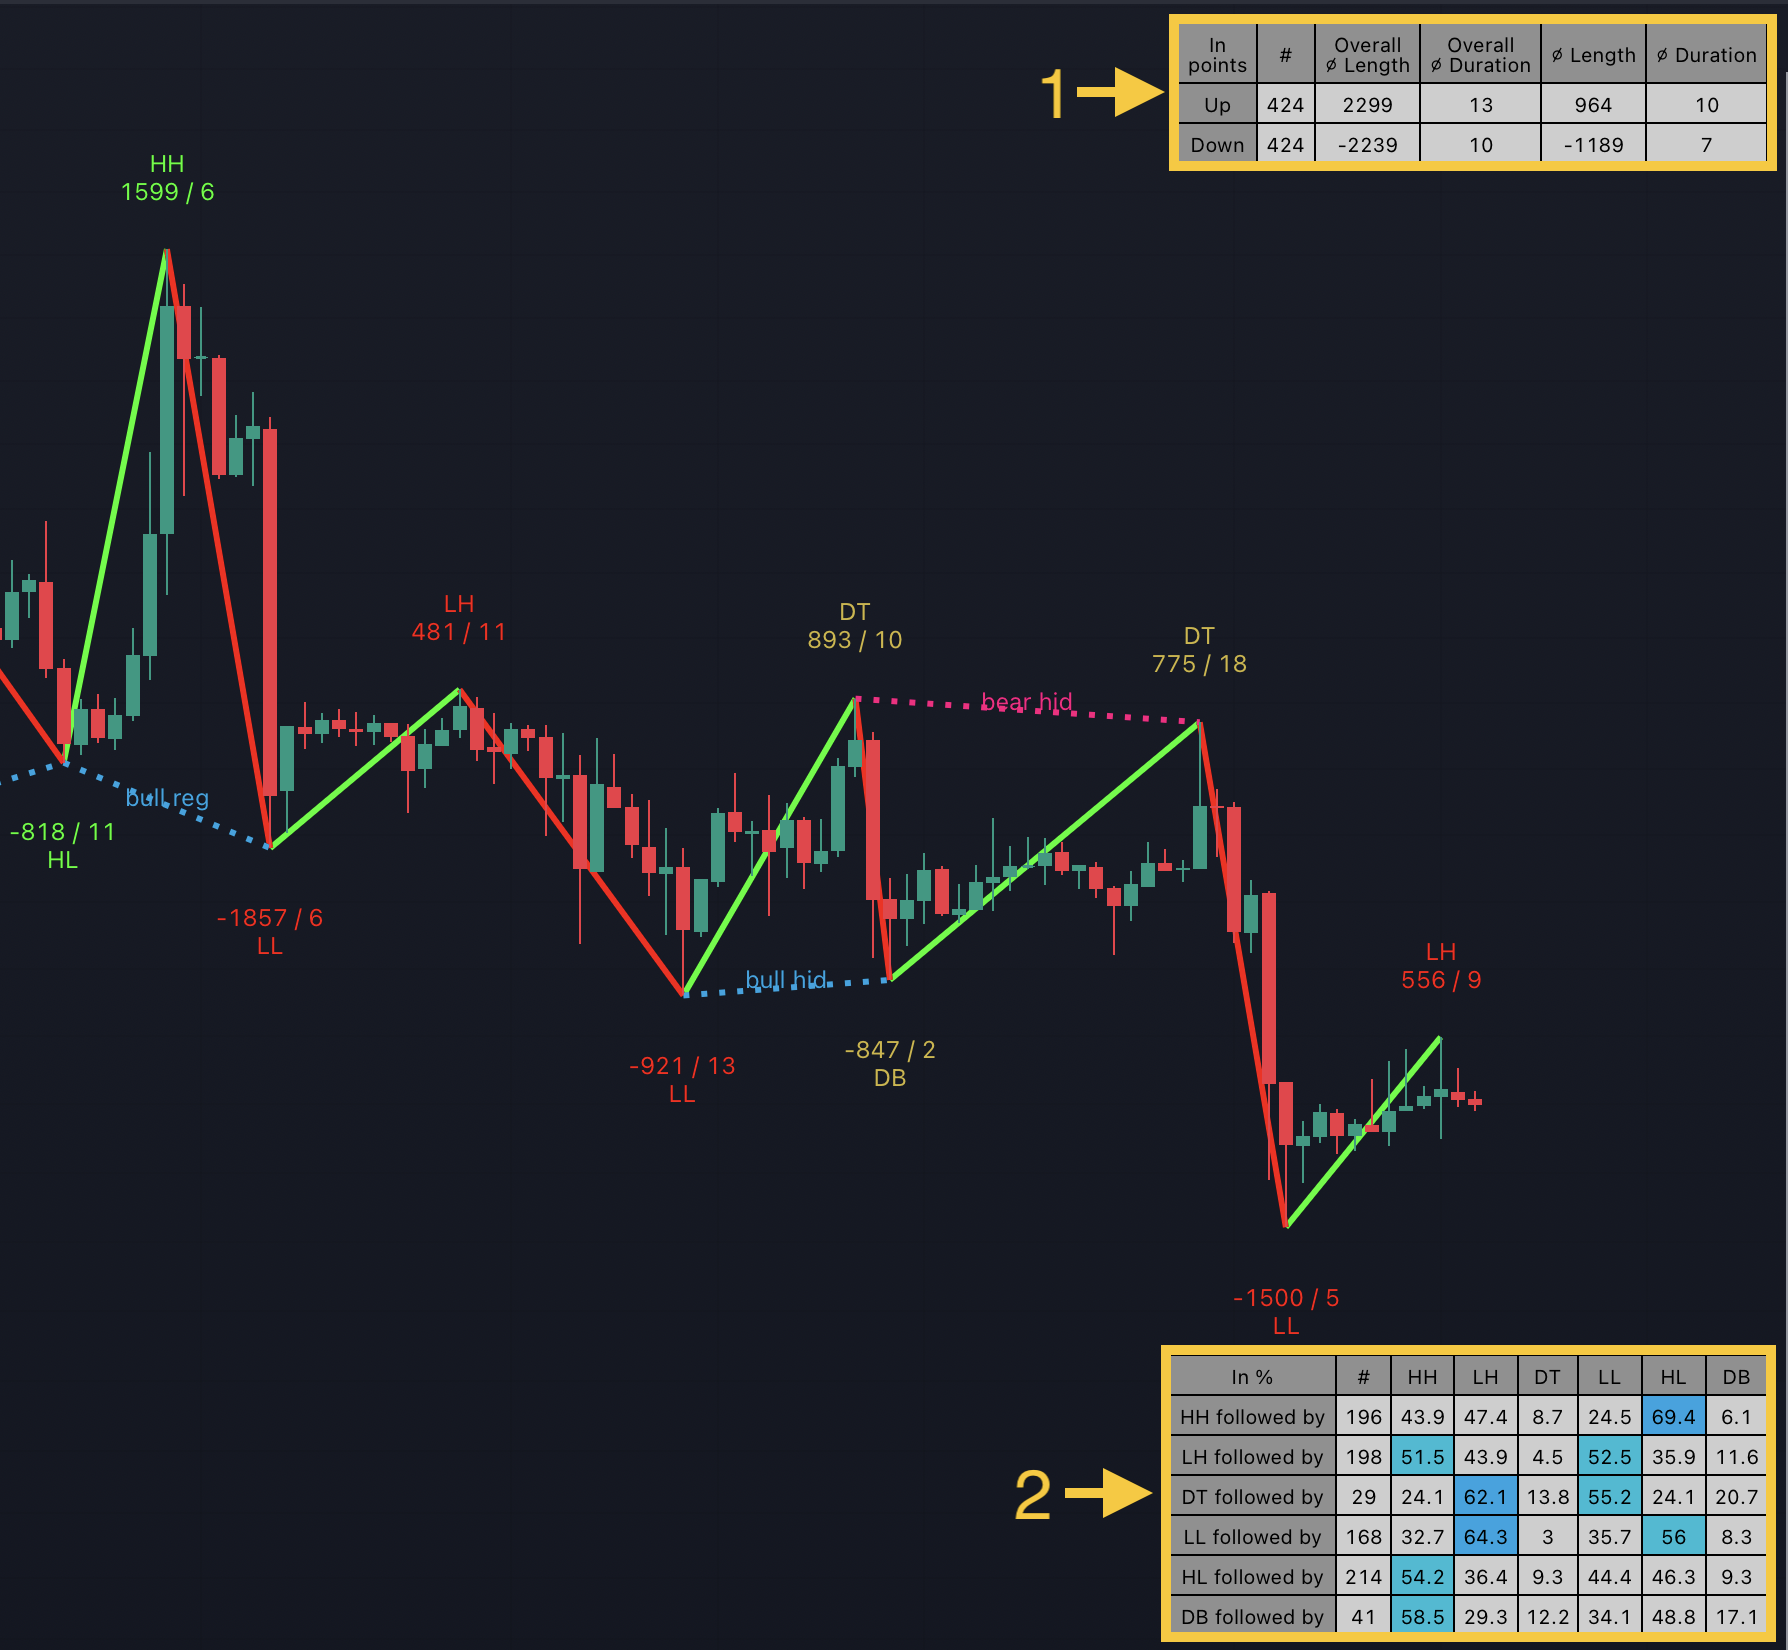
The Swing Statistic gracing the upper right corner of the chart (1) unravels the secrets of past upswings and downswings, giving you a comprehensive understanding of market trends and patterns.
Descending to the lower right corner, we encounter the Relation Statistic (2) that provides invaluable information about the sequence of highs and lows in the past. By mapping out these crucial points, you gain the ability to spot potential turning points, making informed decisions on when to enter or exit trades.
How To Read Swing Statistic
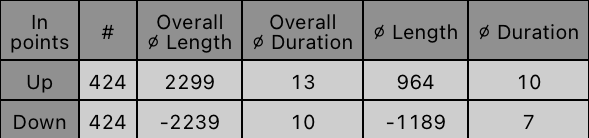
The Swing Statistic comprises two series, one for up swings (Up) and one for down swings (Down), with values given in points. Column 2 (#) displays the total number of analyzed swings. The third column (Overall ∅ Length) represents the average length of all swings in points, while the fourth column (Overall ∅ Duration) indicates the average duration of swings in bars. Additionally, the fifth column (∅ Length) shows the average lengths for custom-defined swing counts. Finally, the sixth column (∅ Duration) provide the average durations for the corresponding custom-defined swing count.
In the case of well-established assets like Microsoft or Nvidia, which have undergone one or more stock splits, the overall average in column three may deviate significantly from those in columns five and seven. It is essential to remain mindful of this factor at all times.
How To Read Relation Statistic
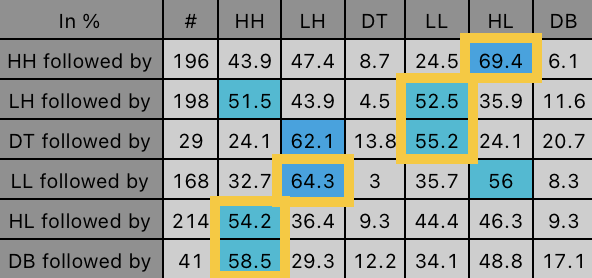
The Relation Statistic presents percentages representing the historical occurrence of specific high and low sequences. In the first column (in %), various types of highs and lows are listed as reference points.
For example, the first row corresponds to "HH followed by," where the second column (#) displays the total count of higher highs (HH) considered. The subsequent columns showcase the percentages of how often certain patterns follow the initial HH. In our example, a further HH follows in 43.9% of cases (column 3 - HH), a lower high (LH) follows in 47.4% (column 4 - LH), a double top (DT) follows in 8.7% (column 5 - DT), a lower low (LL) follows in 24.5% (column 6 - LL), a higher low (HL) follows in 69.4% (column 7 - HL), and a double bottom (DB) follows in 6.1% (column 8 - DB) of all cases.
The figure above showcases the most common sequence you will frequently encounter on many assets and timeframes. It encompasses six patterns: HH followed by HL, LH followed by LL, DT followed by LL, LL followed by LH, HL followed by HH, and DB followed by HH. These patterns can be easily recognized by the distinctively marked blue fields in the figure.
Through these valuable insights, you gain a deeper understanding of the historical patterns, enabling you to make more informed trading decisions with increased confidence.
Fields marked in blue represent sequences that occurred in over 50% of cases. In the example, the blue field in the first row indicates that a higher high (HH) was followed by a higher low (HL) in 69.4% of cases. The darker the shade of blue in each field, the higher the percentage.
How To Use Statistics
Set Stop-Loss And Take-Profit Levels For TRN Chart Patterns
Unlock the full potential of the Swing statistic to fine-tune your stop loss and take profit levels with unparalleled precision for all our TRN Chart Patterns. When validating a bullish breakout from a pattern, turn to the first statistic to evaluate the average length of up swings on your selected symbol and timeframe. Scrutinize the remaining points in the ongoing up swing, aligning it with the average up swing length to ascertain the price at which this synchronization occurs. Utilize this price as an alternative Take Profit position, offering a more tailored approach compared to the given one from the pattern.
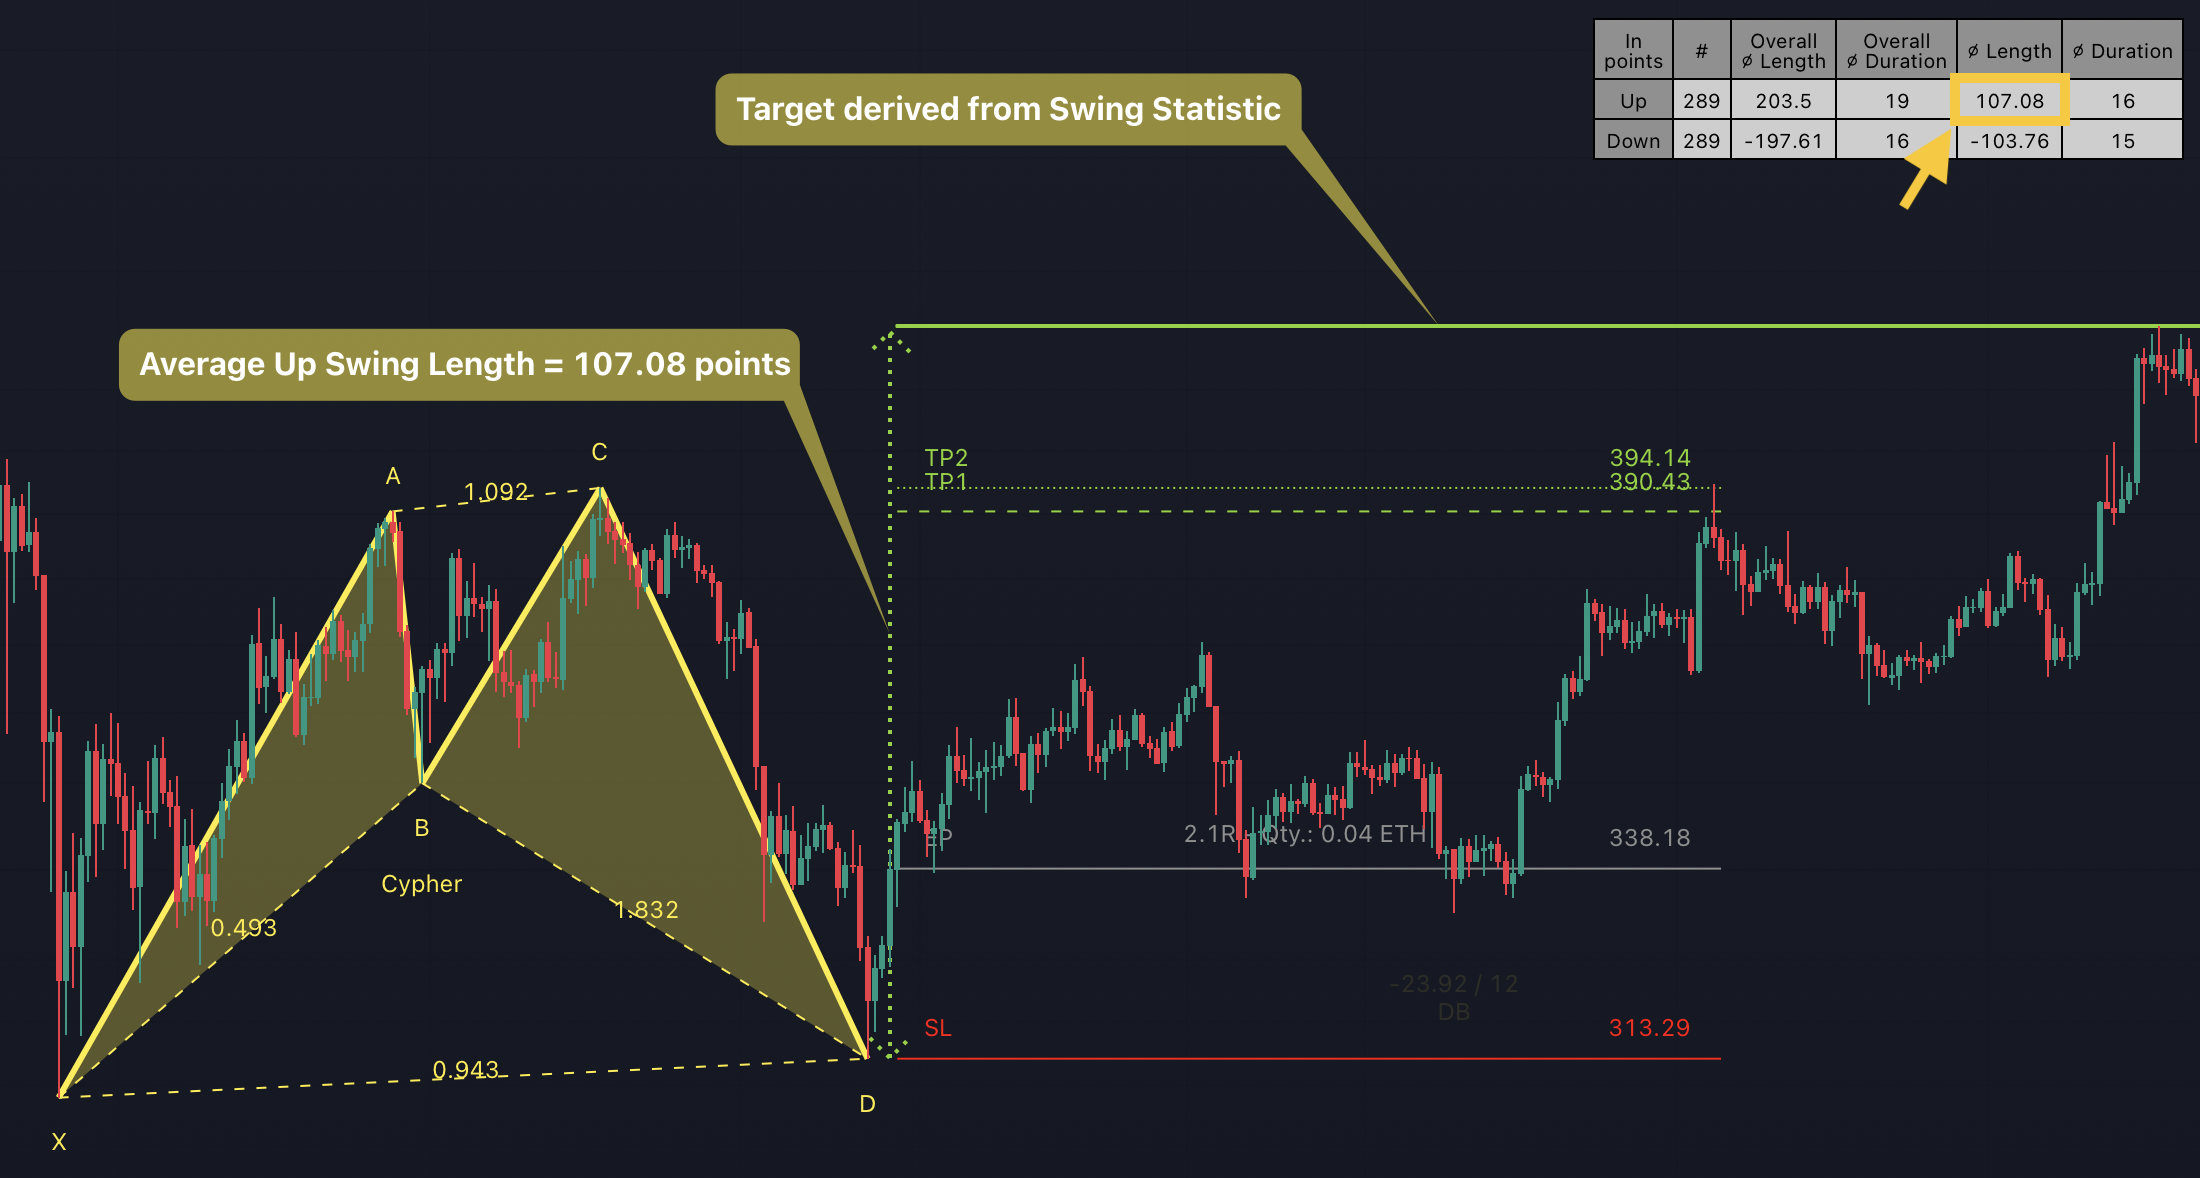
In the provided chart, we can observe that the average length of up swings is 107.08 points. To determine the target price for a bullish move, we would derive this price by adding 107.08 points to the low at point D of the Cypher pattern. This approach represents the average expected up swing, providing a valuable reference for potential price targets.
Conversely, delve into the price at which the last down swing matches the average down swing length, empowering you to establish a well-informed alternative stop loss position, optimized for your specific trading strategy.
For short trades, the methodology is easily reversed. Utilize the average length of down swings to determine your take profit target, while the average length of up swings will guide you in setting your stop loss level.
With the Swing statistic as your indispensable ally, you gain a distinct advantage in navigating the complexities of the market and making informed trading decisions with utmost confidence.
Set Stop-Loss And Take-Profit Levels For TRN Bars & Swing Suite/Divergence Signals
Harness the power of the Swing statistic to elevate your precision in setting stop loss and take profit levels for Signals from TRN Bars & Swing Suite. When a bullish breakout bar is confirmed following a bullish RSI Divergence, delve into the first statistic to assess the average length of up swings on your chosen symbol and timeframe. Analyze the points remaining in the current up swing to match the average up swing length and determine the price at which this alignment occurs. Utilize this price as your Take Profit position.
Conversely, examine the price at which the last down swing matches the average down swing length, empowering you to establish a well-informed stop loss position.
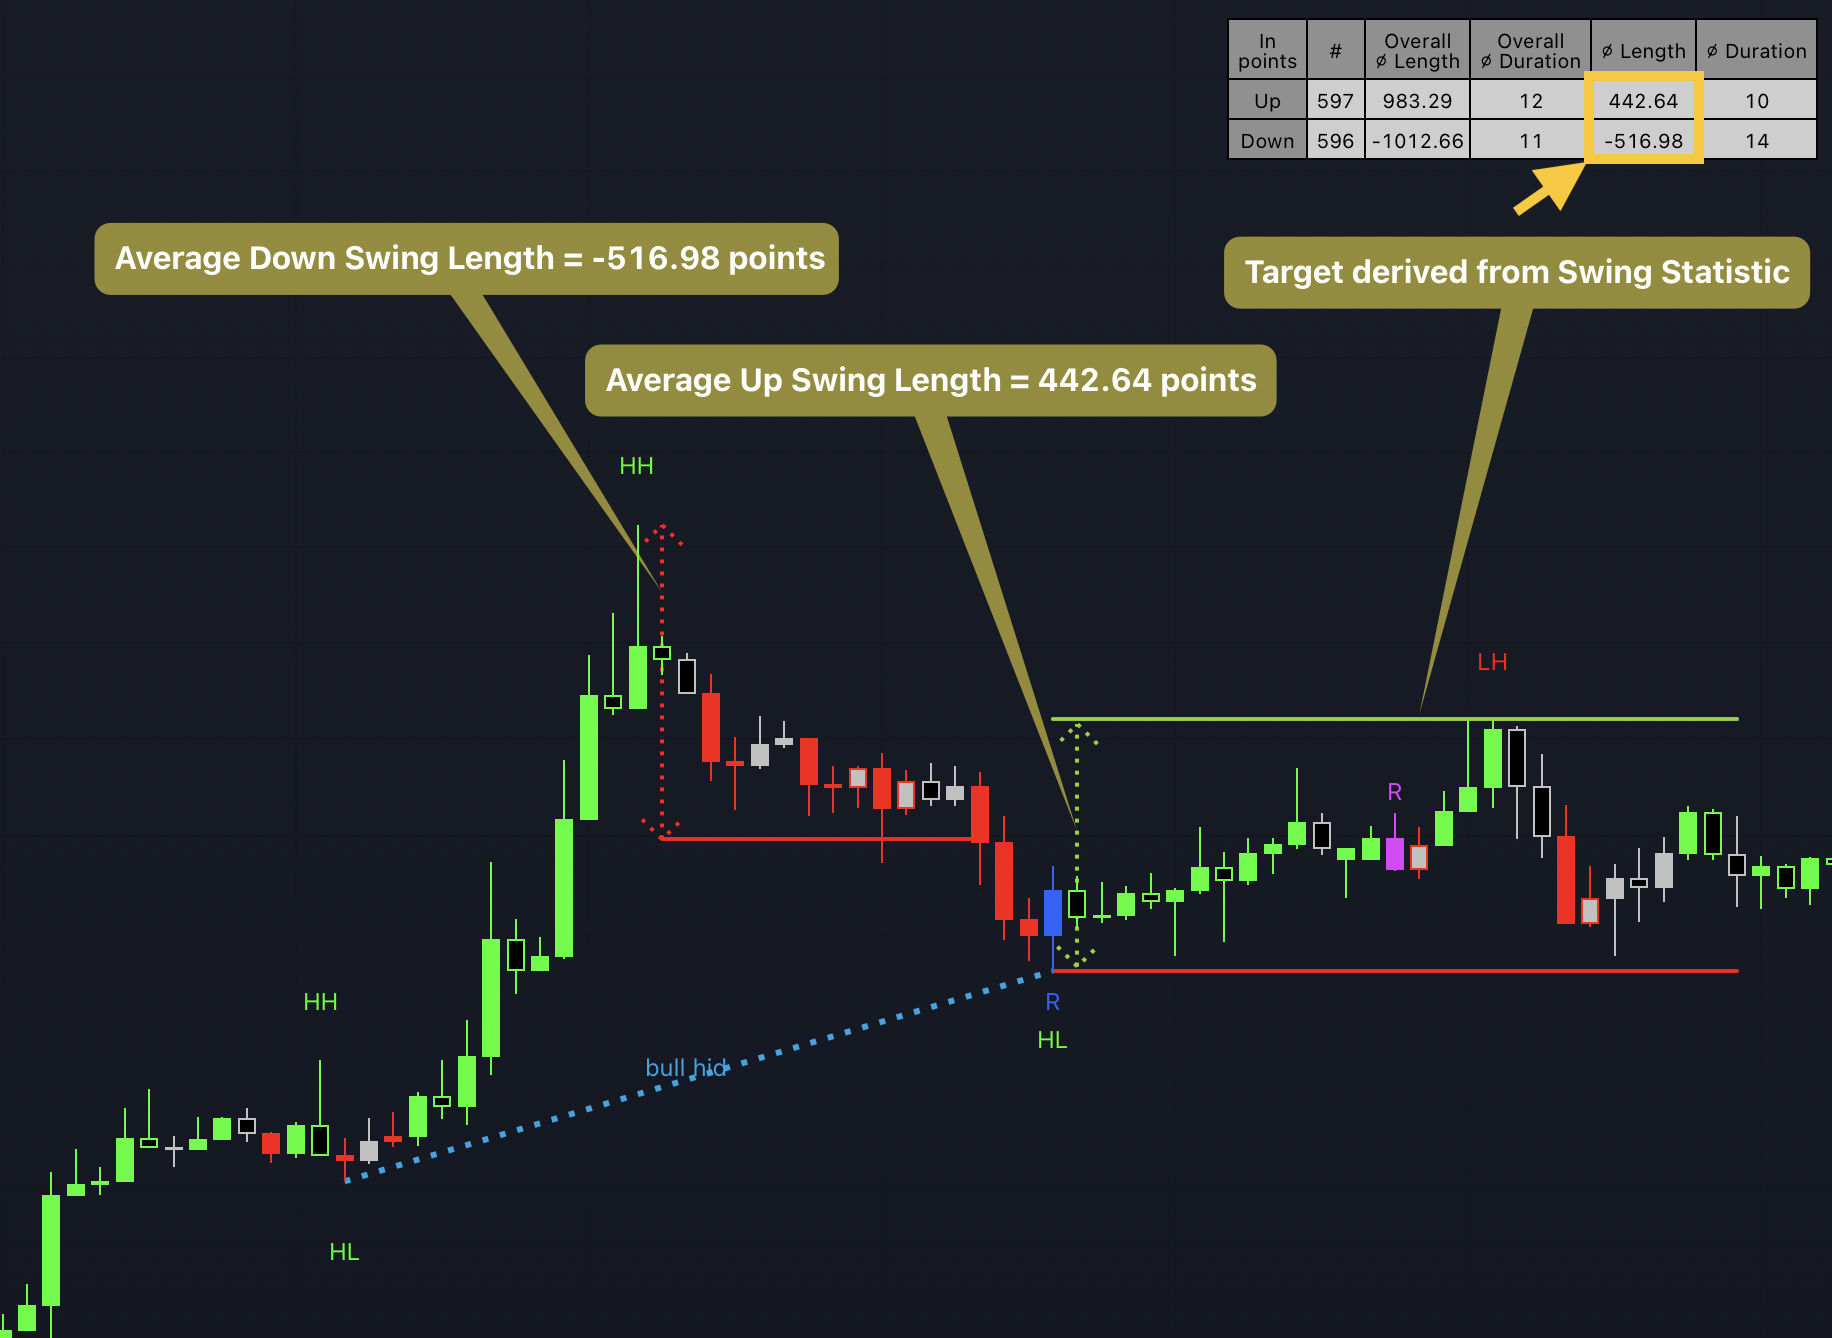
In the above example, a confirmed blue reversal bar following a hidden bullish divergence serves as the entry signal. We can observe that the average length of up swings is 442.64 points. To determine the target price for a bullish move, we would calculate this price by adding 442.64 points to the Higher Low (HL), which is also the low of the Bullish reversal bar. This approach provides a valuable reference for potential price targets, representing the average expected upswing.
The average length of down swings, on the other hand, is -516.98 points. However, the last down swing from the Higher High (HH) to the Higher Low (HL) exceeds this average length. As a result, the low of the bullish reversal bar has been established as the Stop Loss level. If the last down swing had been shorter than the average length of -516.98 points, a new alternative Stop Loss would have been determined, positioned below the current level.
For short trades, the approach is seamlessly reversed. Utilize the average length of down swings to identify your take profit target, while the average length of up swings becomes your guiding parameter for setting the stop loss level.
By strategically utilizing the Swing statistic, you equip yourself with invaluable insights, enabling you to optimize your trading decisions with exceptional accuracy and confidence.
Validate Stop-Loss And Take-Profit Levels
No matter which of our signals you choose to trade, consulting Swing Statistic 2 can significantly enhance the reliability of these signals.
For example, when encountering a bullish breakout after a lower low (LL), you can examine the likelihood of a subsequent lower high (LH) or even a higher high (HH). Combining this valuable information with your predetermined Take Profit level allows you to better assess whether your target can be achieved successfully.
Similarly, you can verify the probability of the next low being a higher low (HL) or another lower low (LL) to determine the likelihood of your Stop Loss being triggered.
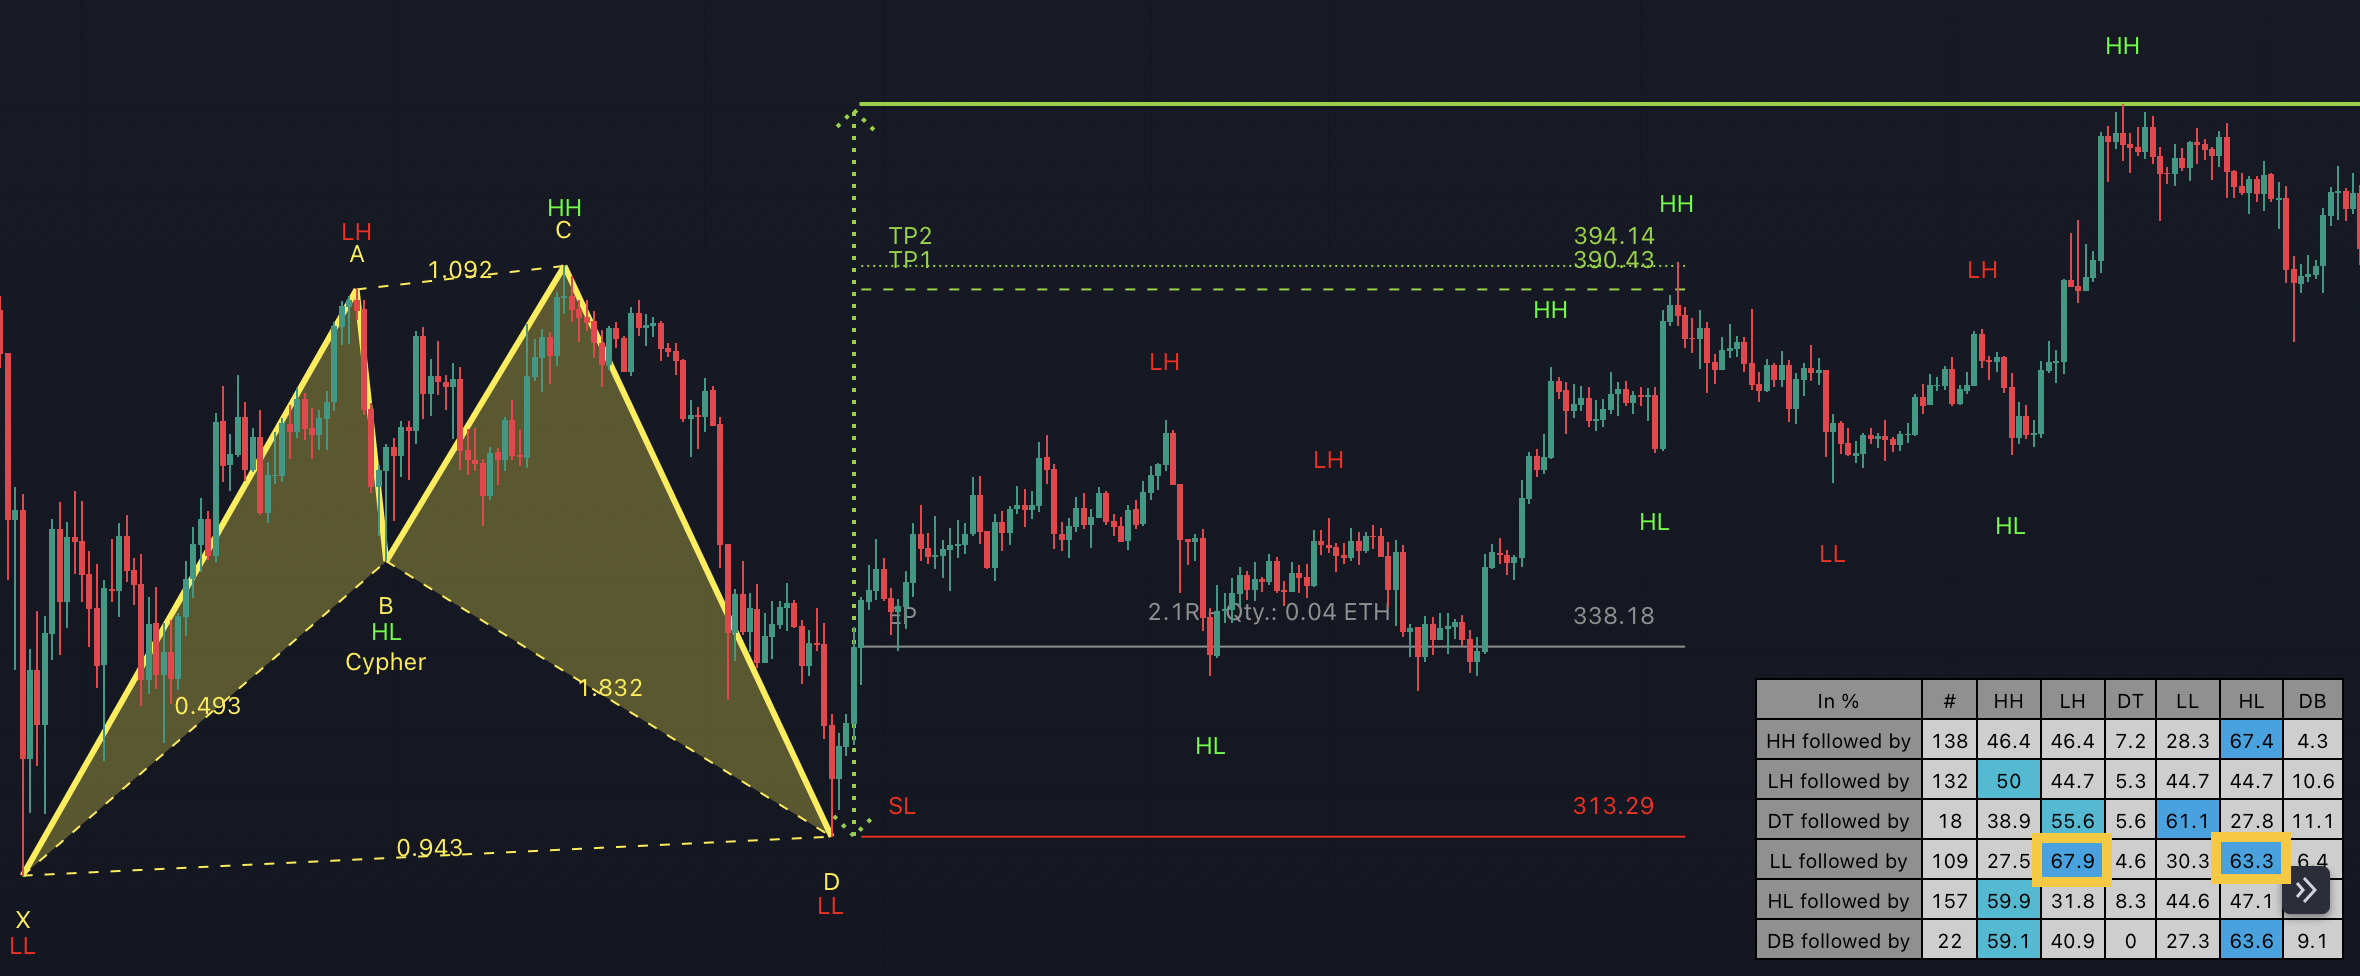
The table in the above example reveals that there is a 67.9% chance of a Higher High (HH) following the Lower Low (LL) at point D. With such a significant probability, it is advisable to position the take-profit at a price level above the last high.
Furthermore, the table indicates a 63.3% probability of a Higher Low (HL) occurring after the Lower Low (LL) at point D. This high probability bolsters the belief that the set stop-loss will not be triggered since it was placed at the LL at point D, implying that a double bottom (DB) or another Lower Low (LL) would need to form for it to be activated.
By utilizing Swing Statistic 2, you empower yourself with valuable insights, equipping you to make more informed and confident trading decisions.