Pattern Statistics
Gain valuable insights into the historical performance of chart patterns on specific time frames through our comprehensive statistics. Experience the power of transparency as our statistics enhance the reliability of TRN Chart Patterns to new heights.
How To Read Statistics

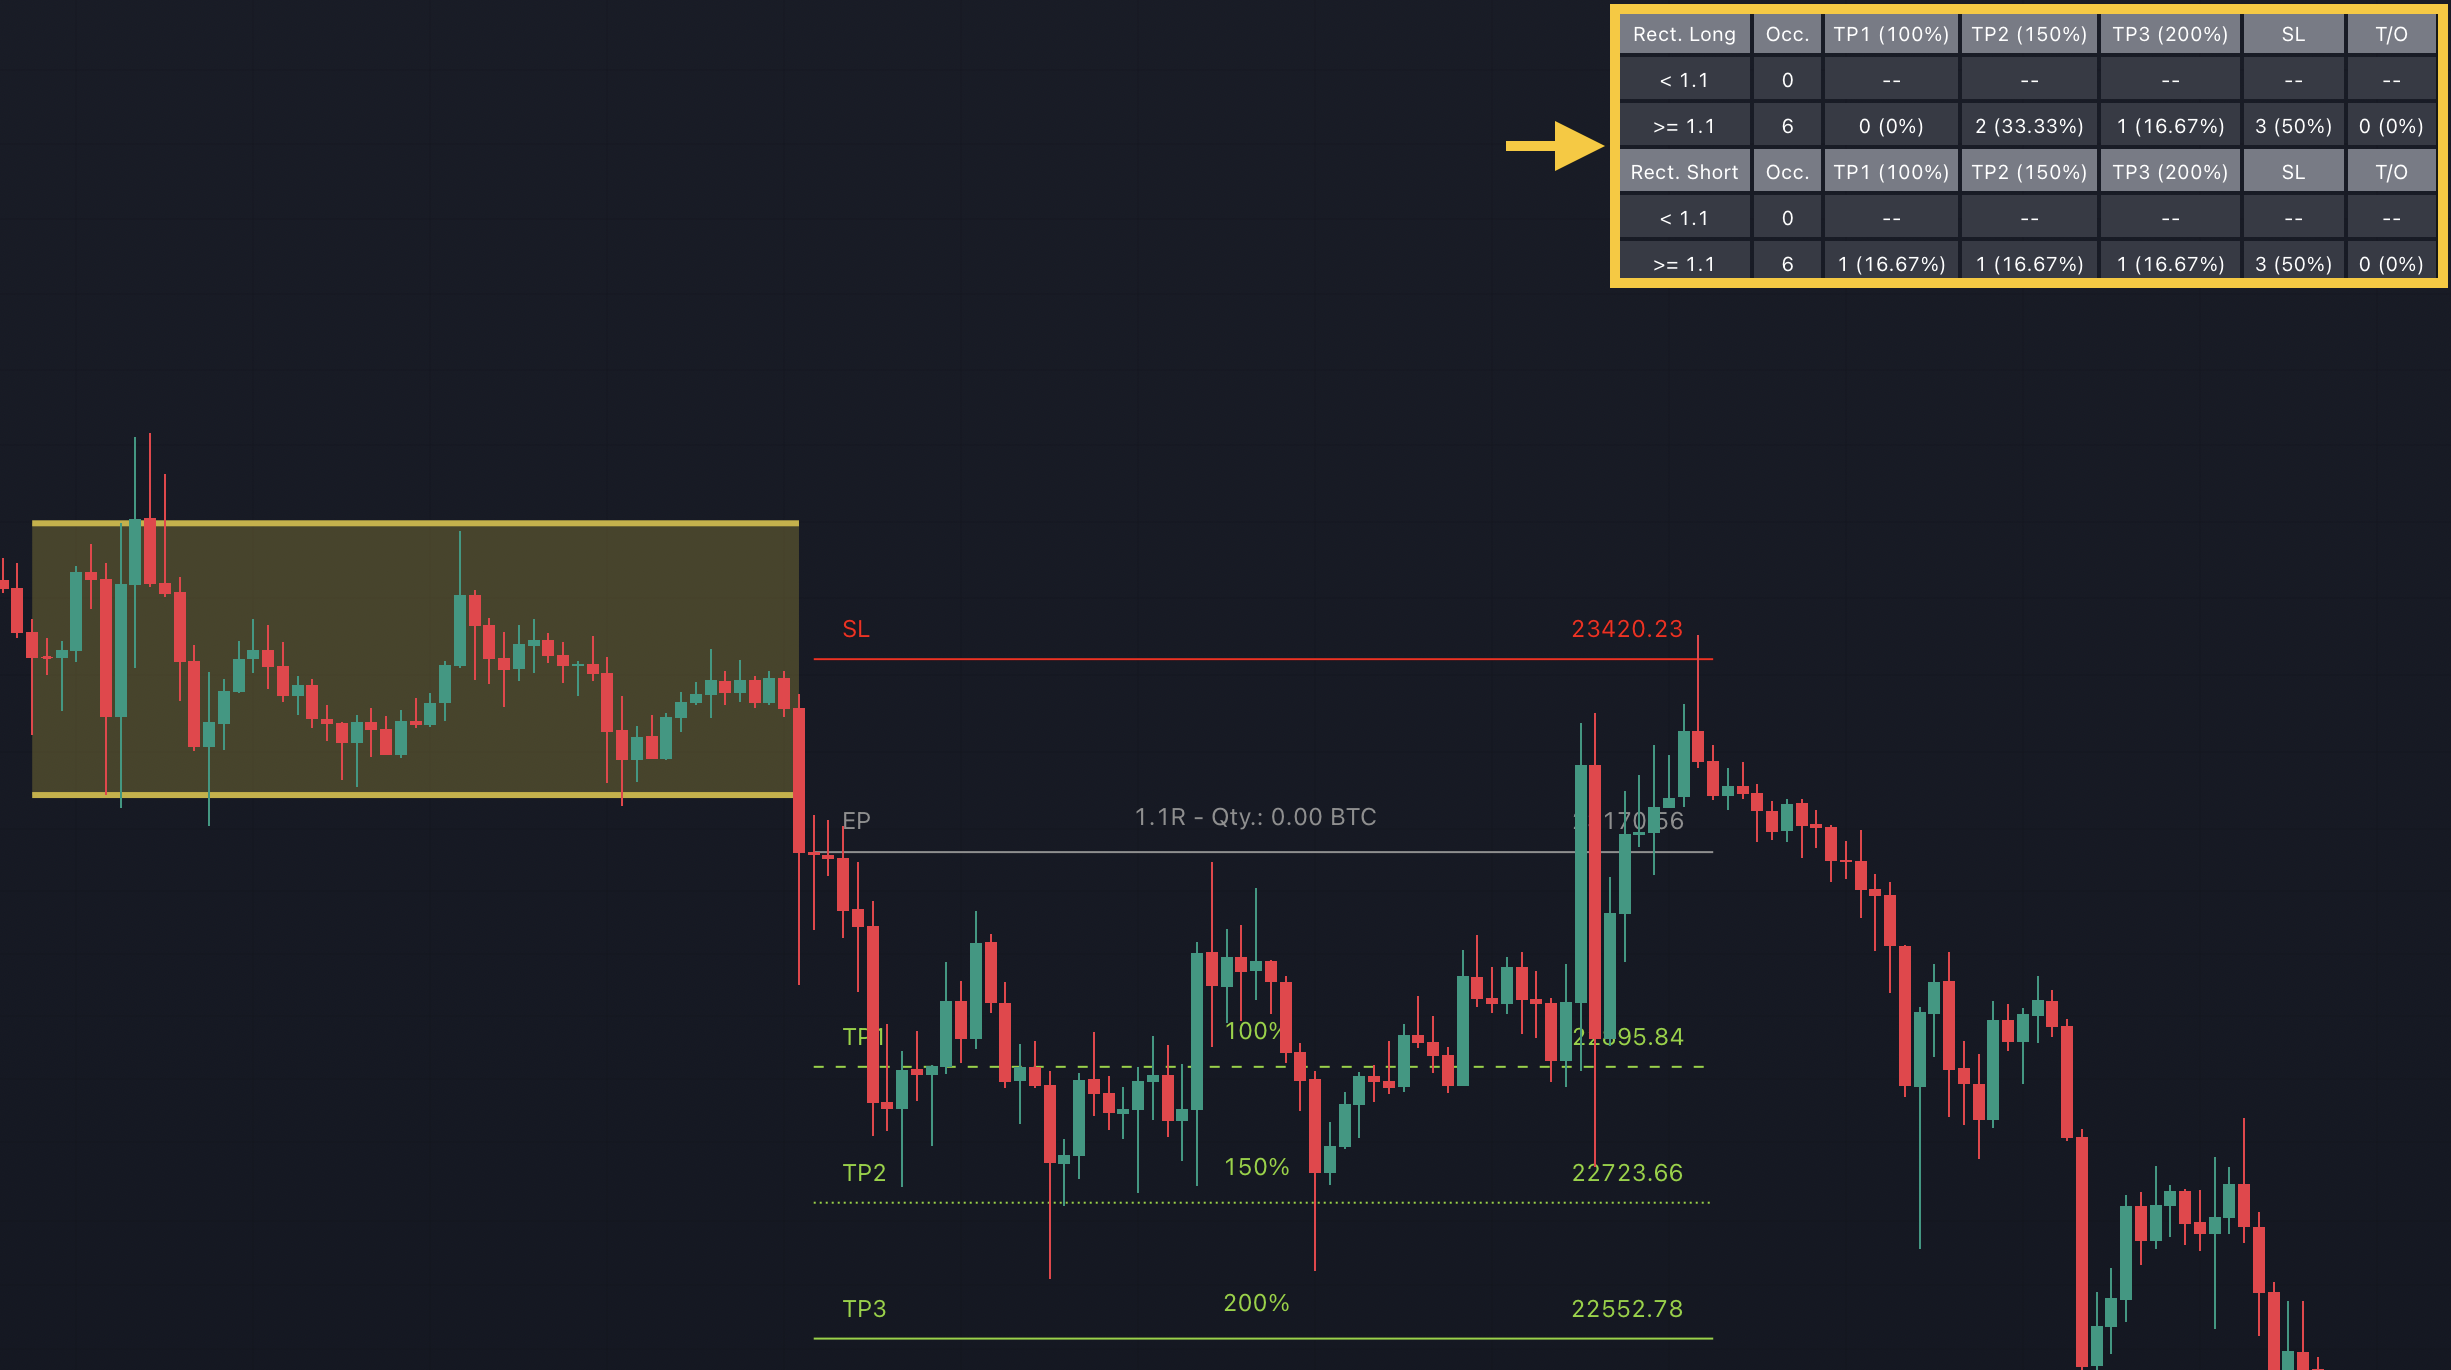
The chart always displays the statistics in the upper right corner. These statistics are categorized into two sections: "long" for patterns with an upward breakout and "short" for patterns with a downward breakout.
In the initial columns, labeled as "short" and "long", the identified breakouts are further divided based on whether the profit/loss ratio (R) is below a specified value (< x) or equal to/greater than the specified value (>= x). In the provided example, the value of x is set at 1.1.
The "Occ." column represents the count of confirmed breakouts, categorized according to the ranges of R from the first column.
The following three columns (TP1, TP2, TP3) indicate how the numbers from the second column are distributed among the targets 1, 2, and 3 of the pattern.
The fourth column (SL) displays the count of patterns that triggered the stop loss after their confirmed breakout.
Lastly, the fifth and final column (T/O) reveals the count of patterns that reached any of the targets (TP1, TP2, TP3) following their confirmed breakout.
Visit our Risk Management section to learn how to define your minimum accepted profit/loss ratio (R) for the TRN Chart Patterns.
How To Use Statistics

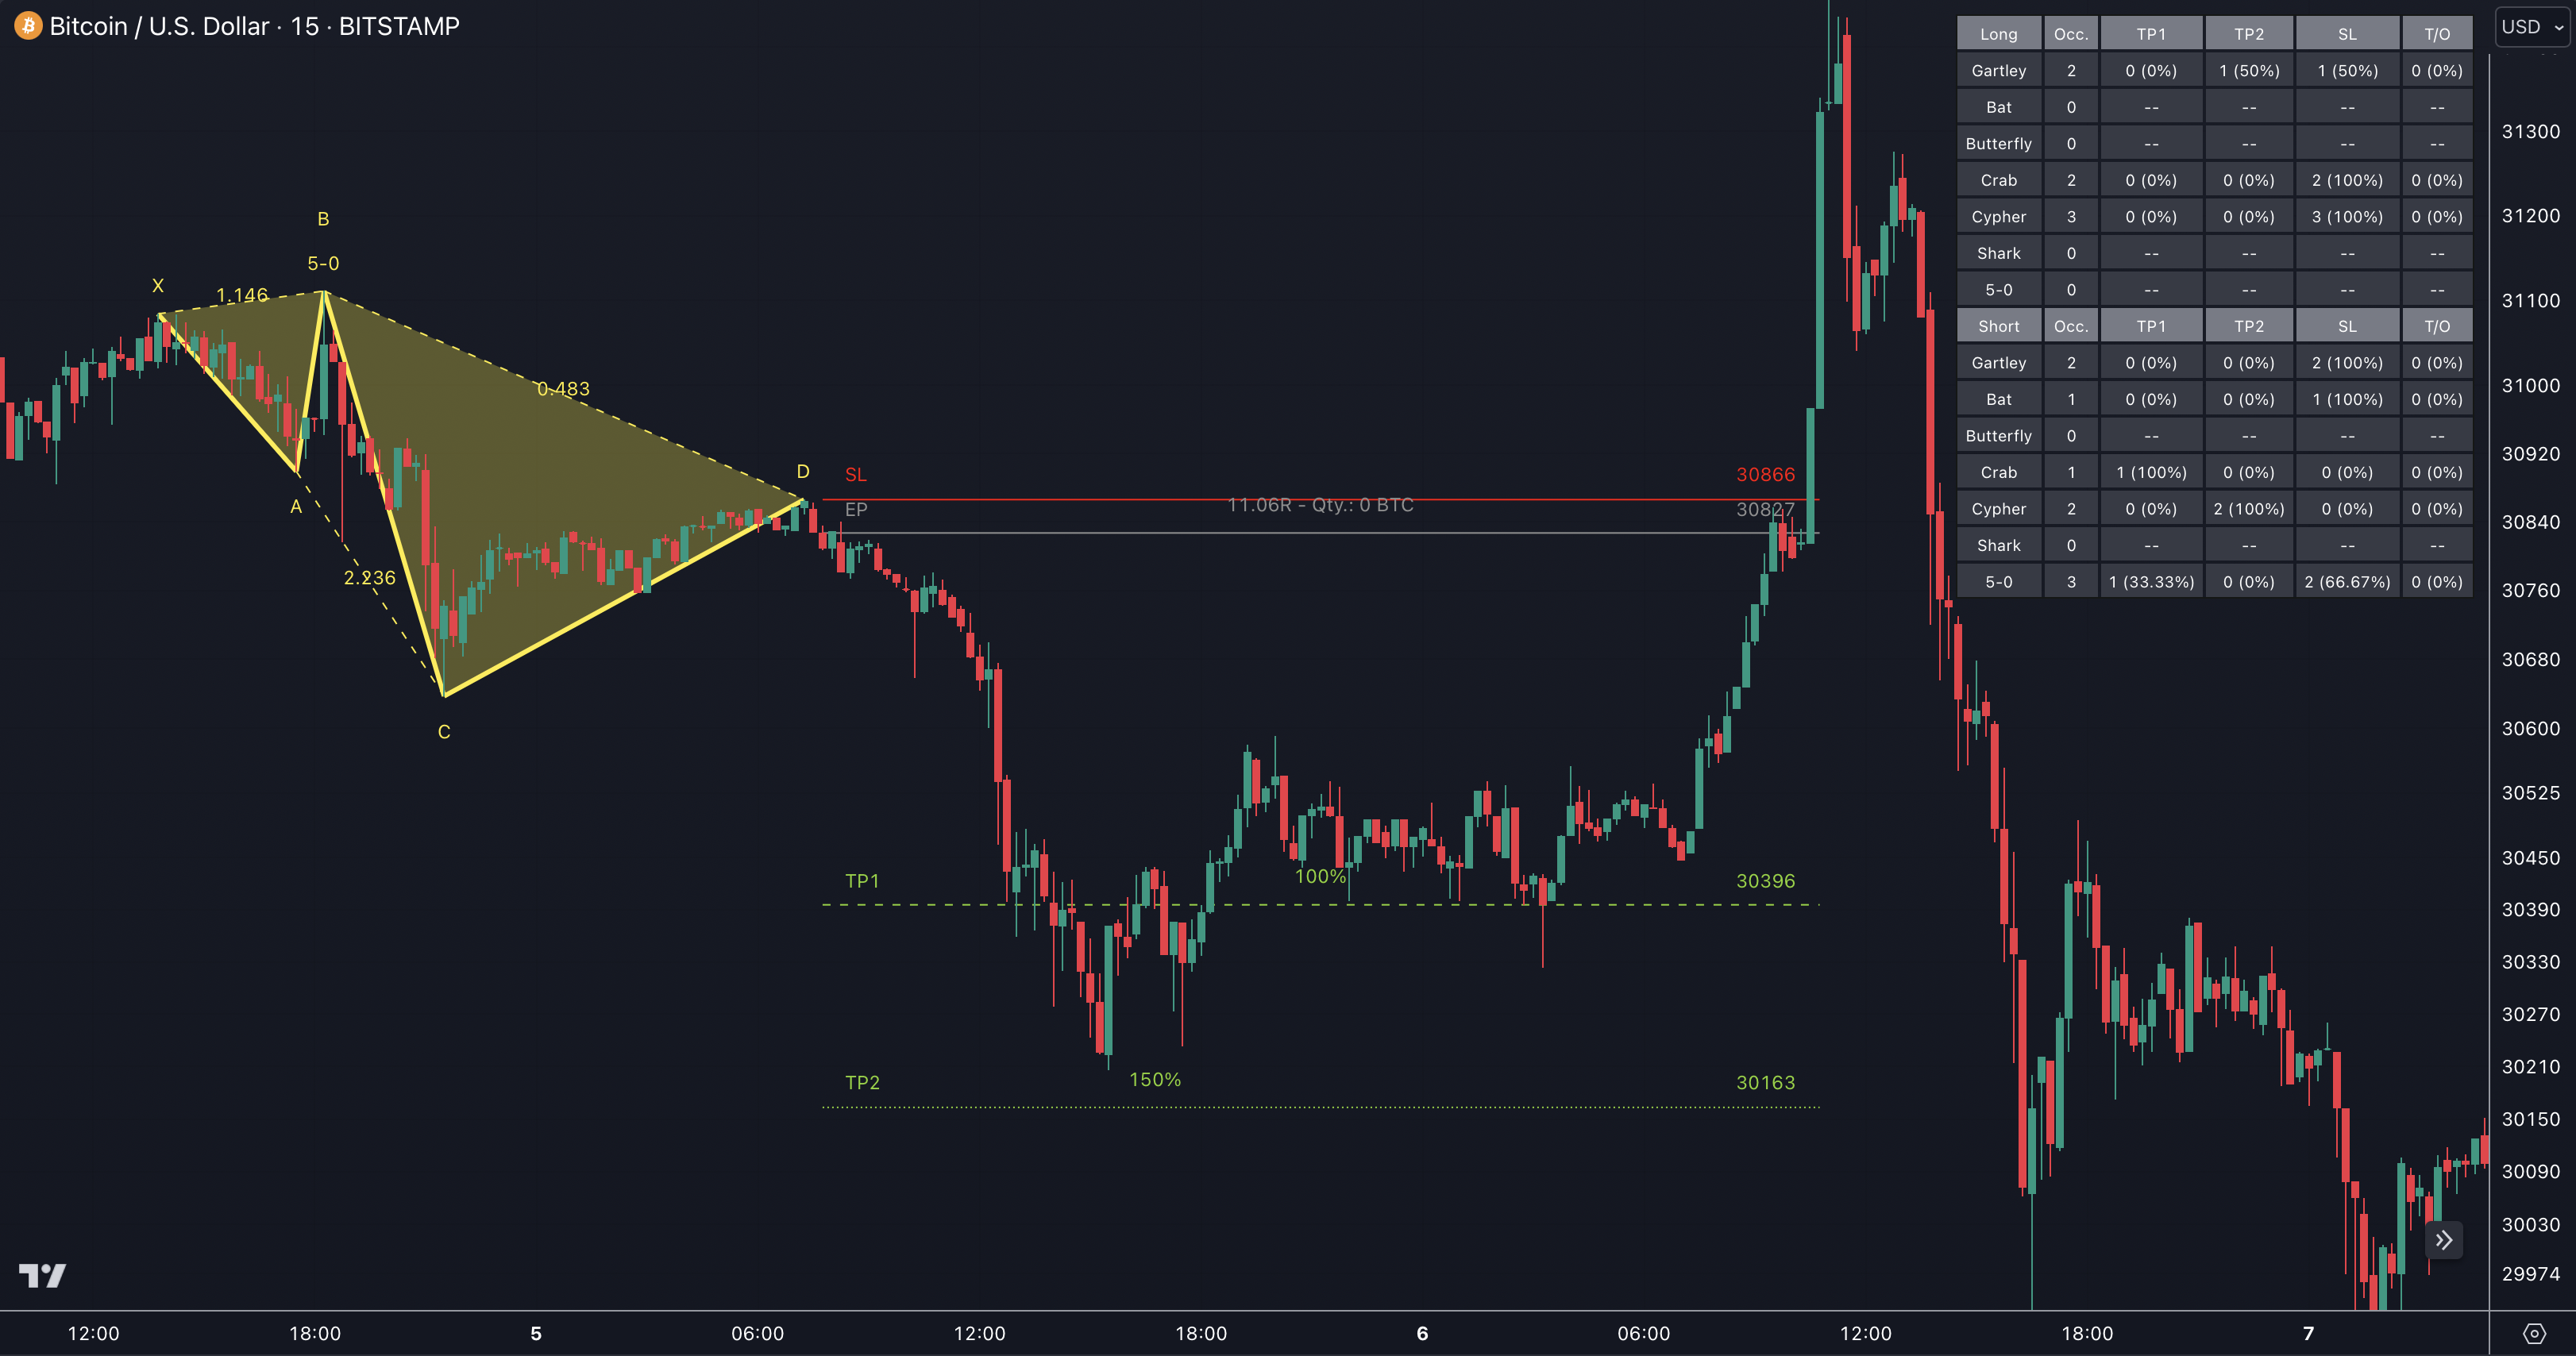
It's important to review the statistics before trading a pattern. Examine whether the pattern has frequently achieved the targets or if the stop-loss has been triggered more often.
An at least balanced ratio is desirable for patterns with a risk/reward ratio (R) up to 2, such as the TRN Rectangle. This provides a solid foundation for trading.
Patterns with potential for exceptionally high R, like the TRN Harmonics, can still be worthwhile trades even if only 1 out of 2 or 3 patterns reached the first target in the past, like the 5-0 pattern in the figure above.