Consolidation And Range Pattern

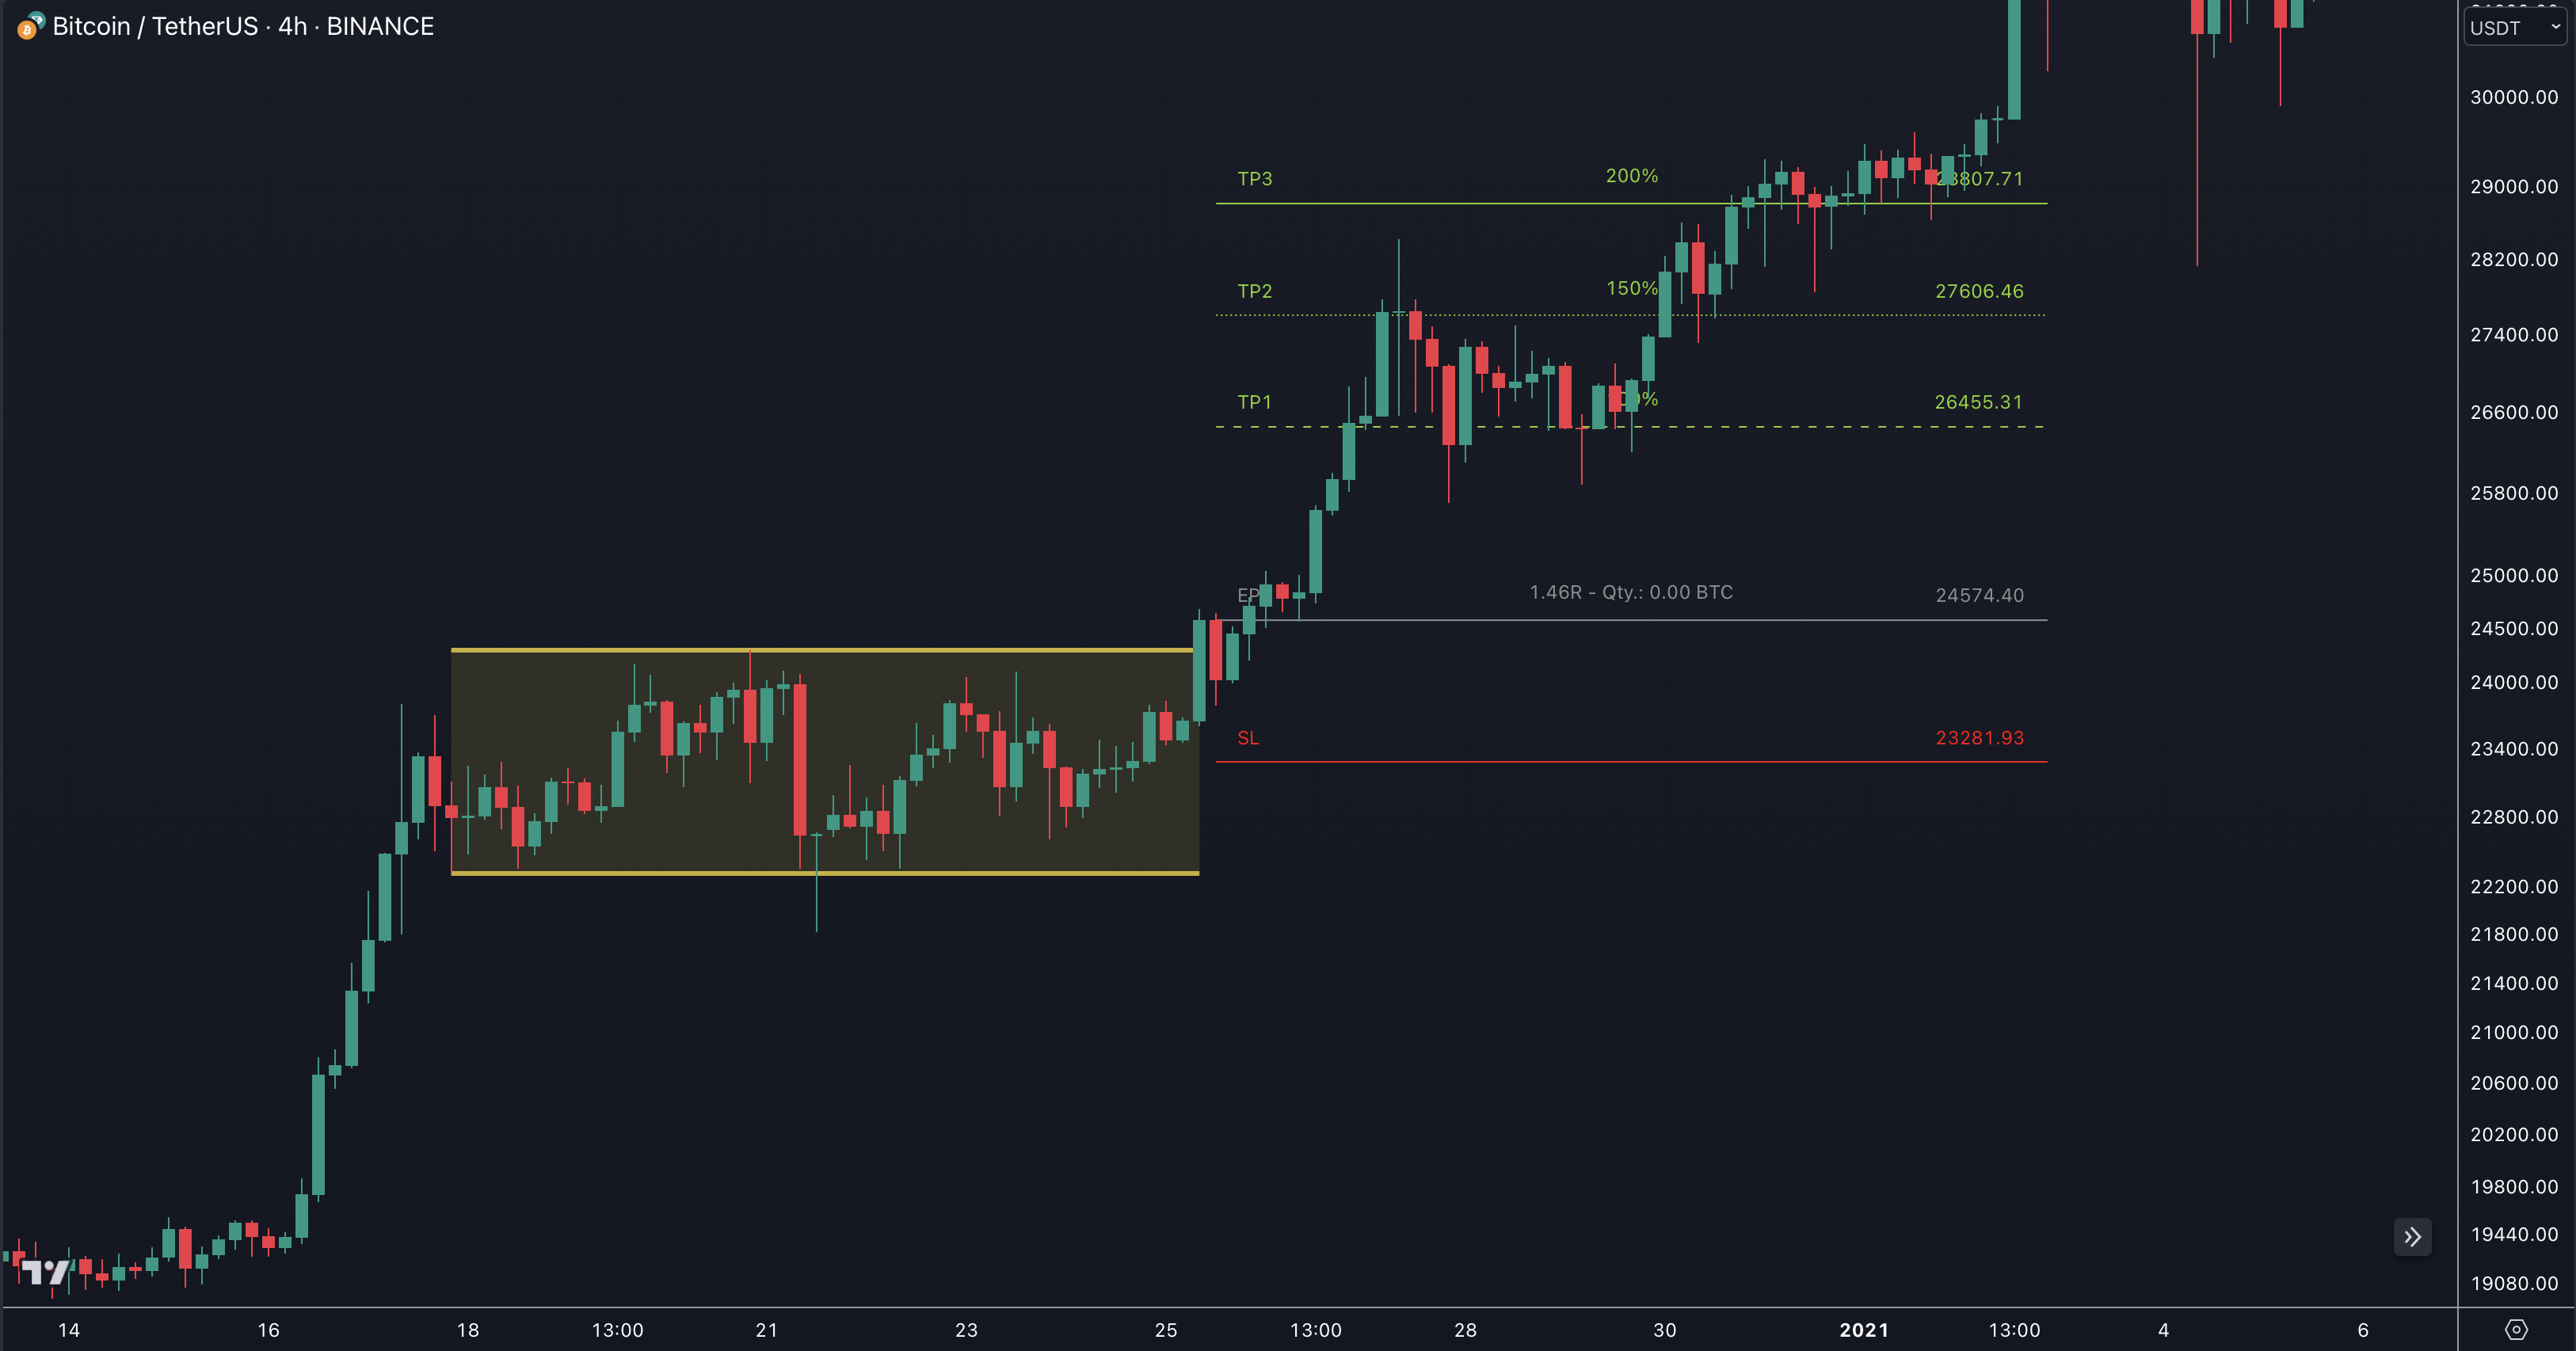
A rectangle pattern, also known as a trading range or a consolidation pattern, is a technical analysis pattern that occurs on price charts. It is characterized by horizontal lines that act as support and resistance levels, creating a rectangular shape.
Pattern Key Features
The rectangle pattern is formed when the price of an asset trades within a relatively narrow range, with the upper and lower boundaries serving as resistance and support levels, respectively. These boundaries are often drawn as straight lines, creating a rectangle-like shape on the chart.
Sideways Price Movement
The price moves in a horizontal or sideways direction, with little or no clear trend. The upper boundary (resistance) and lower boundary (support) act as price ceilings and floors, respectively.
Support And Resistance Levels
The upper boundary represents a price level where selling pressure increases, preventing the price from moving higher. The lower boundary represents a price level where buying pressure increases, preventing the price from moving lower. Traders often draw these lines connecting multiple highs and lows to identify the boundaries of the pattern.
Duration
Rectangle patterns can last for varying durations, from a few days to several weeks or months, depending on the timeframe of the chart being analyzed.
Volume
During the formation of a rectangle pattern, trading volume is usually lower compared to periods of strong trends. Volume tends to contract as the price moves within the pattern.
Breakout
Eventually, the price is expected to break out of the rectangle pattern, indicating the end of the consolidation phase and the potential resumption of a trend. Breakouts can occur in either direction, with the price moving above the upper boundary (bullish breakout) or below the lower boundary (bearish breakout). Traders often look for an increase in volume accompanying the breakout as confirmation of the new trend direction.
Rectangle patterns are considered continuation patterns, suggesting that the price is likely to continue its previous trend once the breakout occurs. However, breakouts can also result in trend reversals, especially if accompanied by strong volume and price momentum.
Traders and investors use rectangle patterns to identify potential entry and exit points, set stop-loss orders, and gauge the overall market sentiment. They often combine the rectangle pattern analysis with other technical indicators or chart patterns to increase the probability of successful trades.
Have a look into our Combinations section to find possible combinations with our tools like TRN Bars or the Swing Suite.
How To Setup Consolidation And Range Pattern
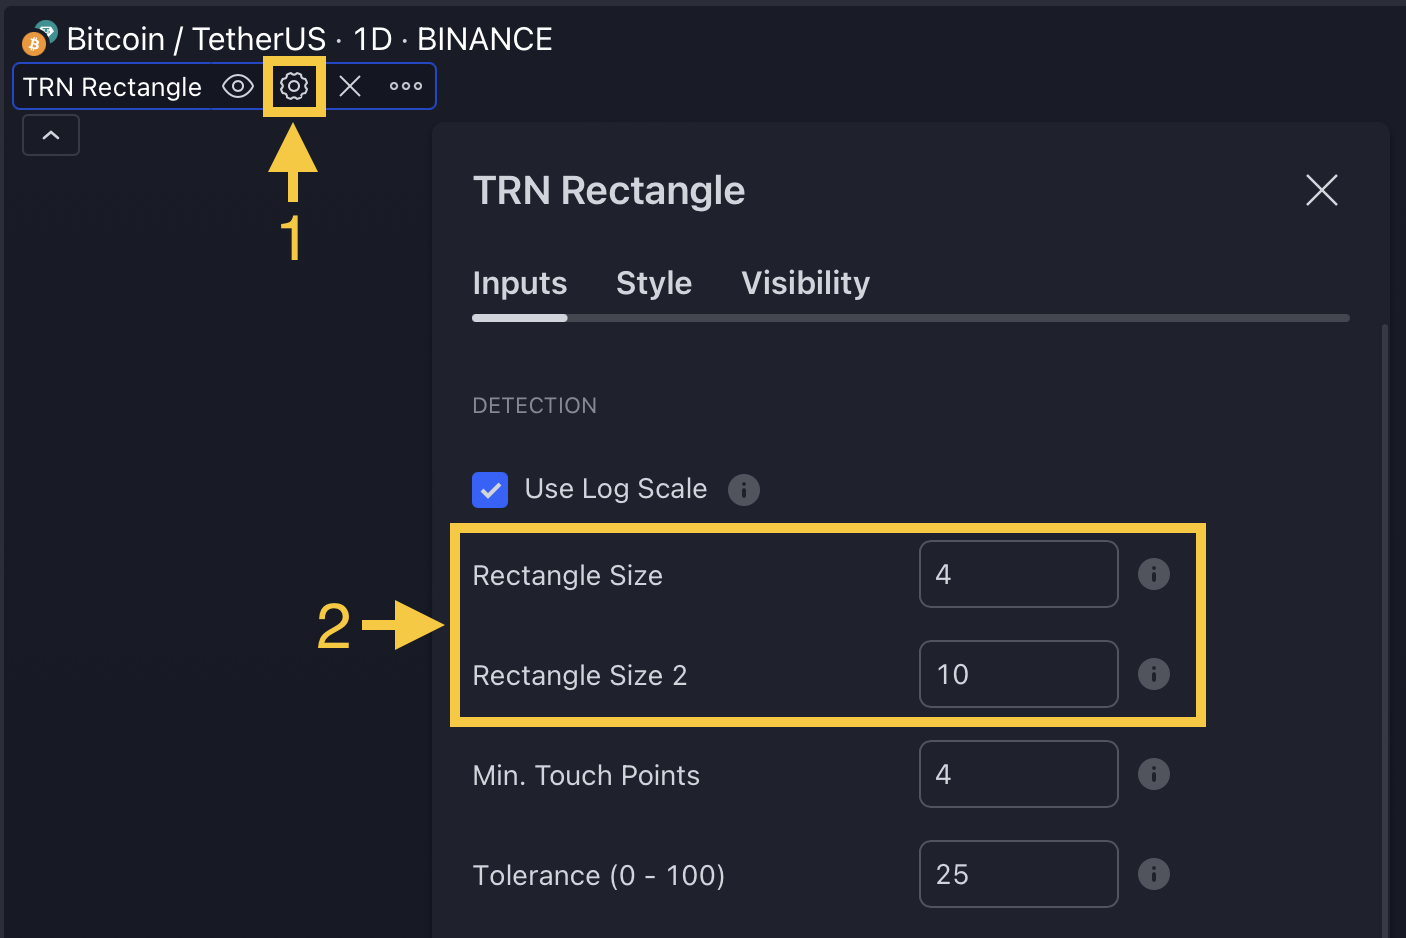
Our Consolidation And Range Pattern indicator is designed to identify rectangle patterns using two distinct swing sizes. By default, the first rectangle's swing size is set to 4, and the second rectangle's swing size is set to 10.

To modify the swing size, navigate to the indicator settings (1) and adjust the rectangle size in the "Detection" section (2).
A larger rectangle size corresponds to the detection of larger patterns, while a smaller rectangle size results in the identification of smaller patterns by our indicator.
How To Trade Consolidation And Range Pattern

The Consolidation And Range Pattern is a technical analysis chart pattern that can be used to signal a period of consolidation in a market. To trade the Consolidation And Range Pattern, you can use the following steps:
1. Identify The Pattern
Add the Consolidation And Range Pattern to your chart and look for the pattern on the asset and timeframe of your choice.
You can also use the alerts to easy getting notified when a pattern is in the making or gets confirmed on the Symbol and timeframe of your choice. Please check out our Alerts section to learn how to use them.
With our Market Scanner you can search for rectangle patterns on up to 40 different symbols at the same time. Just get notified when a pattern is found, breaks out or is confirmed.
Visit our Market Scanner section to see how it works.
2. Identify The Breakout Point
Look for the grey line (EP) at the point where the price breaks through the resistance or support levels, indicating that the consolidation period is over.
3. Place Your Order
Once a breakout has been confirmed, place a buy order near the price level of the grey entry point line (EP) above the resistance for a long position, or place a sell order near the price level of the EP line under the support for a short position.
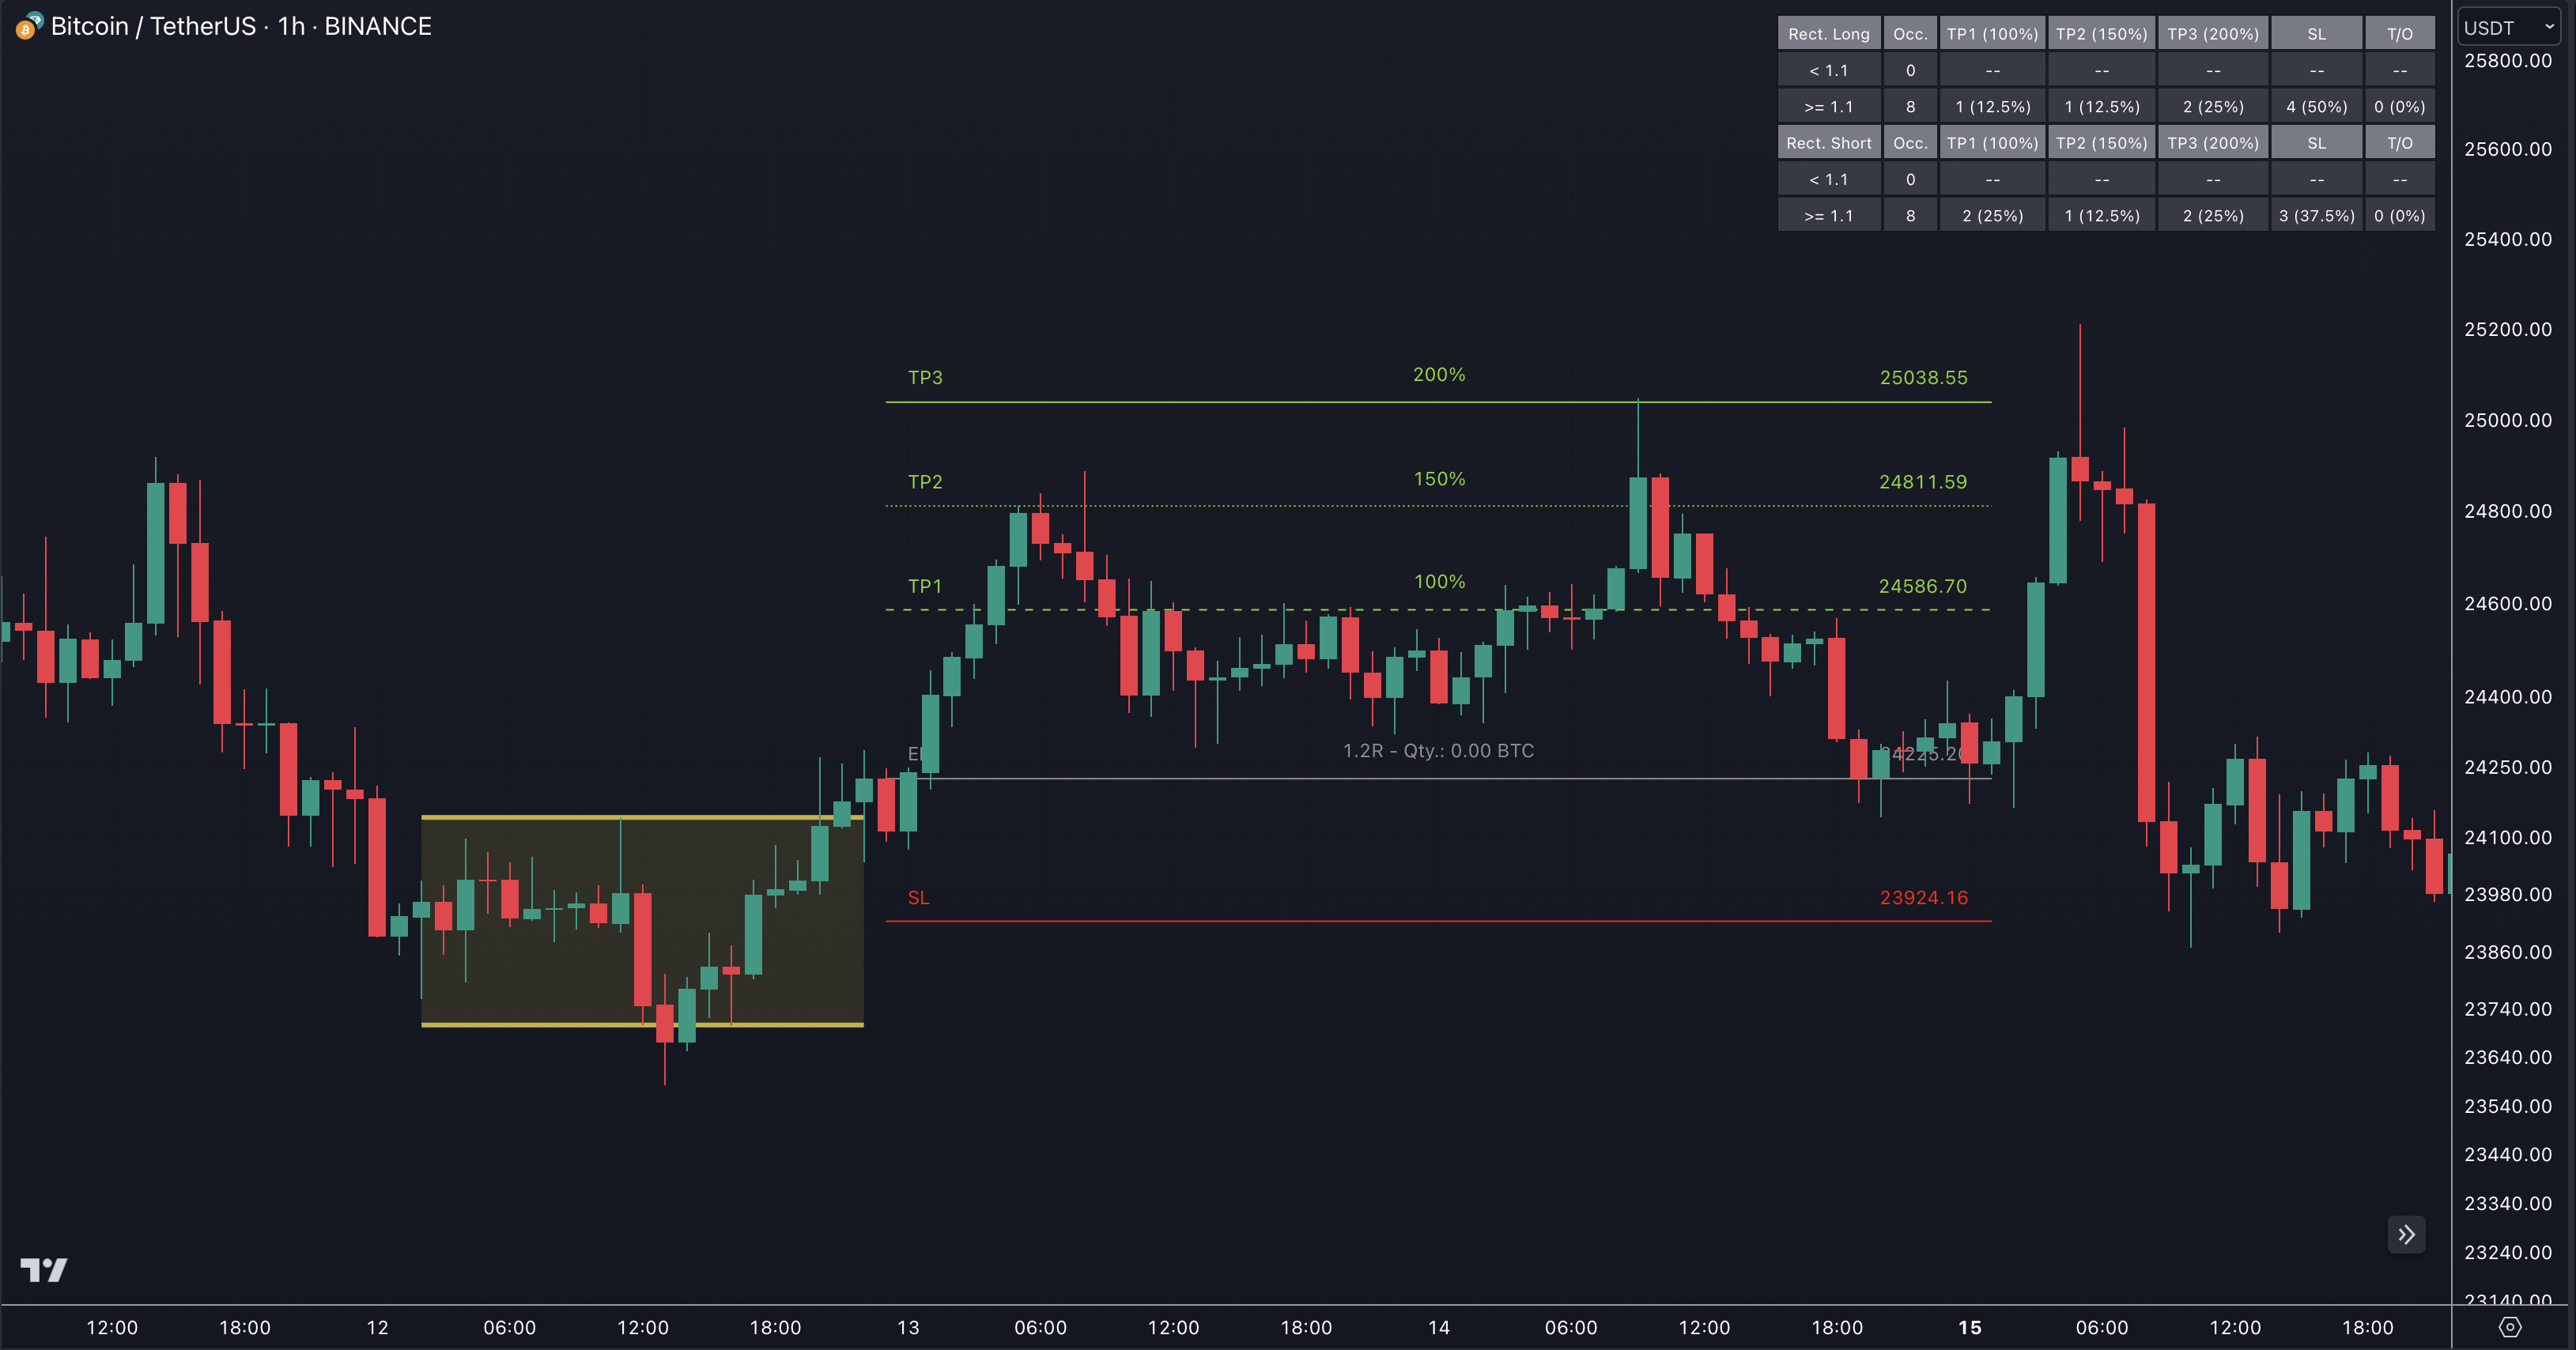
Our Pattern Statistics make it easy for you to see how successful a Pattern is on the Asset and timeframe you are watching. You should always check them out before entering a trade. Visit our Pattern Statistics section to learn how to use and adjust them correctly.
4. Set Stop-Loss and Take-Profit Levels
Set your stop-loss at the price level of the red stop-loss line (SL). Set your take-profit at the price level of one of the green take-profit-lines (TP1, TP2, TP3). Take into account that your risk/reward ratio (R) was calculated on the basis of TP1.
Enhance the precision and effectiveness of your stop-loss and take-profit orders by leveraging the Swing Statistics feature in our Swing Suite tool. Visit our How To Use Statistics section to gain valuable insights on how to utilize this tool to its full potential.
Use our build in Risk Management feature to optimize your trade. Check out our Risk Management section if you want to know the details.
5. Monitor Your Trade
Keep an eye on the market and be prepared to adjust your stop-loss and take-profit levels as needed.
Utilize the TRN Bars to effectively monitor your trades. Discover the inner workings of this tool by referring to the designated section How To Use TRN Bars.
Rectangle patterns are not always reliable. There are many other factors that can affect the price of a stock or other market. Additionally, it is important to consider your own risk tolerance and investment goals when making any trades.