Head And Shoulders Pattern
The head and shoulders chart pattern (shs) is a technical analysis pattern used to identify potential trend reversals in financial markets. It consists of three peaks, with the middle peak being the highest and the two outside peaks being slightly lower in height. The middle peak is referred to as the "head" and the two outside peaks are referred to as the "shoulders."
The pattern typically forms after an uptrend and is considered to be a bearish signal. Traders and analysts look for this pattern to signal a possible shift in the direction of the price trend. Once the price breaks below the neckline, which is a support level that connects the lows of the two shoulders, it is seen as confirmation of the pattern and the start of a downtrend.
Conversely, a "reverse head and shoulders" pattern forms after a downtrend and is considered to be a bullish signal. It consists of three troughs with the middle trough being the lowest and the two outside troughs being slightly higher in depth. The pattern is confirmed when the price breaks above the neckline, which is a resistance level that connects the highs of the two shoulders.
Have a look into our Combinations section to find possible combinations with our tools like TRN Bars or the Swing Suite.
How To Setup Head And Shoulders Pattern
The indicator is designed to identify shoulder head shoulder patterns using two distinct swing sizes. By default, the first shs swing size is set to 10, and the second shs swing size is set to 25.
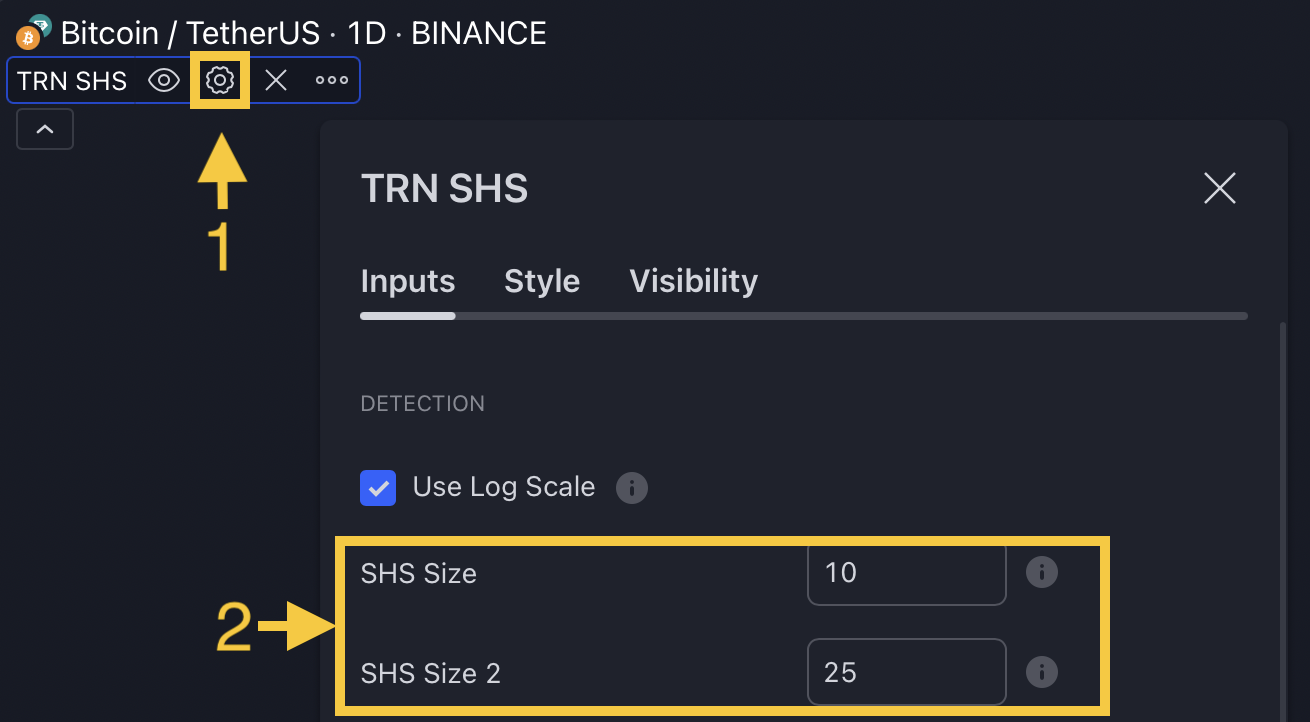
To modify the swing size, navigate to the indicator settings (1) and adjust the shs size in the "Detection" section (2).
A larger shs size corresponds to the detection of larger patterns, while a smaller shs size results in the identification of smaller patterns by our indicator.
How To Trade Head And Shoulders Pattern
1. Identify The Pattern
Add the Head And Shoulders Pattern indicator to your chart and look for the pattern on the asset and timeframe of your choice.
You can also use the alerts to easy getting notified when a pattern is in the making or gets confirmed on the Symbol and timeframe of your choice. Please check out our Alerts section to learn how to use them.
With our Market Scanner you can search for harmonic patterns on up to 40 different symbols at the same time. Just get notified when a pattern is found, breaks out or is confirmed.
Visit our Market Scanner section to see how it works.
2. Identify The Breakout Point
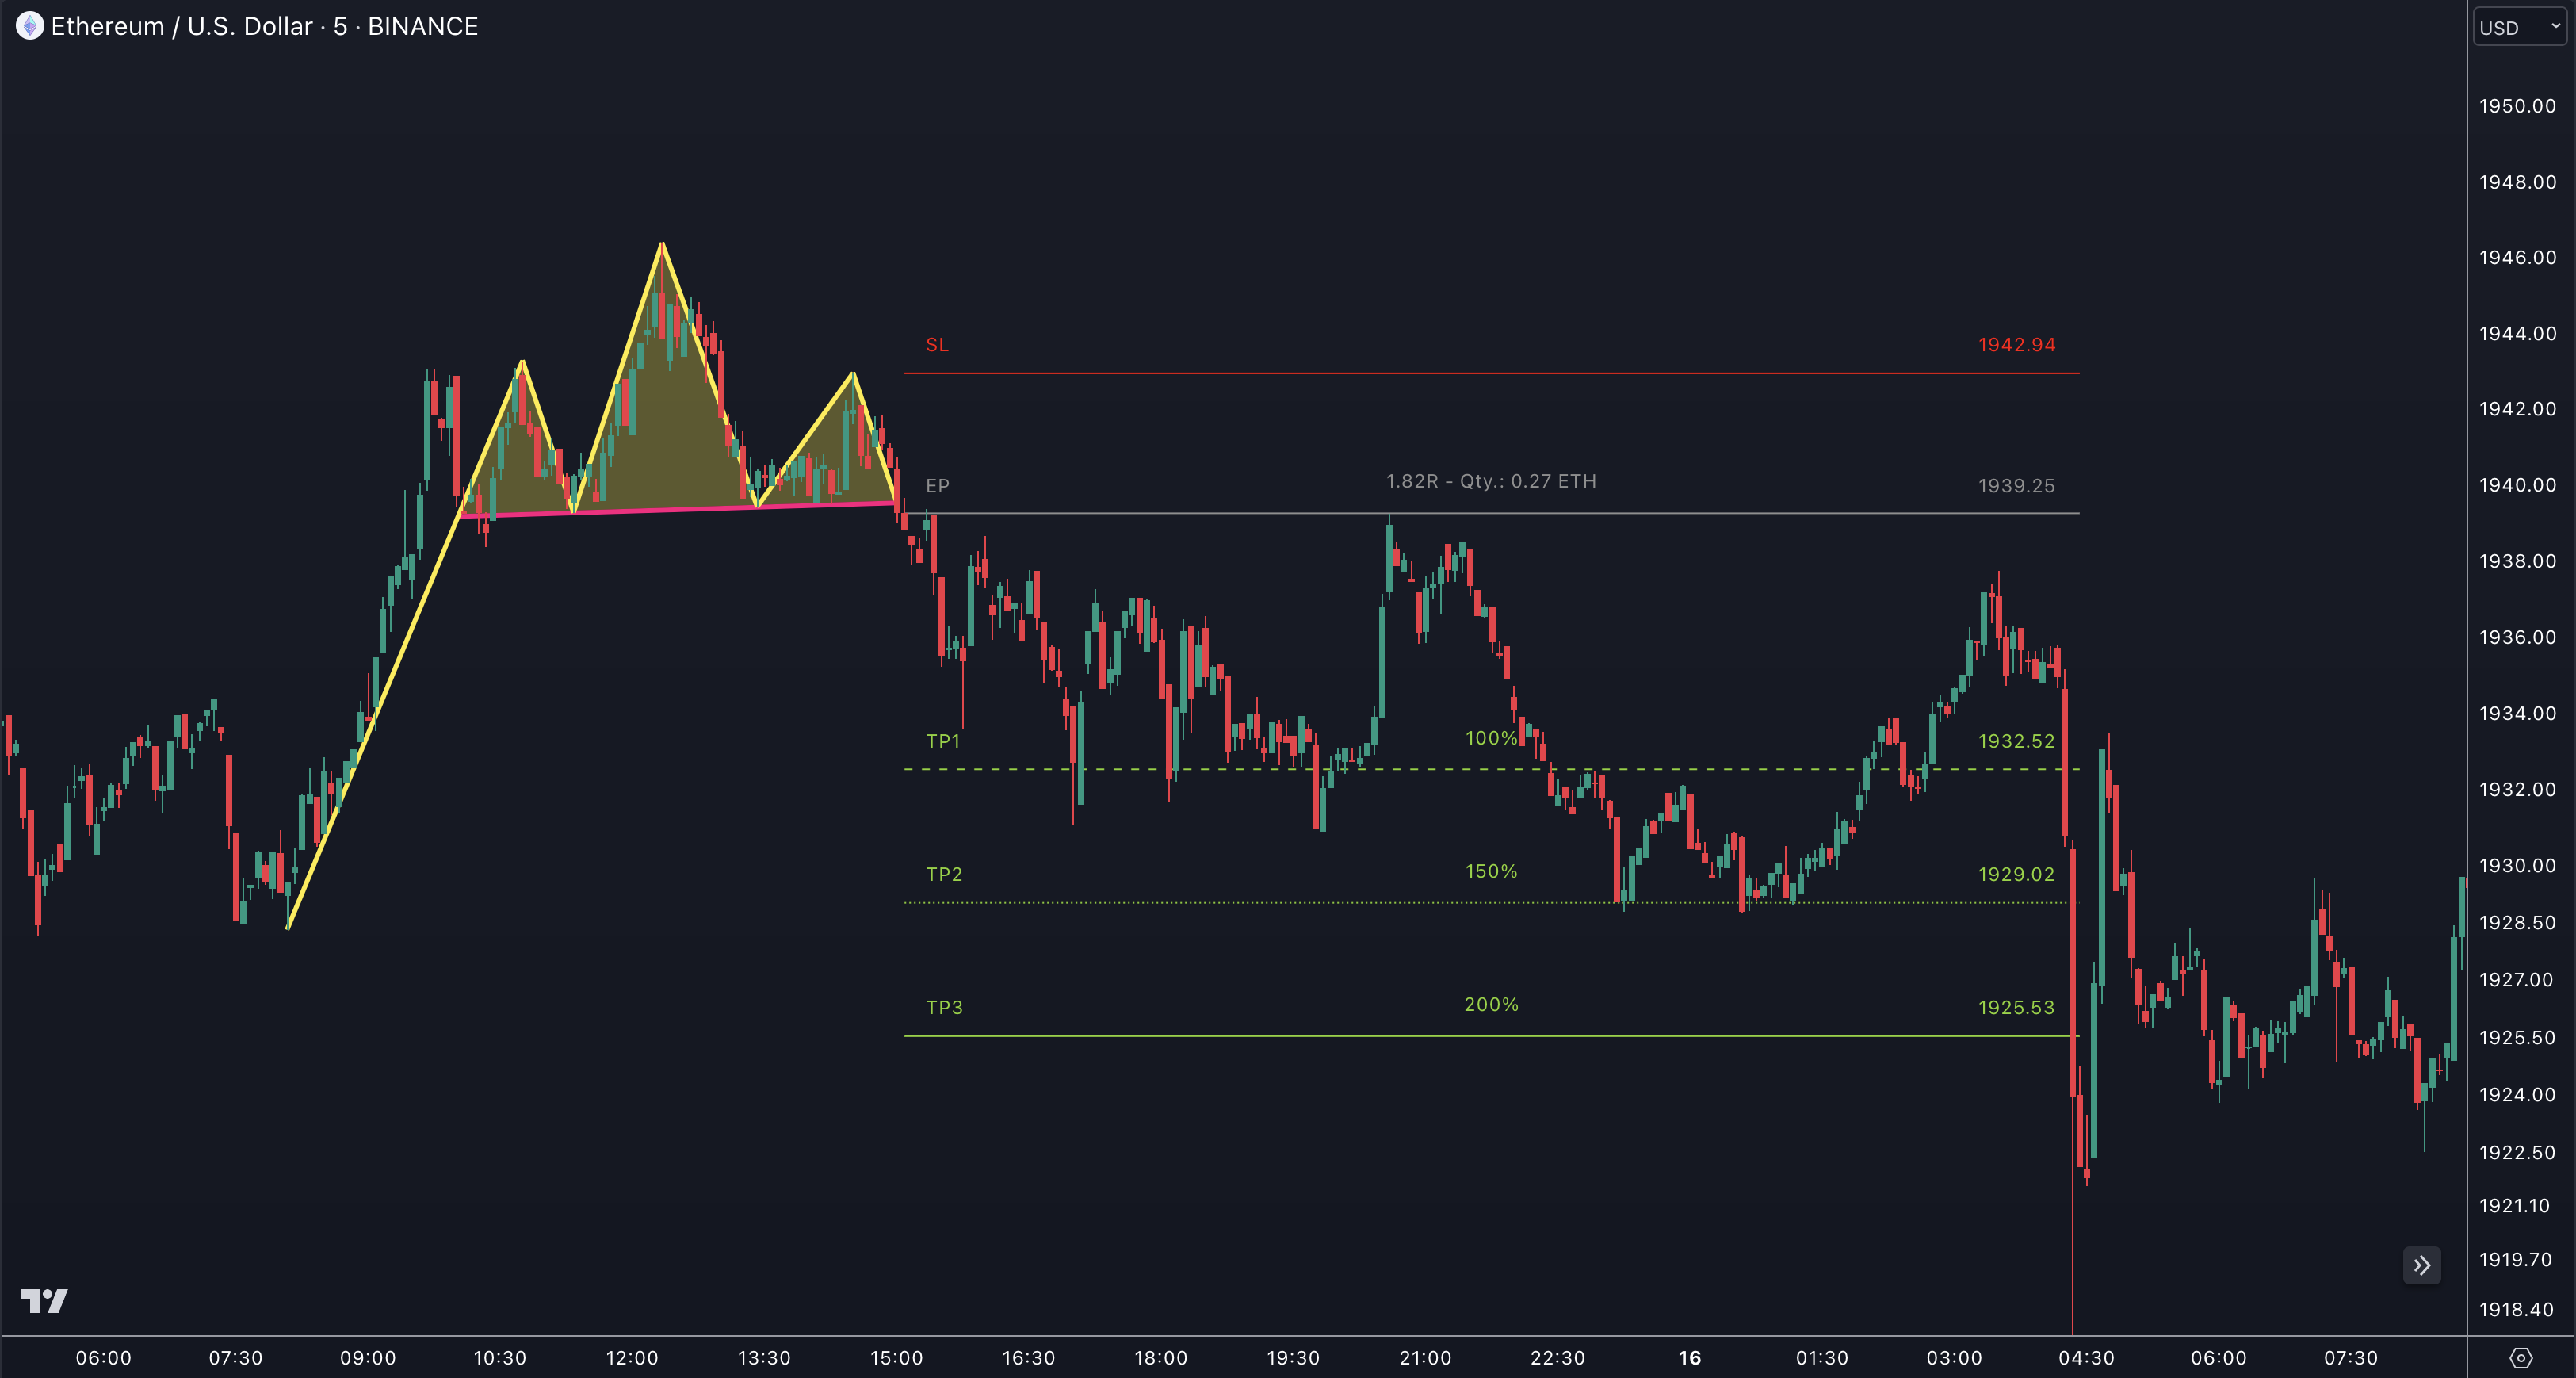
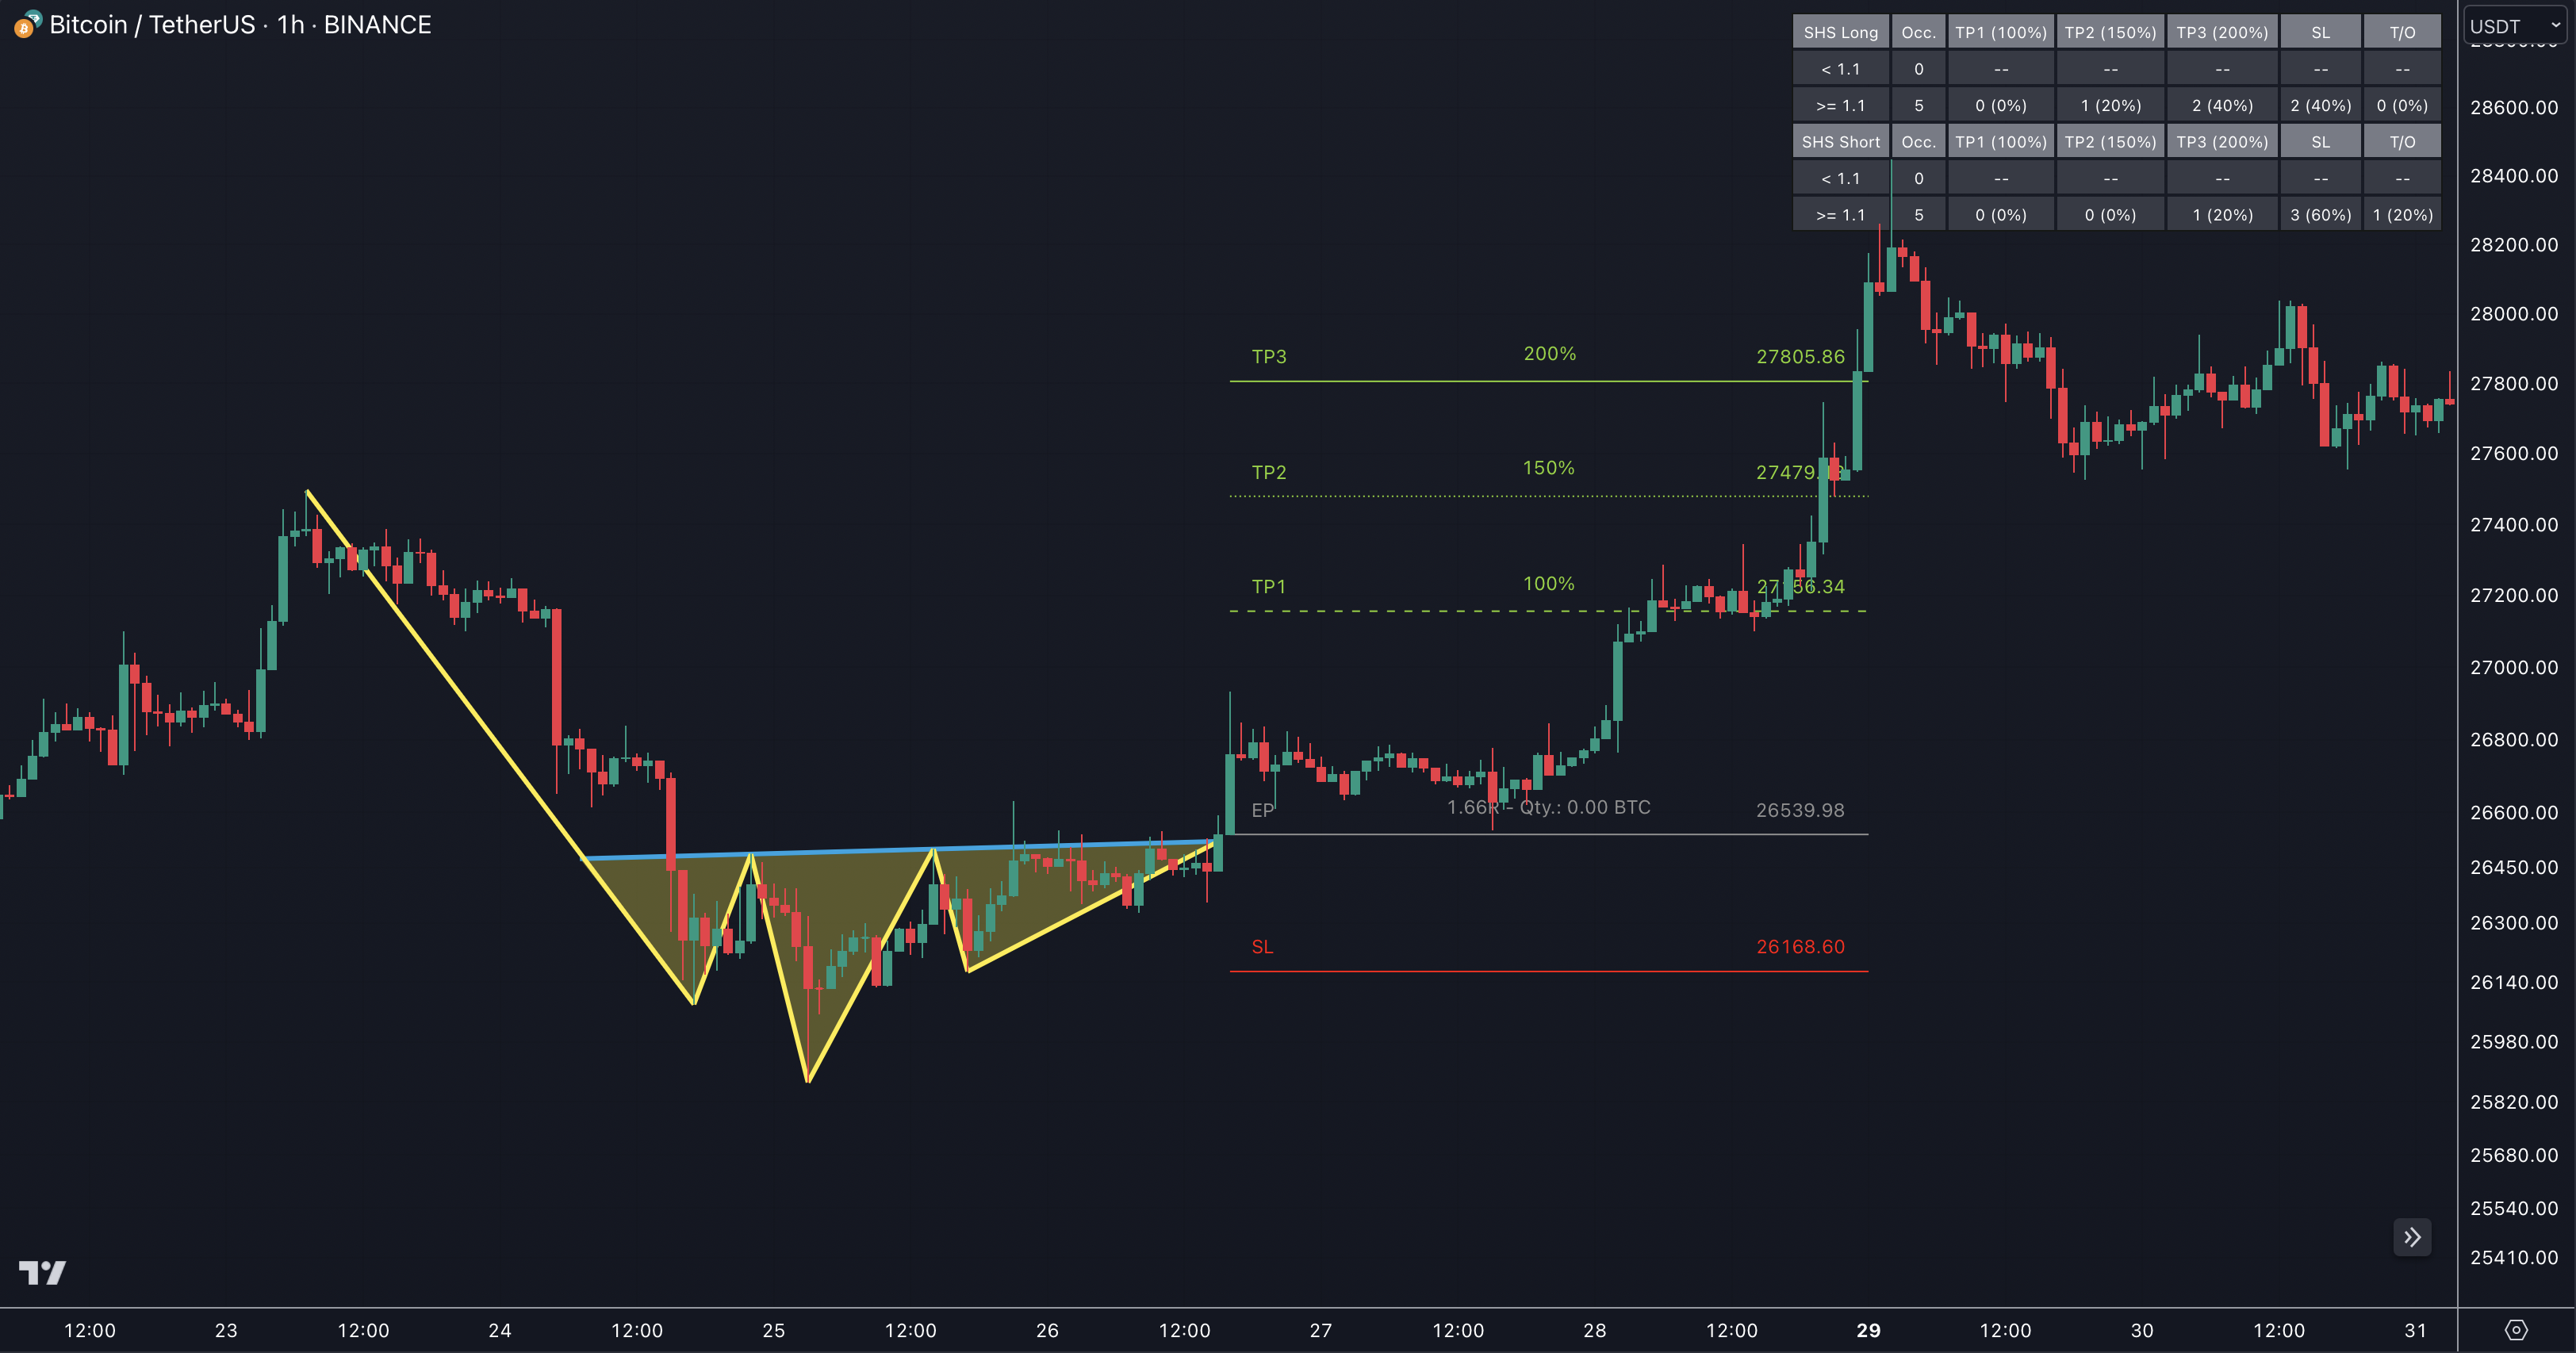
Look for the grey line (EP) at the point where the price breaks below the red neckline or above the blue neckline for the inverse Shoulder Head Shoulder pattern, indicating a trend reversal.
3. Place Your Order
Once the breakout point has been identified, place a sell order near the price level of the grey entry point line (EP) under the neckline or place a sell order near the price level of the EP line above the neckline for inverse Shoulder Head Shoulder patterns.
Our Pattern Statistics make it easy for you to see how successful a Pattern is on the Asset and timeframe you are watching. You should always check them out before entering a trade. Visit our Pattern Statistics section to learn how to use and adjust them correctly.
4. Set Stop-Loss And Take-Profit Levels
Set your stop-loss at the price level of the red stop-loss line (SL). Set your take-profit at the price level of one of the green take-profit-lines (TP1, TP2, TP3). Take into account that your risk/reward ratio (R) was calculated on the basis of TP1.
Enhance the precision and effectiveness of your stop-loss and take-profit orders by leveraging the Swing Statistics feature in our Swing Suite tool. Visit our How To Use Statistics section to gain valuable insights on how to utilize this tool to its full potential.
Use our build in Risk Management feature to optimize your trade. Check out our Risk Management section if you want to know the details.
5. Monitor Your Trade
Once you've entered the trade, monitor it closely. Adjust your stop loss and profit target as the price moves, and consider exiting the trade if the price starts to move against you.
Utilize the TRN Bars to effectively monitor your trades. Discover the inner workings of this tool by referring to the designated section How To Use TRN Bars.
It's important to note that not all shoulder head shoulder patterns will play out as expected, and there is always the risk of a false signal. As with any trading strategy, it's important to do your research, use risk management techniques, and have a solid trading plan in place before entering a trade based on the head and shoulders pattern.