Price Action Suite
The Price Action Suite incorporates price action and time concepts as well as Smart Money Concepts (SMC).
Features of the Price Action Suite:
SMC are a set of trading tools that, when combined together, allow for a more accurate view of the market. This enables traders to find more precise entry points before the price moves to the next liquidation level.
At its core, SMC is an interpretation of Price Action Trading. It utilizes proven trading principles but often gives them new names and places special emphasis on the underlying mechanisms. Essentially, it represents concepts that are already familiar to many traders, just in a different context.
Michael Huddleston, better known as "The Inner Circle Trader (ICT)," is often referred to as the founder of the Smart Money Concept. His approach aims to introduce traders to the nuances of the market, with a particular emphasis on strategies and philosophies surrounding Smart Money.
Market Structure
The market structure represents the dominant trend in the market. It is based on swing highs and lows. For instance if the price makes higher highs (HH) and higher lows (HL) the market structure represents an uptrend. Vice versa if price makes lower lows (LL) and lower highs (LH) the market trend is down.
If the market structure is up, traders can enter positions in a pullback.
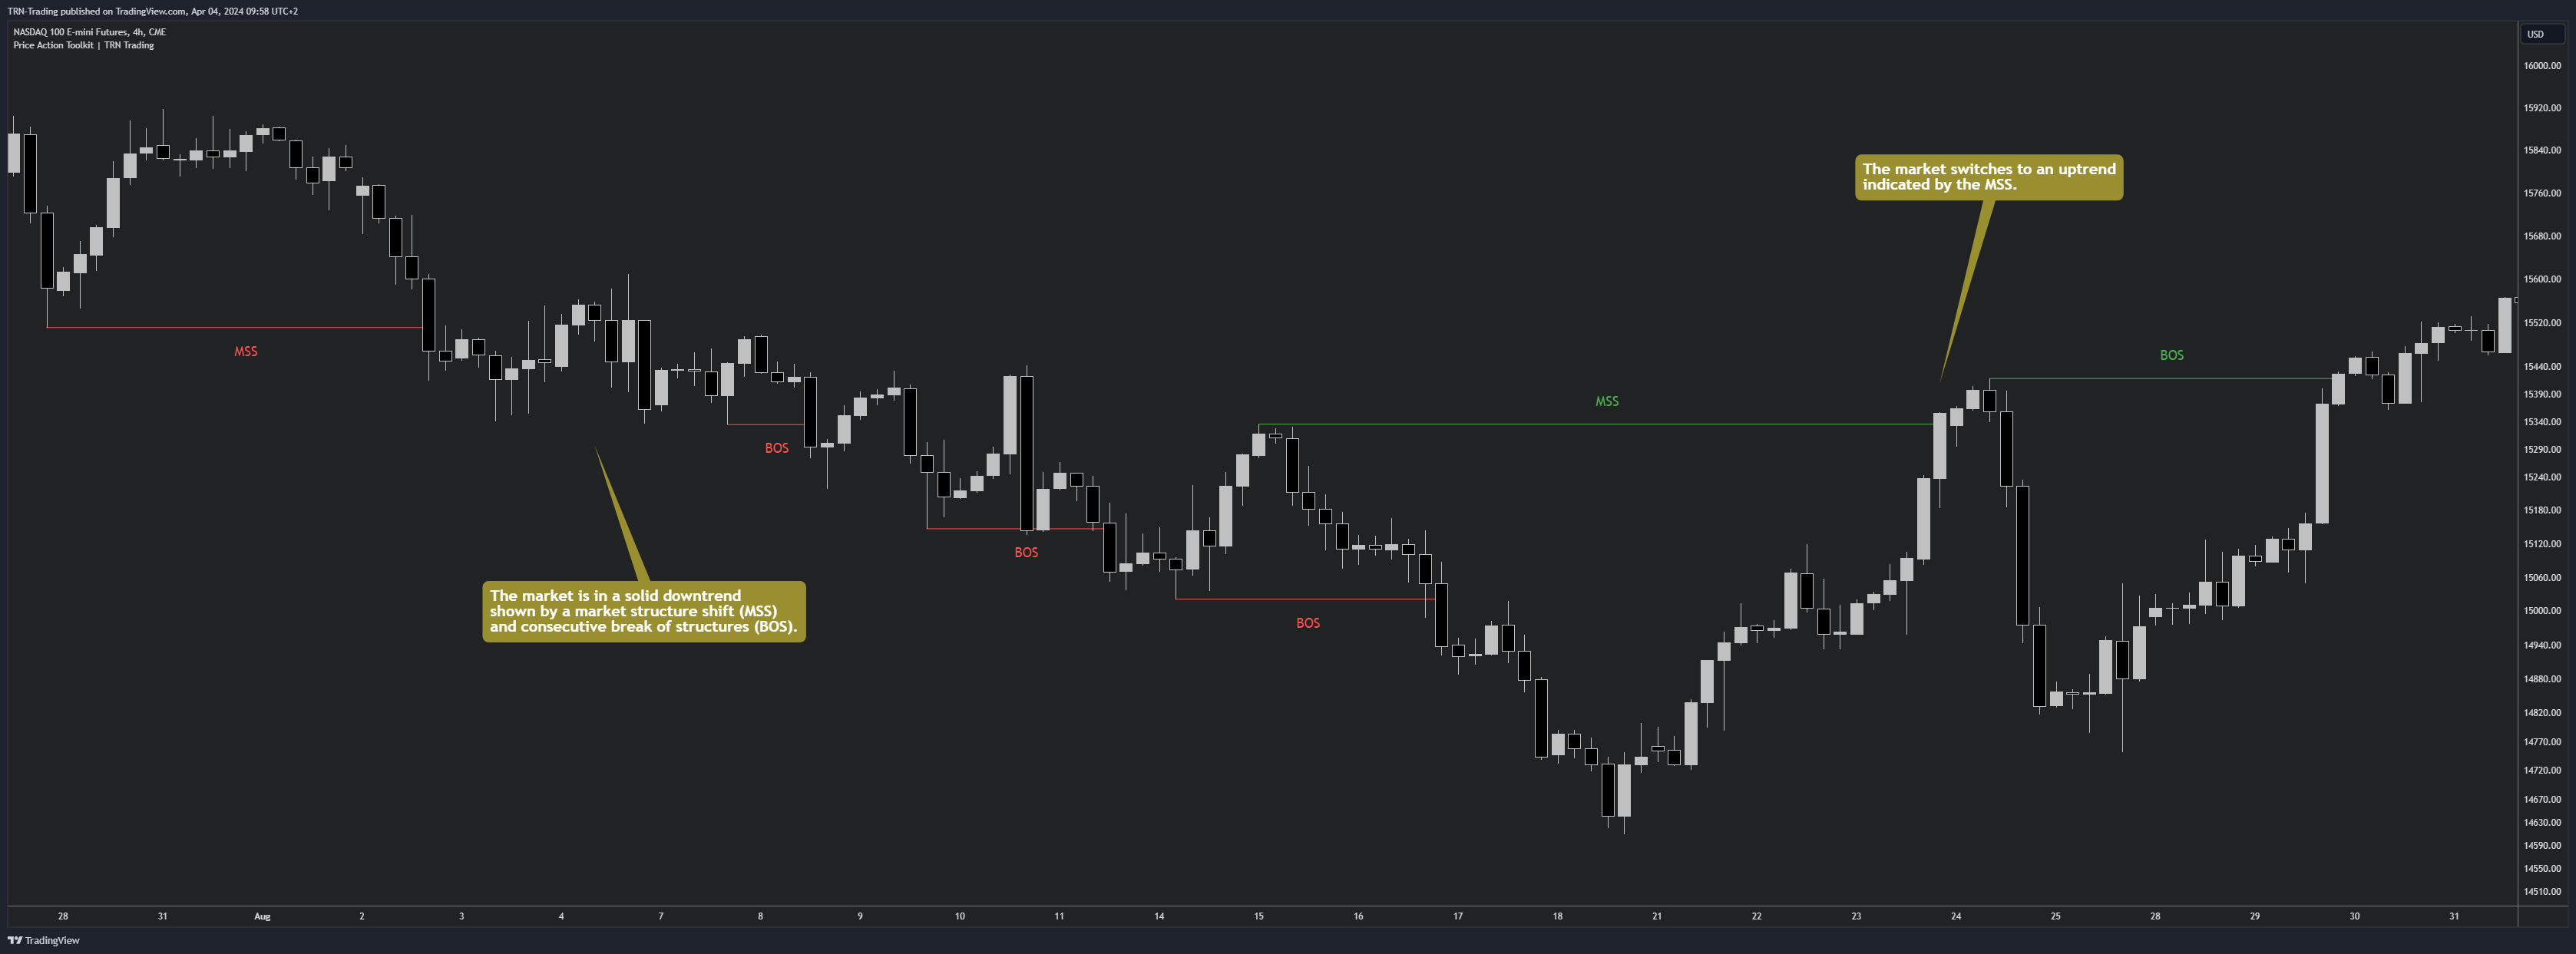
Market Structure Shift (MSS) (Change of Character (ChoCh))
A market structure shift occurs when the market transitions from one dominant trend to a different one, often signaling a potential change in the underlying market dynamics. A MSS signals the start of a new trend. It signals the change from an up trend to a down trend and vice versa. Therefore, it is sometimes called change of character (ChoCh). A valid MSS should ideally occur in a strong supply or demand zone. This indicates that the market may be approaching a trend reversal or consolidation.
Break of Structure (BOS)
A break of structure happens when the market breaks out of its established trading range or pattern. The market continues its dominant trend, indicated by the last MSS.
In an uptrend, for example, each time the price breaks through a new high, a "bullish BOS" is formed. This indicates that the market is capable of overcoming previous resistance levels and continuing to rise.
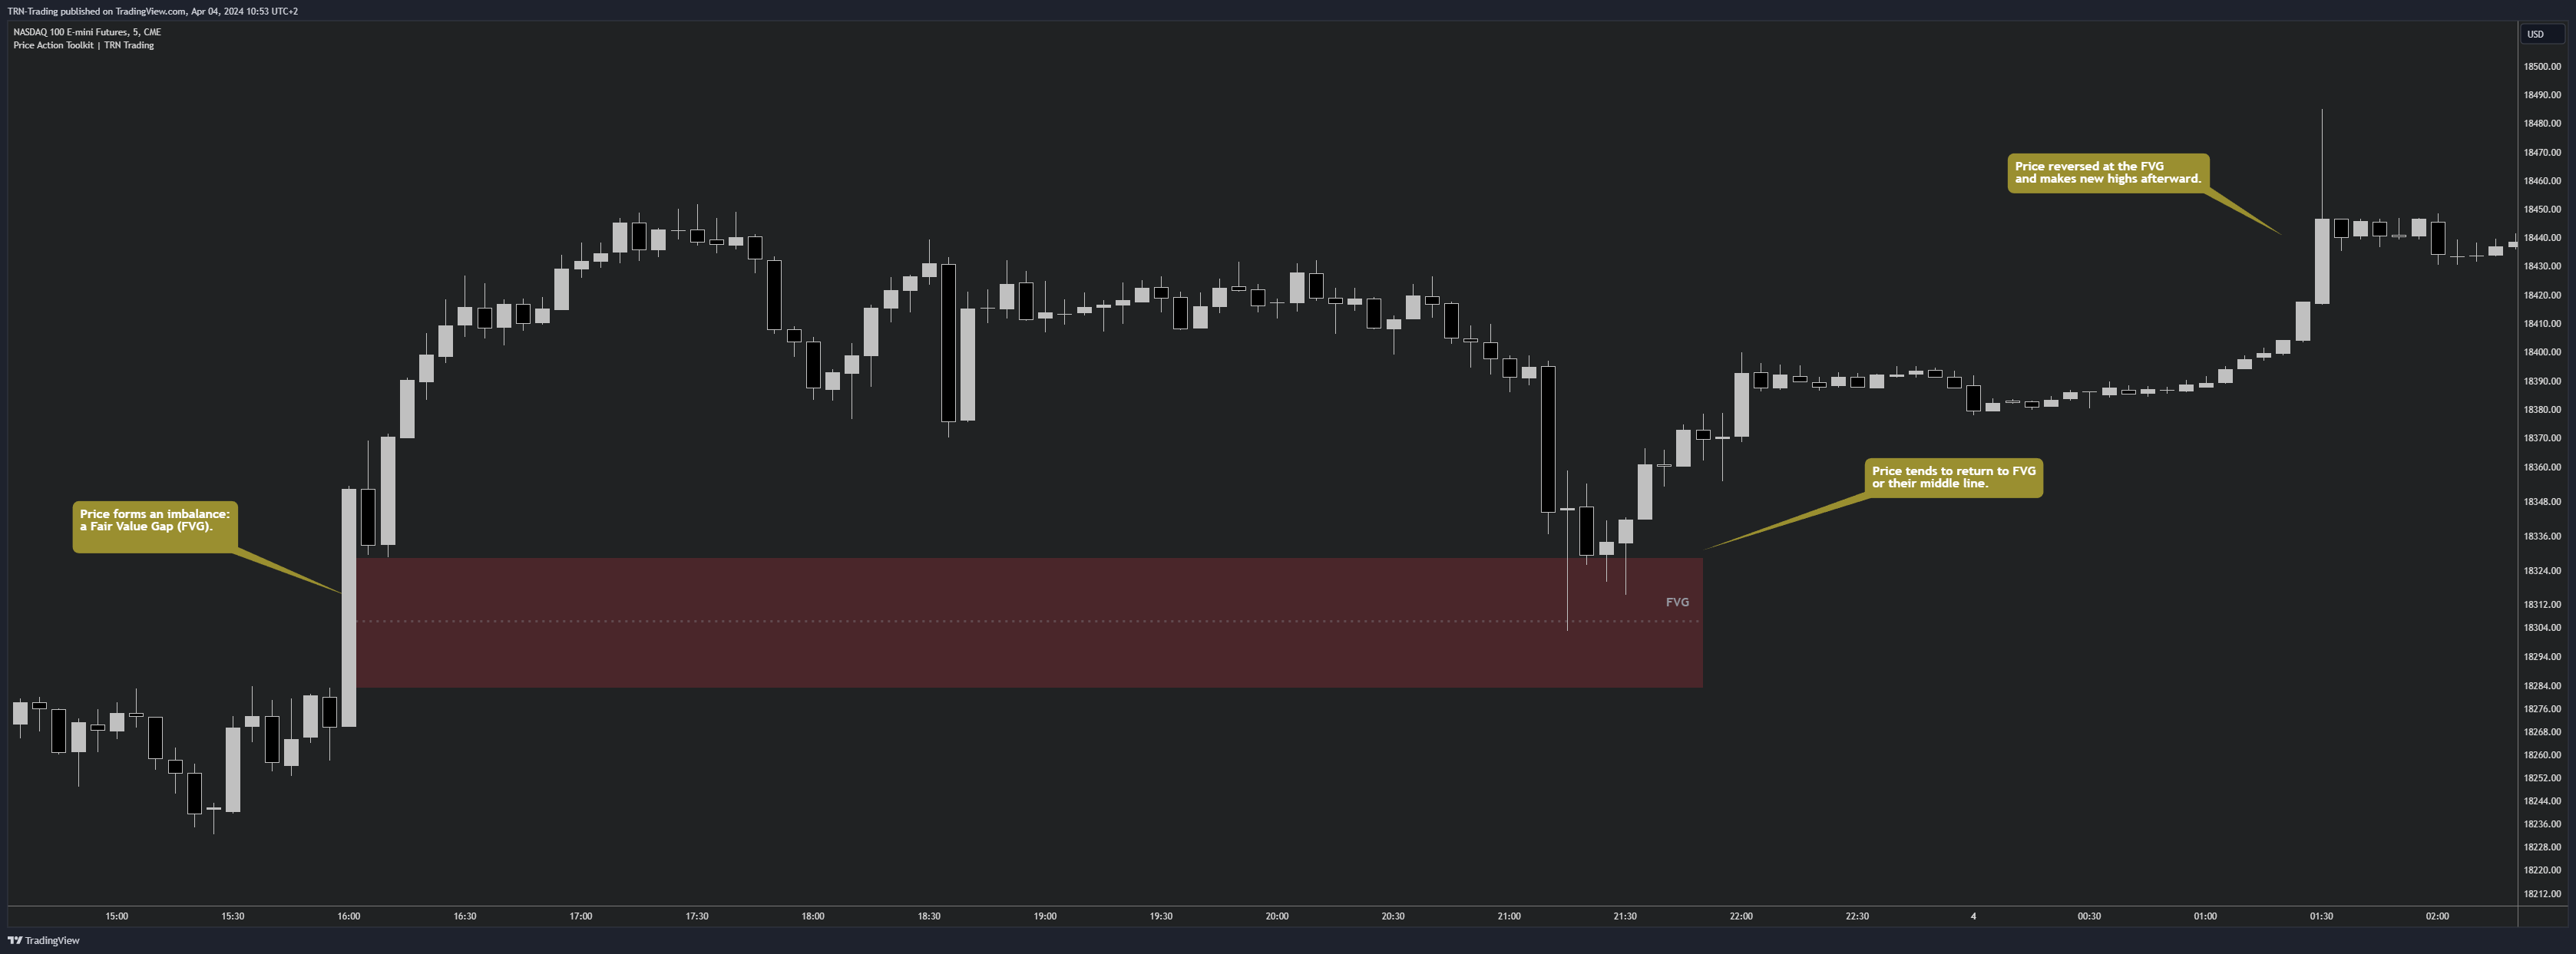
Fair Value Gaps (FVGs)
A fair value gap occurs when there are inefficiencies in the market or imbalanced buying and selling pressures. Fair value gaps can become a magnet for the price before continuing in the same direction. Special attention should be paid to FVGs that are supported by support and resistance levels, as these offer a higher probability of success for trades.
In addition to the FVGs you see on the chart, you can add also FVGs from a higher timeframe. For this you can set Timeframe 1 and Timeframe 2 to your preferred timeframes. E.g. you trade on a 5 minute chart and also want to see FVGs from a 4 h and daily chart, then you set Timeframe 1 to 4 h and to Timeframe 2 to 1 D.
Order Blocks and Volume Imbalances can also be shown from higher timeframes.
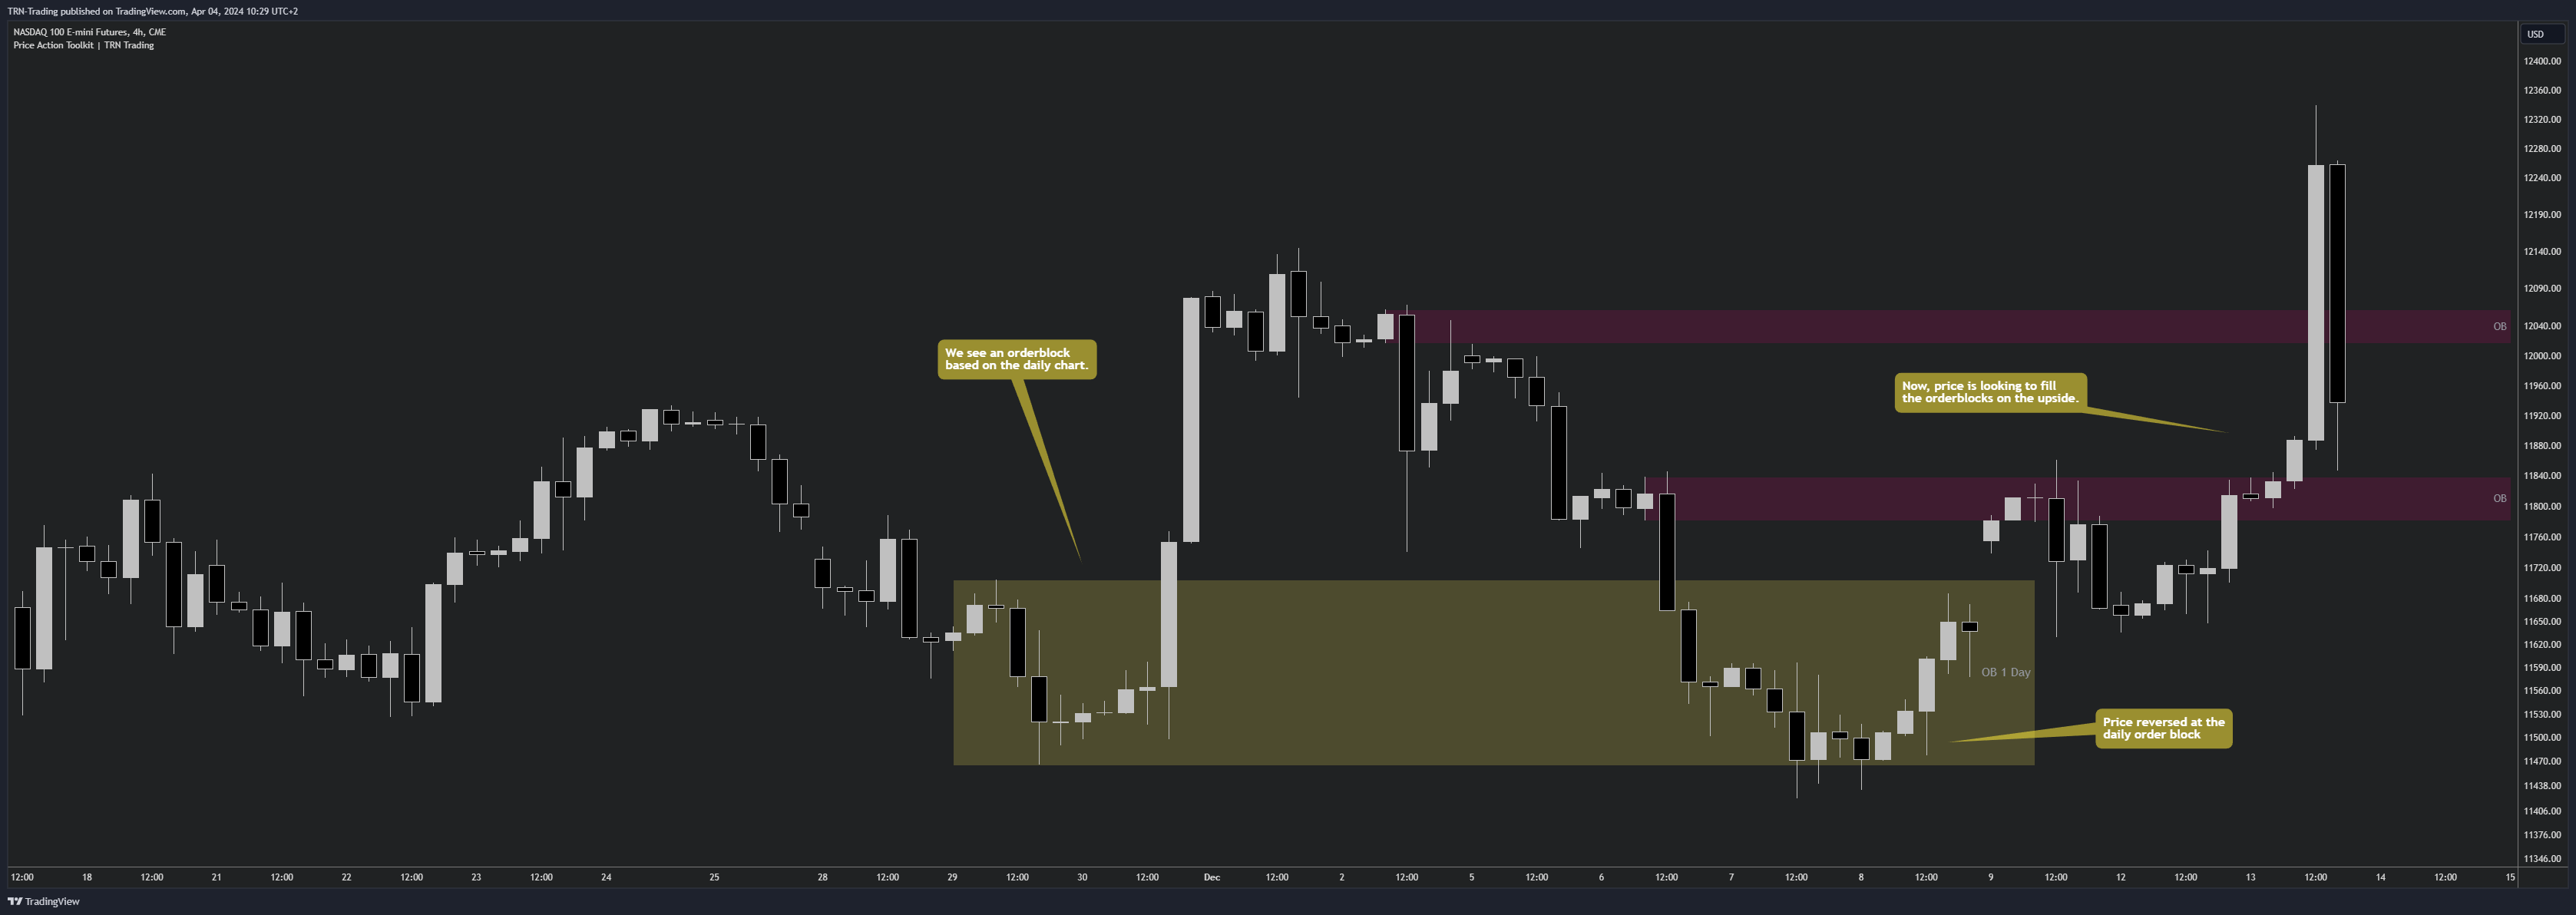
Order Blocks (OBs)
Order blocks are areas on the chart where a high concentration of limit orders was found in the past. They can serve as potential support or resistance areas. These represent areas in the market where there is an oversupply (supply) or an excess demand (demand). They are often key zones for potential turning points or continuations of the current trend. A bullish OB, for example, is the last bearish candle before a significant uptrend.
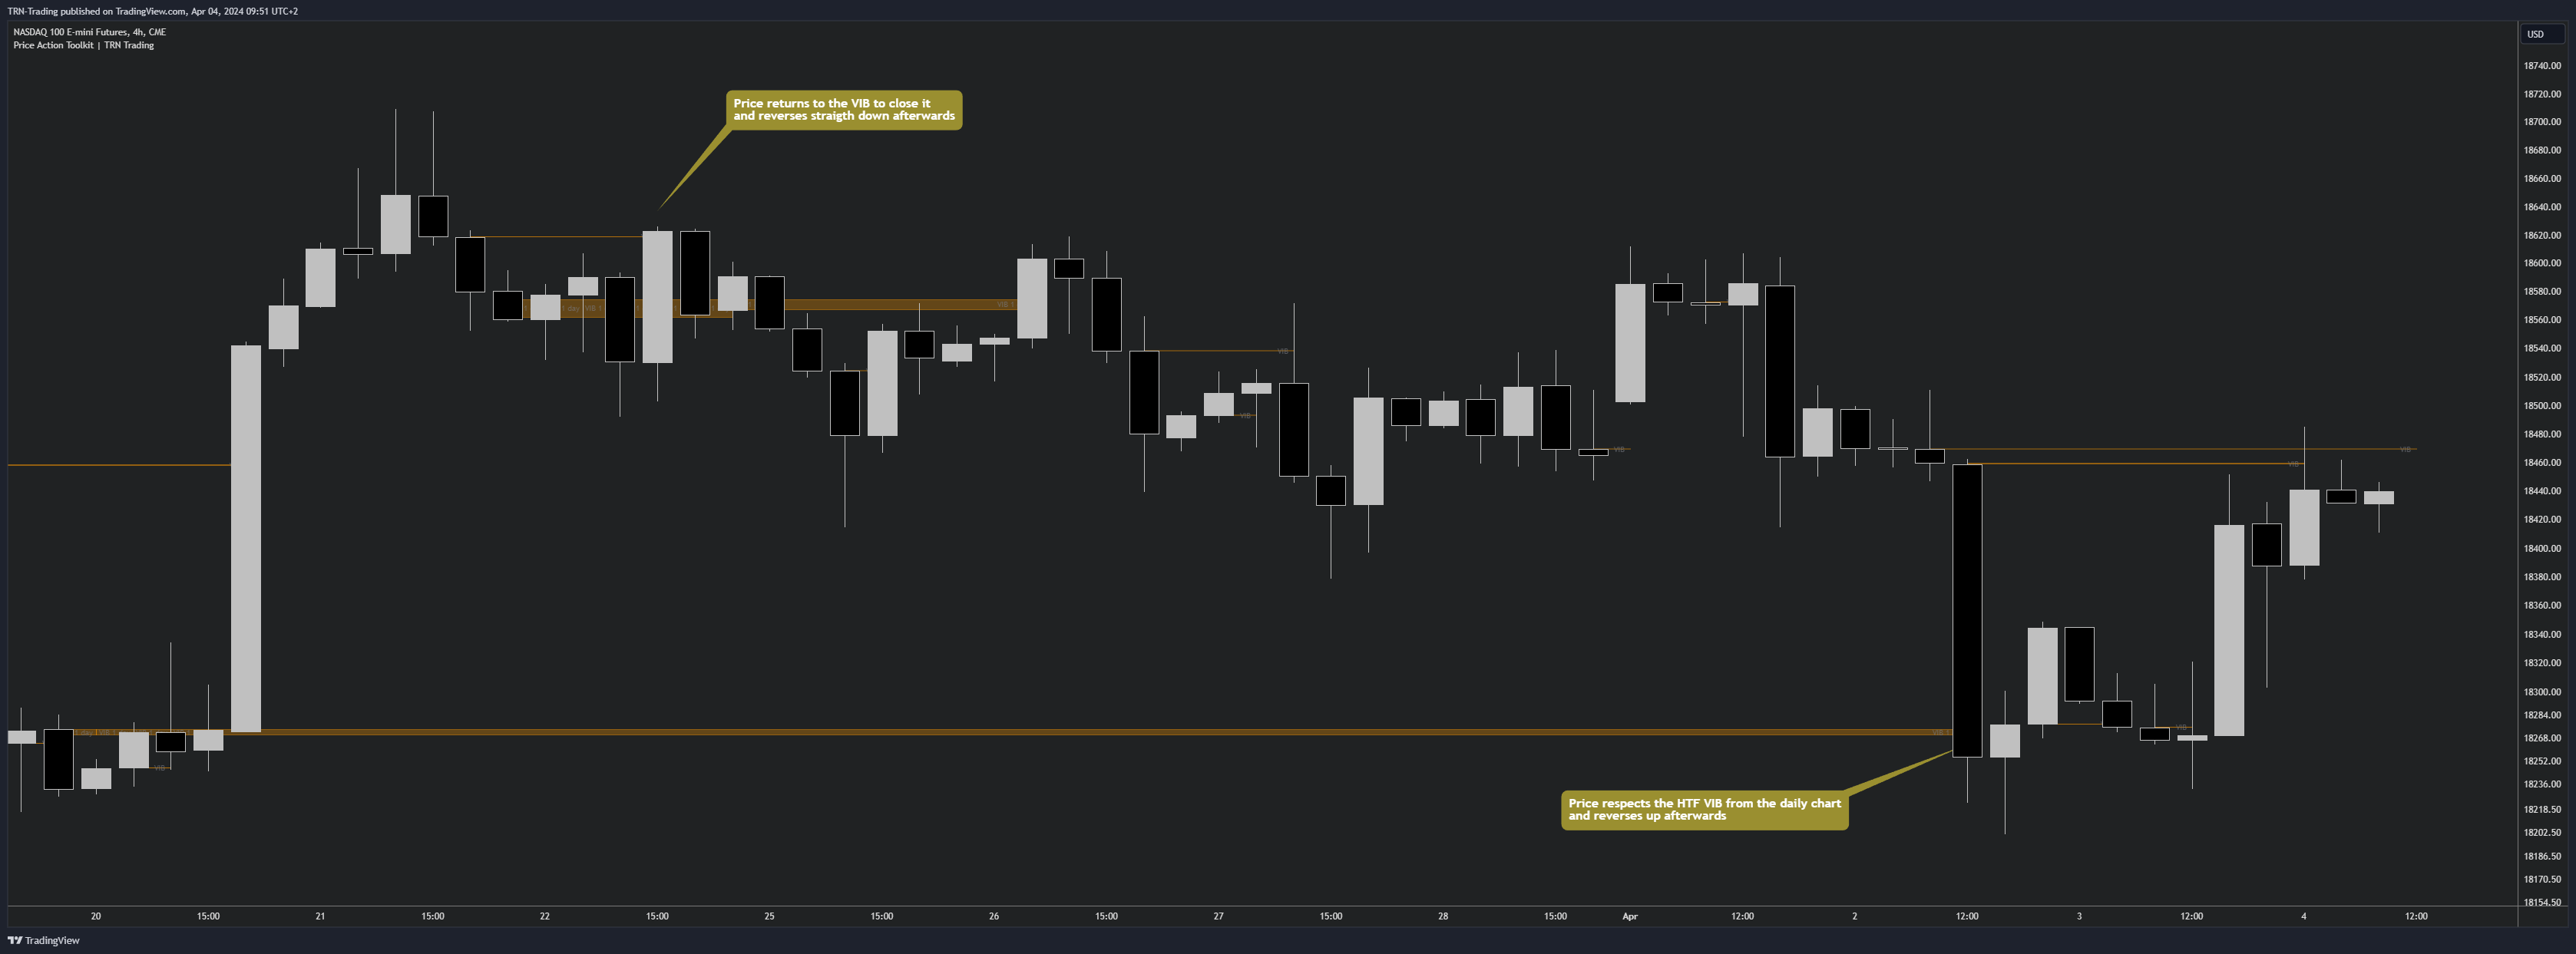
Volume Imbalances (VIBs)
Volume Imbalances indicate a price gap from the previous close, but unlike gaps, there is no absence of trading activity within a specific price range. Bullish VIs have opening and closing prices above the previous close, with overlap between the current low and previous high. Bearish VIs are vice versa.
Levels
One core concept in SMC is that price flows to areas of liquidity. Natural liquidity areas are the current day open, high, low (CDO, CDH, CDL) or the previous day high, low, close (PDH, PDL, PDC). The same is true for the current week (CWO, CWH, CWL) and the previous week (PWH, PWL, PWC).
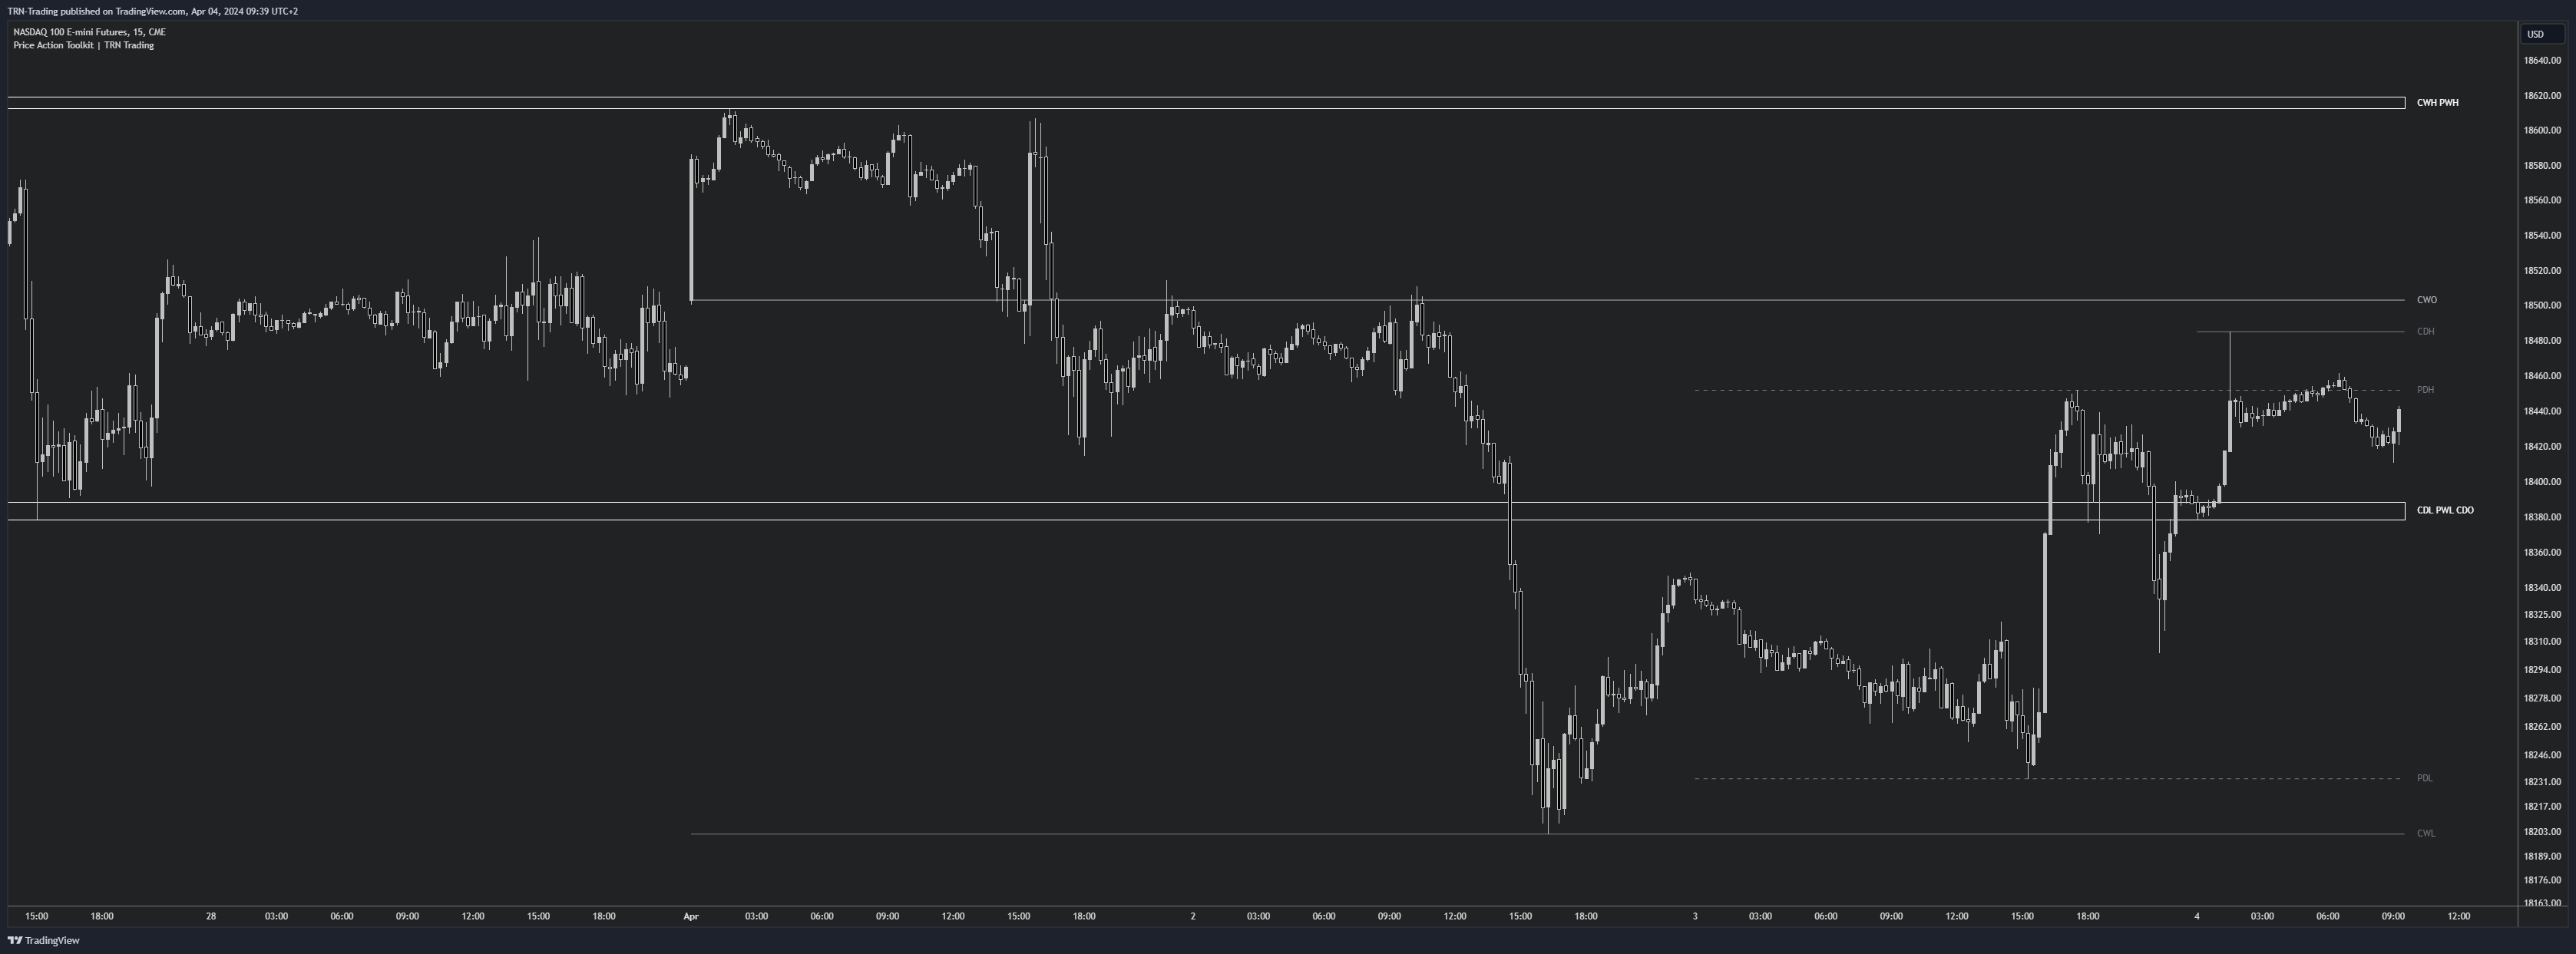
Pay special attention in case some of these levels are close together. Then these levels serve like a magnet for the price. The TRN Smart Money Concepts indicator is able to cluster these levels fully automatically together to give the trader the flexibility to focus solely on the trading part.
Sessions
Sessions are the trading hours during which the banks are actively trading. The three main trading sessions:
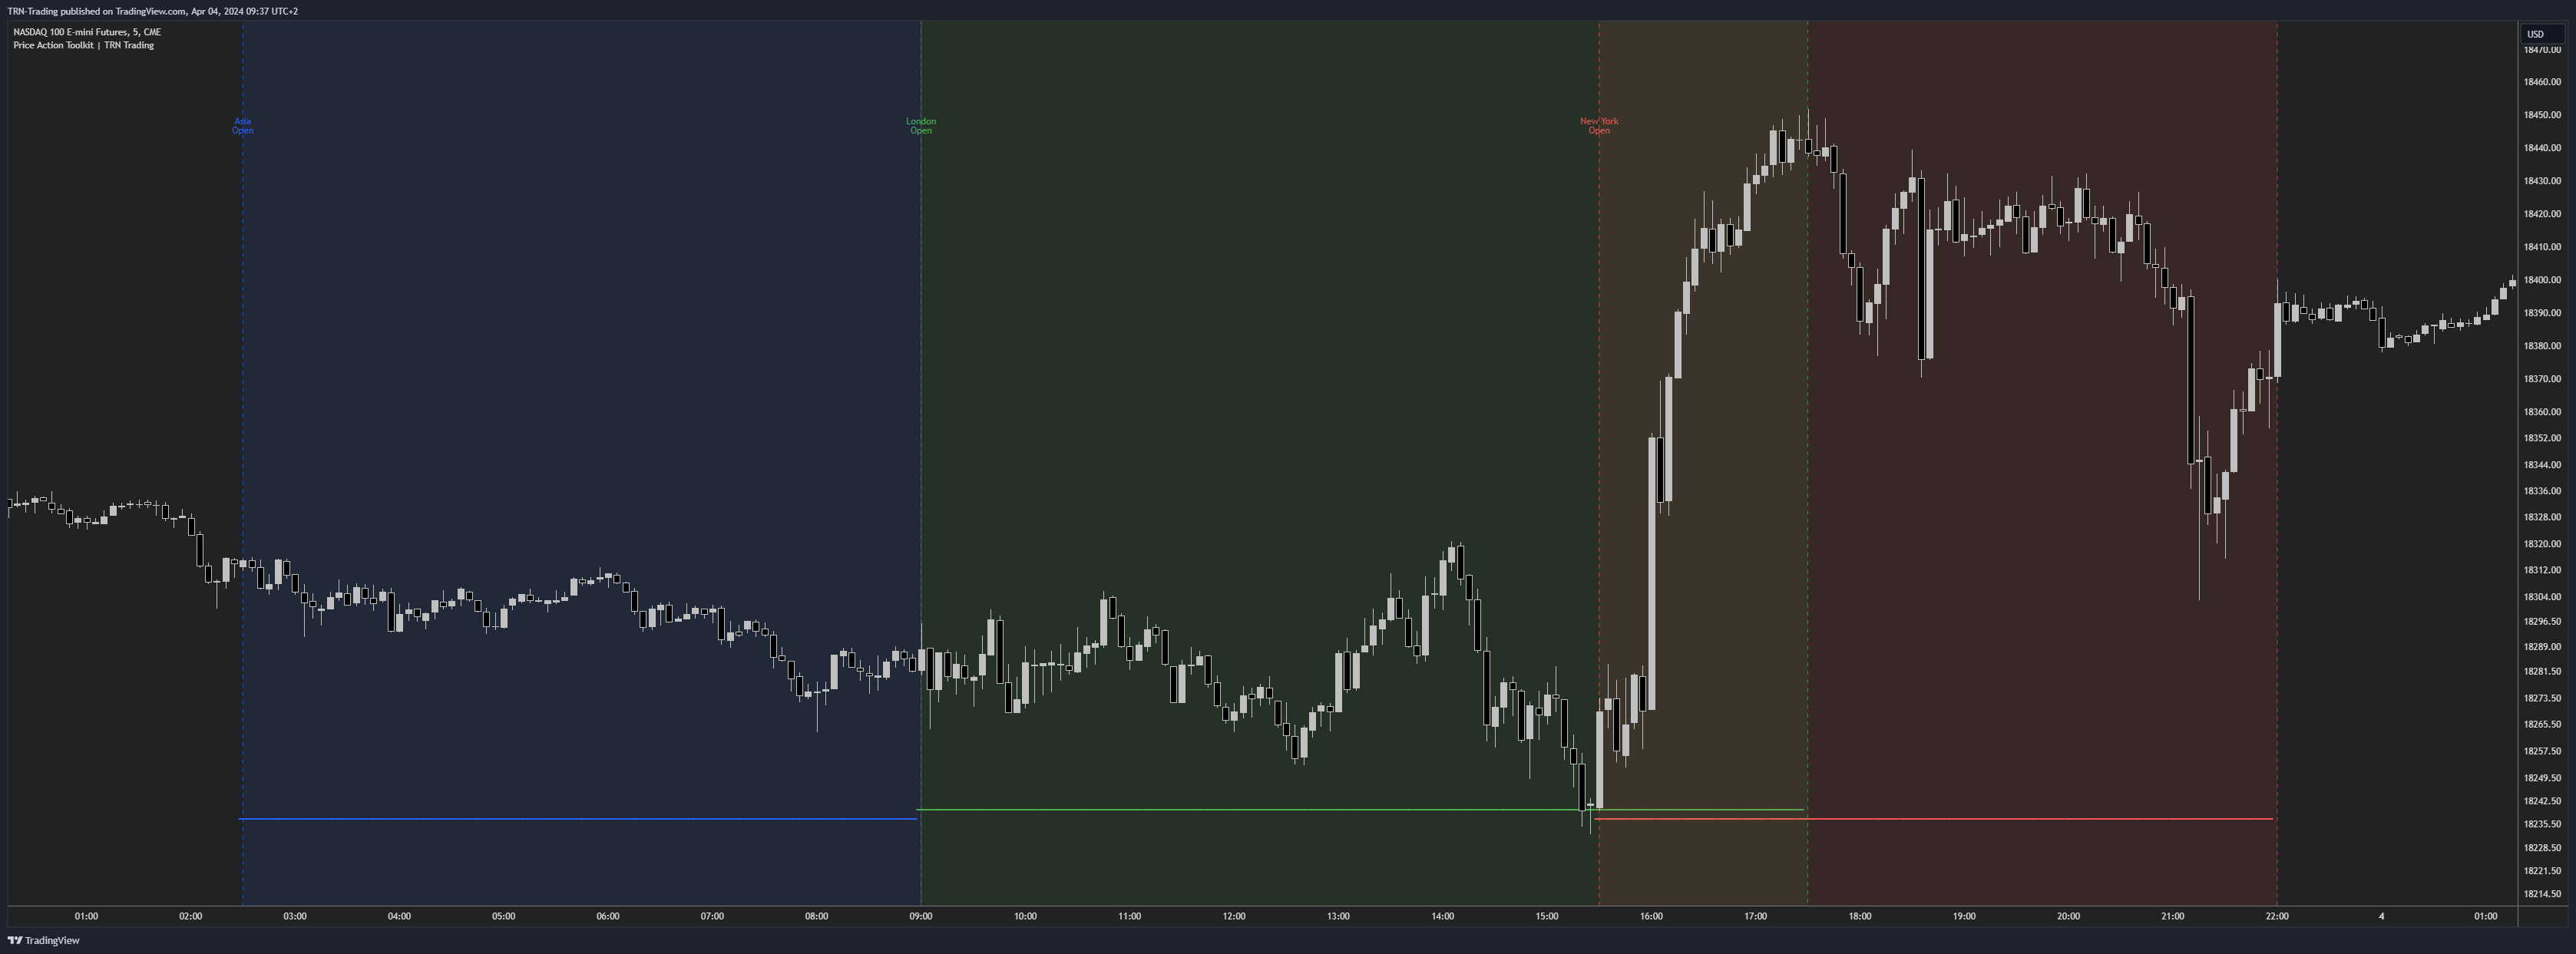
Asia: Most of the volume from the asia players are handled within this session.
London: This is were the european player are most active.
New York: In the New York session all the USA players are active as well as all the other American players. Furthermore, a lot of global players active in this session as well.
Killzones
A killzone in trading refers to a specific time period during the trading day when the market experiences increased volatility and liquidity. It is an opportunity for traders to capitalize on potential price movements and generate profits. There are several different killzones during the day.
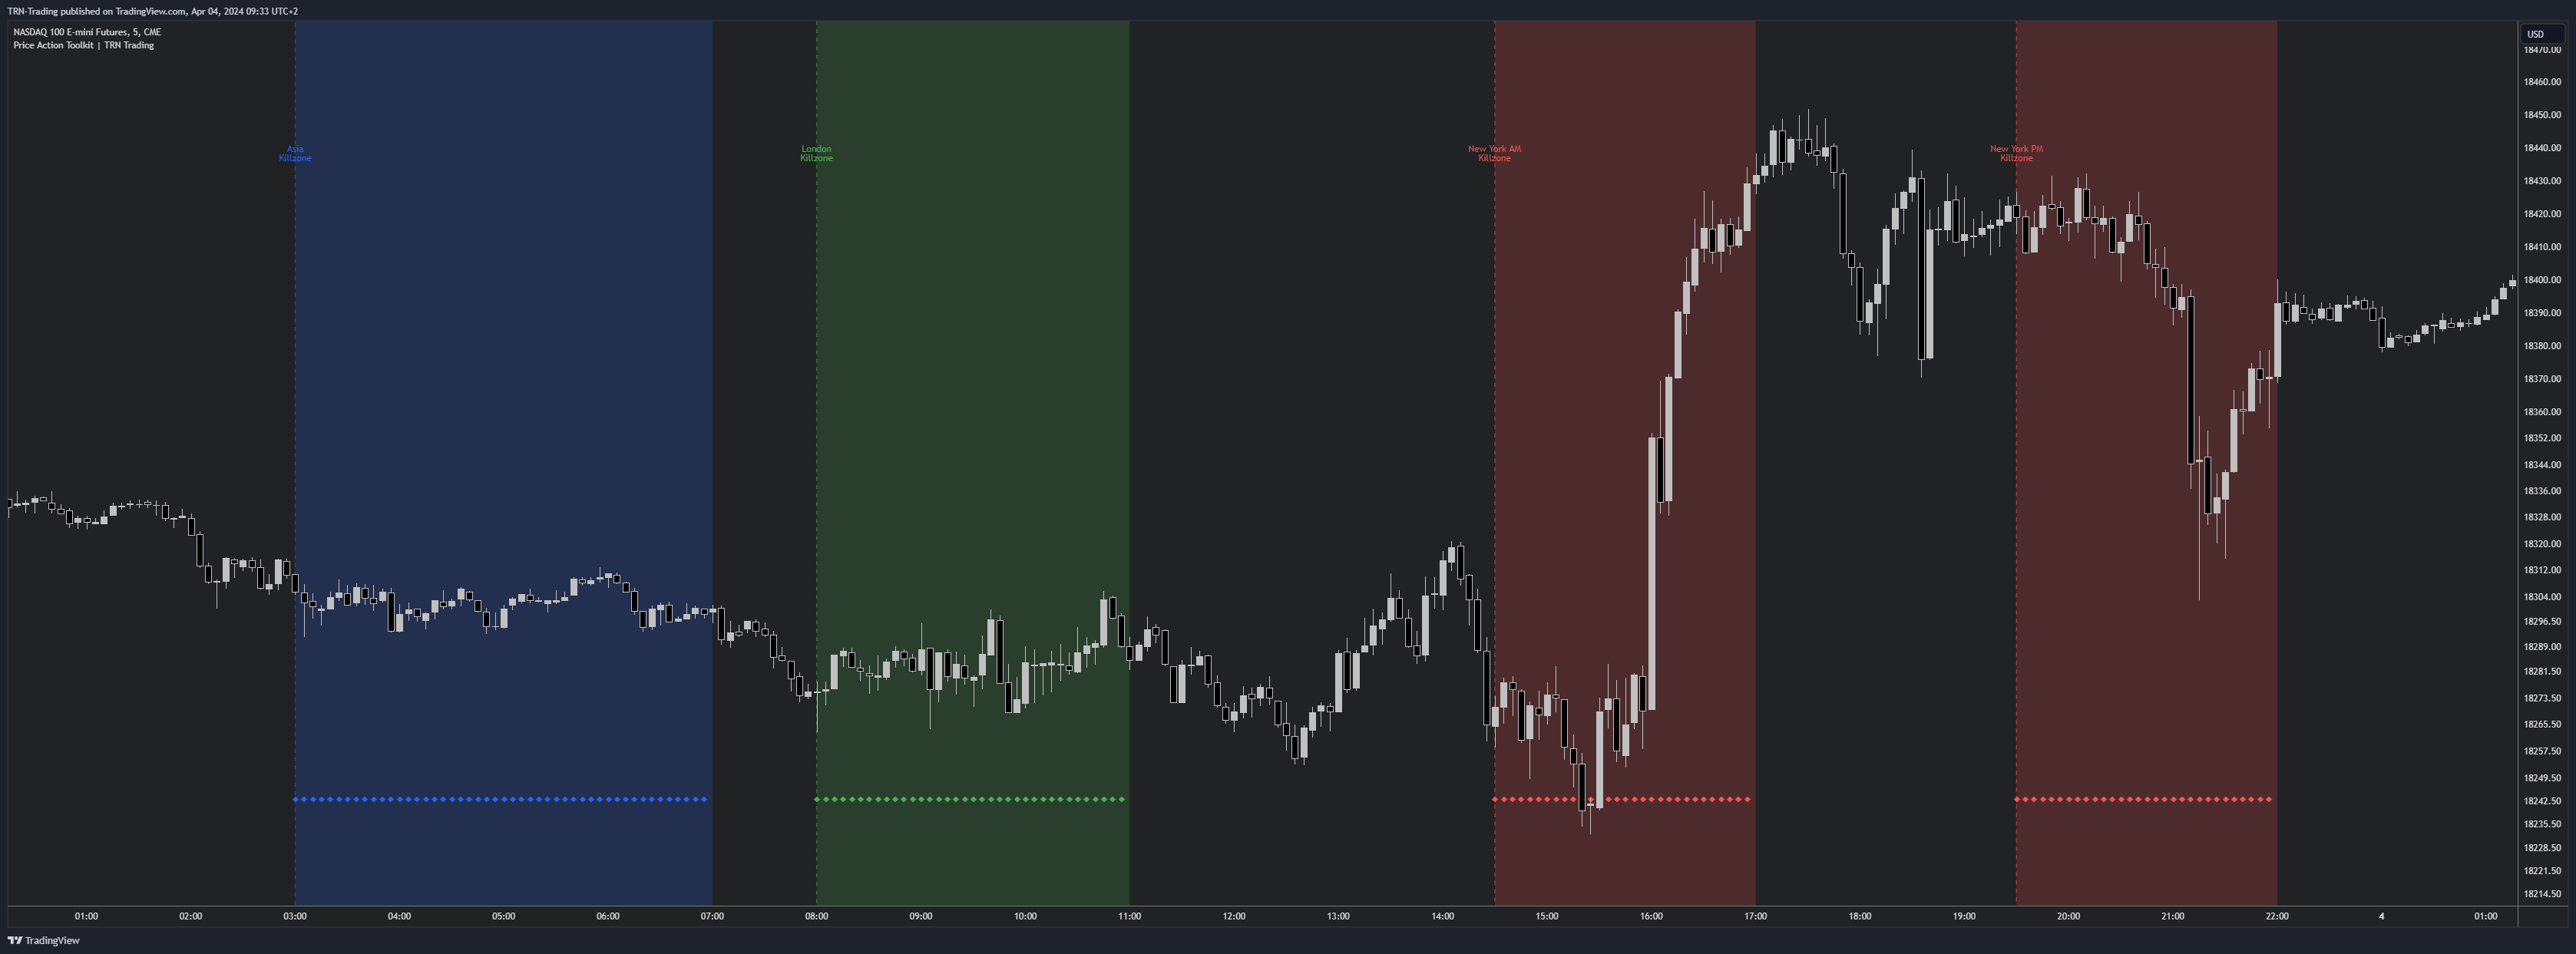
There are three different types of killzones:
Indices/Futures: This one is suitable if you trade products like the ES, NQ, FDAX, CL or Stocks, Options.
Forex: If you trade Forex this setting will mark the most liquid periods of the day.
Opening Range: In case you trade the opening range of the sessions, use this setting.
Strategies & Models (simplified)
Here you can find some simplified SMC strategies, which were introduced by ICT and his community.
These simplified models serve as a base. In practice, this strategies are often combined with other techniques to confirm entry points and refine the stop loss. For example, multi-timeframe analysis, which you can easily switch on in the indicator with the Timeframe 1 and Timeframe 2 settings.
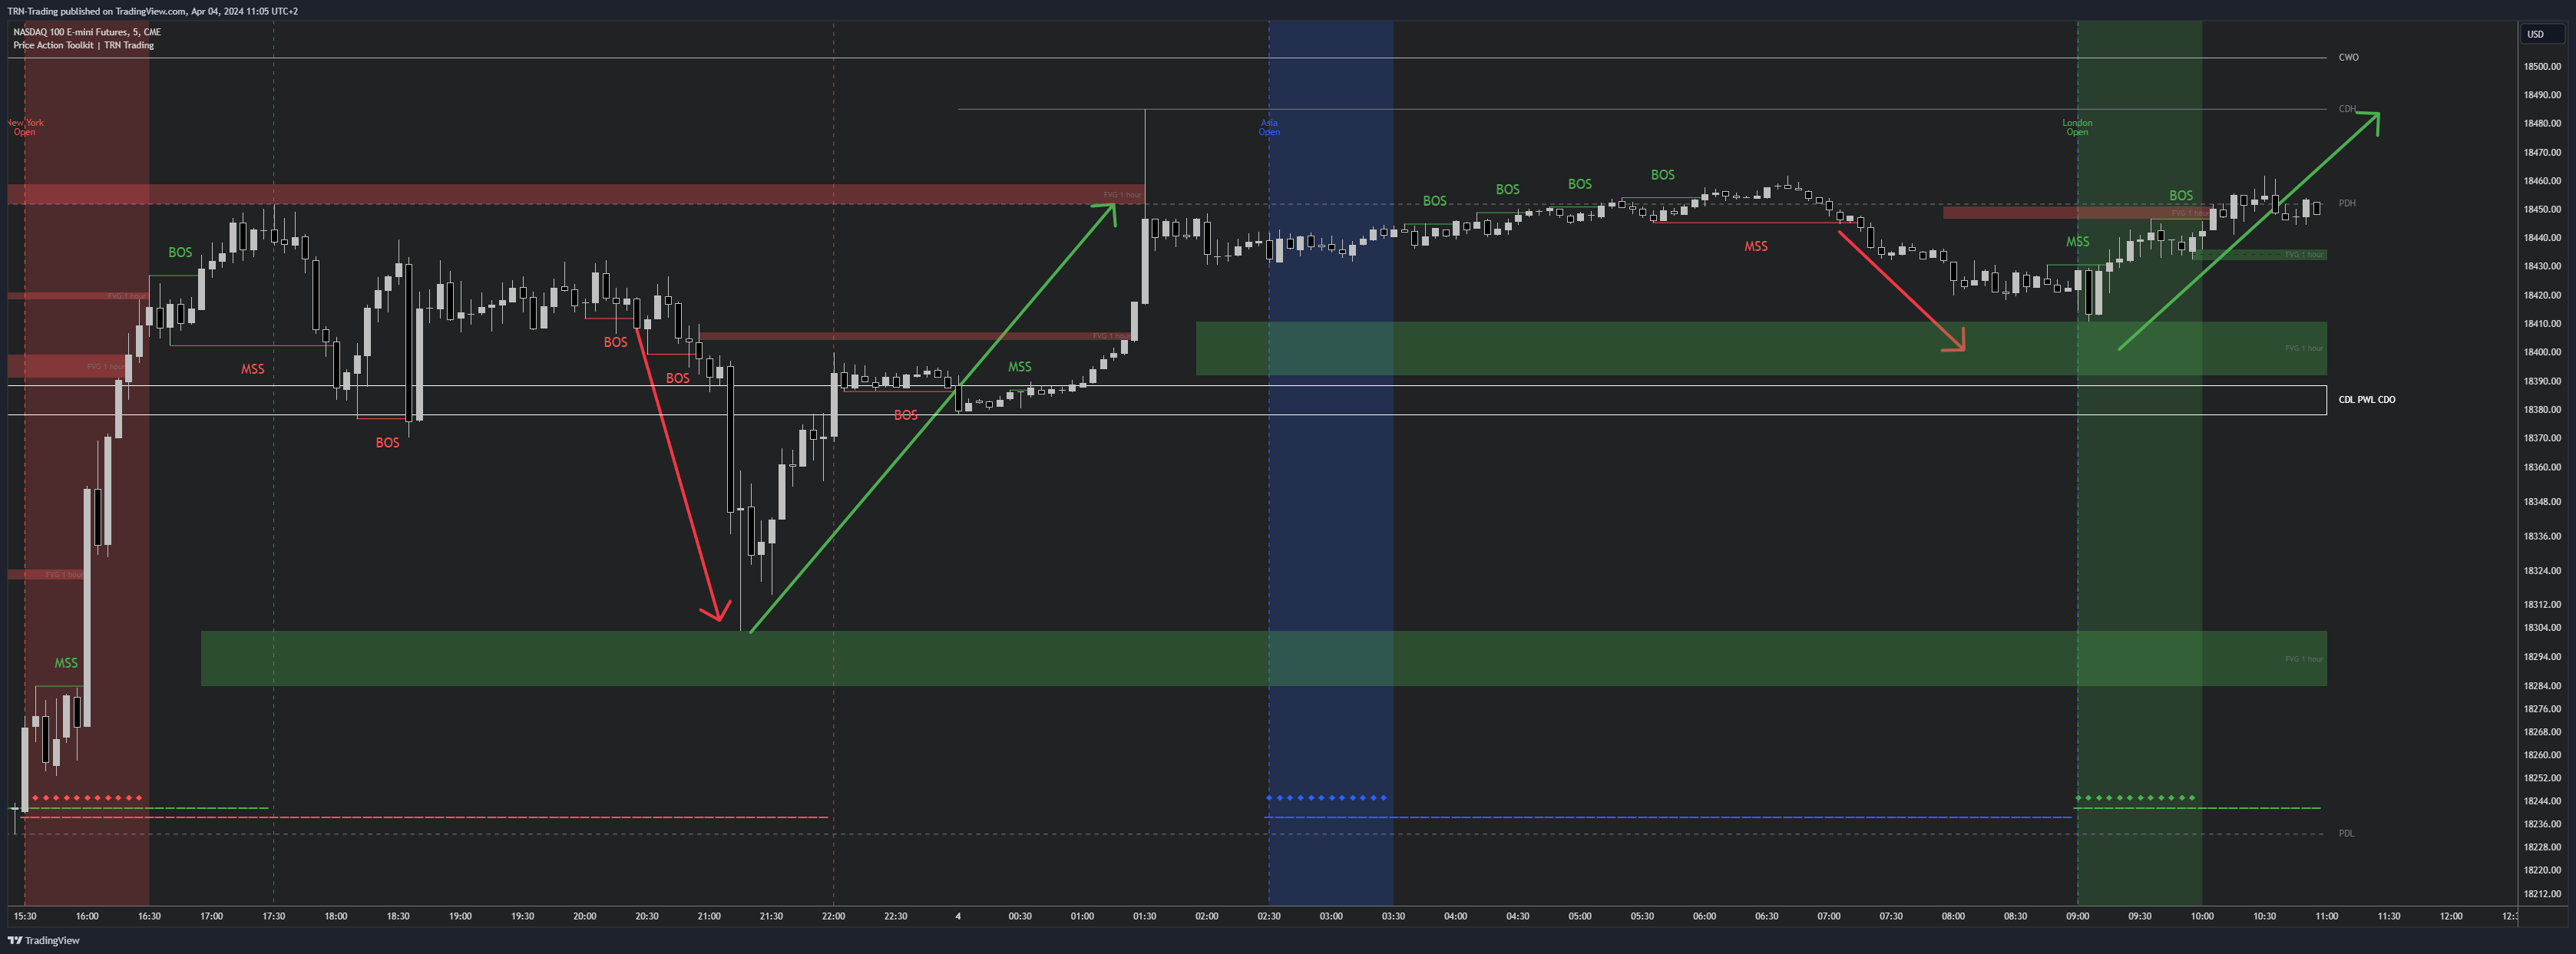
Silver Bullet
1. Time analysis
First, determine that we are in a killzone.
2. Price analysis
Identify an interesting higher timeframe zone (FVG, OB,...) were price reverses. Afterwards the price should make a new market structure shift. On its way to the MSS it should form a fair value gap.
3. Trade entry
Set a limit order at the identified fair value gap in the direction of the trend. Place a stop-loss order below (for long trades) the last swing to limit your risk (above for short trades). You can easily find swings with the Swing Suite indicator. As an extra conformation layer you could also wait for a trend reversal or a signal bar within the TRN Bars indicator.
4. Take profit
Your first target should be the previous swing or a nearby level (e.g. current day high).
Order Block Model
1. Trend and market structure analysis
First, determine the market trend and the market structure.
2. OB analysis
Pay special attention to order blocks that are in the direction of the trend and have created momentum. This are the ones that can serve as entries.
3. Trade entry
Set a limit order at the identified order block in the direction of the trend. Place a stop-loss order directly below (for long trades) the order block to limit your risk (above for short trades).
4. Take profit
Your first target should be the previous swing or a nearby level (e.g. current day high).
You can trade this model instead of order blocks also with fair value gaps.