Harmonic Patterns Suite
Identifying potential trend reversals or continuations can be a crucial factor in making profitable trades. One powerful tool that traders use to identify these setups are harmonic chart patterns. These patterns, based on Fibonacci ratios, can be difficult to spot with the naked eye, which is why we offer a Tool specifically designed to detect harmonic chart patterns.
In this section of the documentation, we will explore the Harmonic Patterns Suite, its features, and how to use it effectively to identify potential trading opportunities.
Our indicator includes the harmonic patterns Gartley, Bat, Butterfly, Crab, Cypher, Shark and 5-0. Each of these patterns has specific rules for identifying the potential reversal or continuation of a trend. Our indicator takes the time-consuming search for the patterns completely off your hands and provides you with all the important information, such as entry point, stop-loss or take-profit, so that you can open your trade directly after one of the harmonic chart patterns has been confirmed.
Go to our Combinations section to see some examples of how to use the Harmonic Patterns Suite in conjunction with our other tools to find high probability trade setups.
As with any technical analysis tool, the harmonic chart patterns should be used in conjunction with other forms of analysis and risk management strategies. No pattern is infallible, and traders must always be prepared for unexpected market movements that can occur at any time.
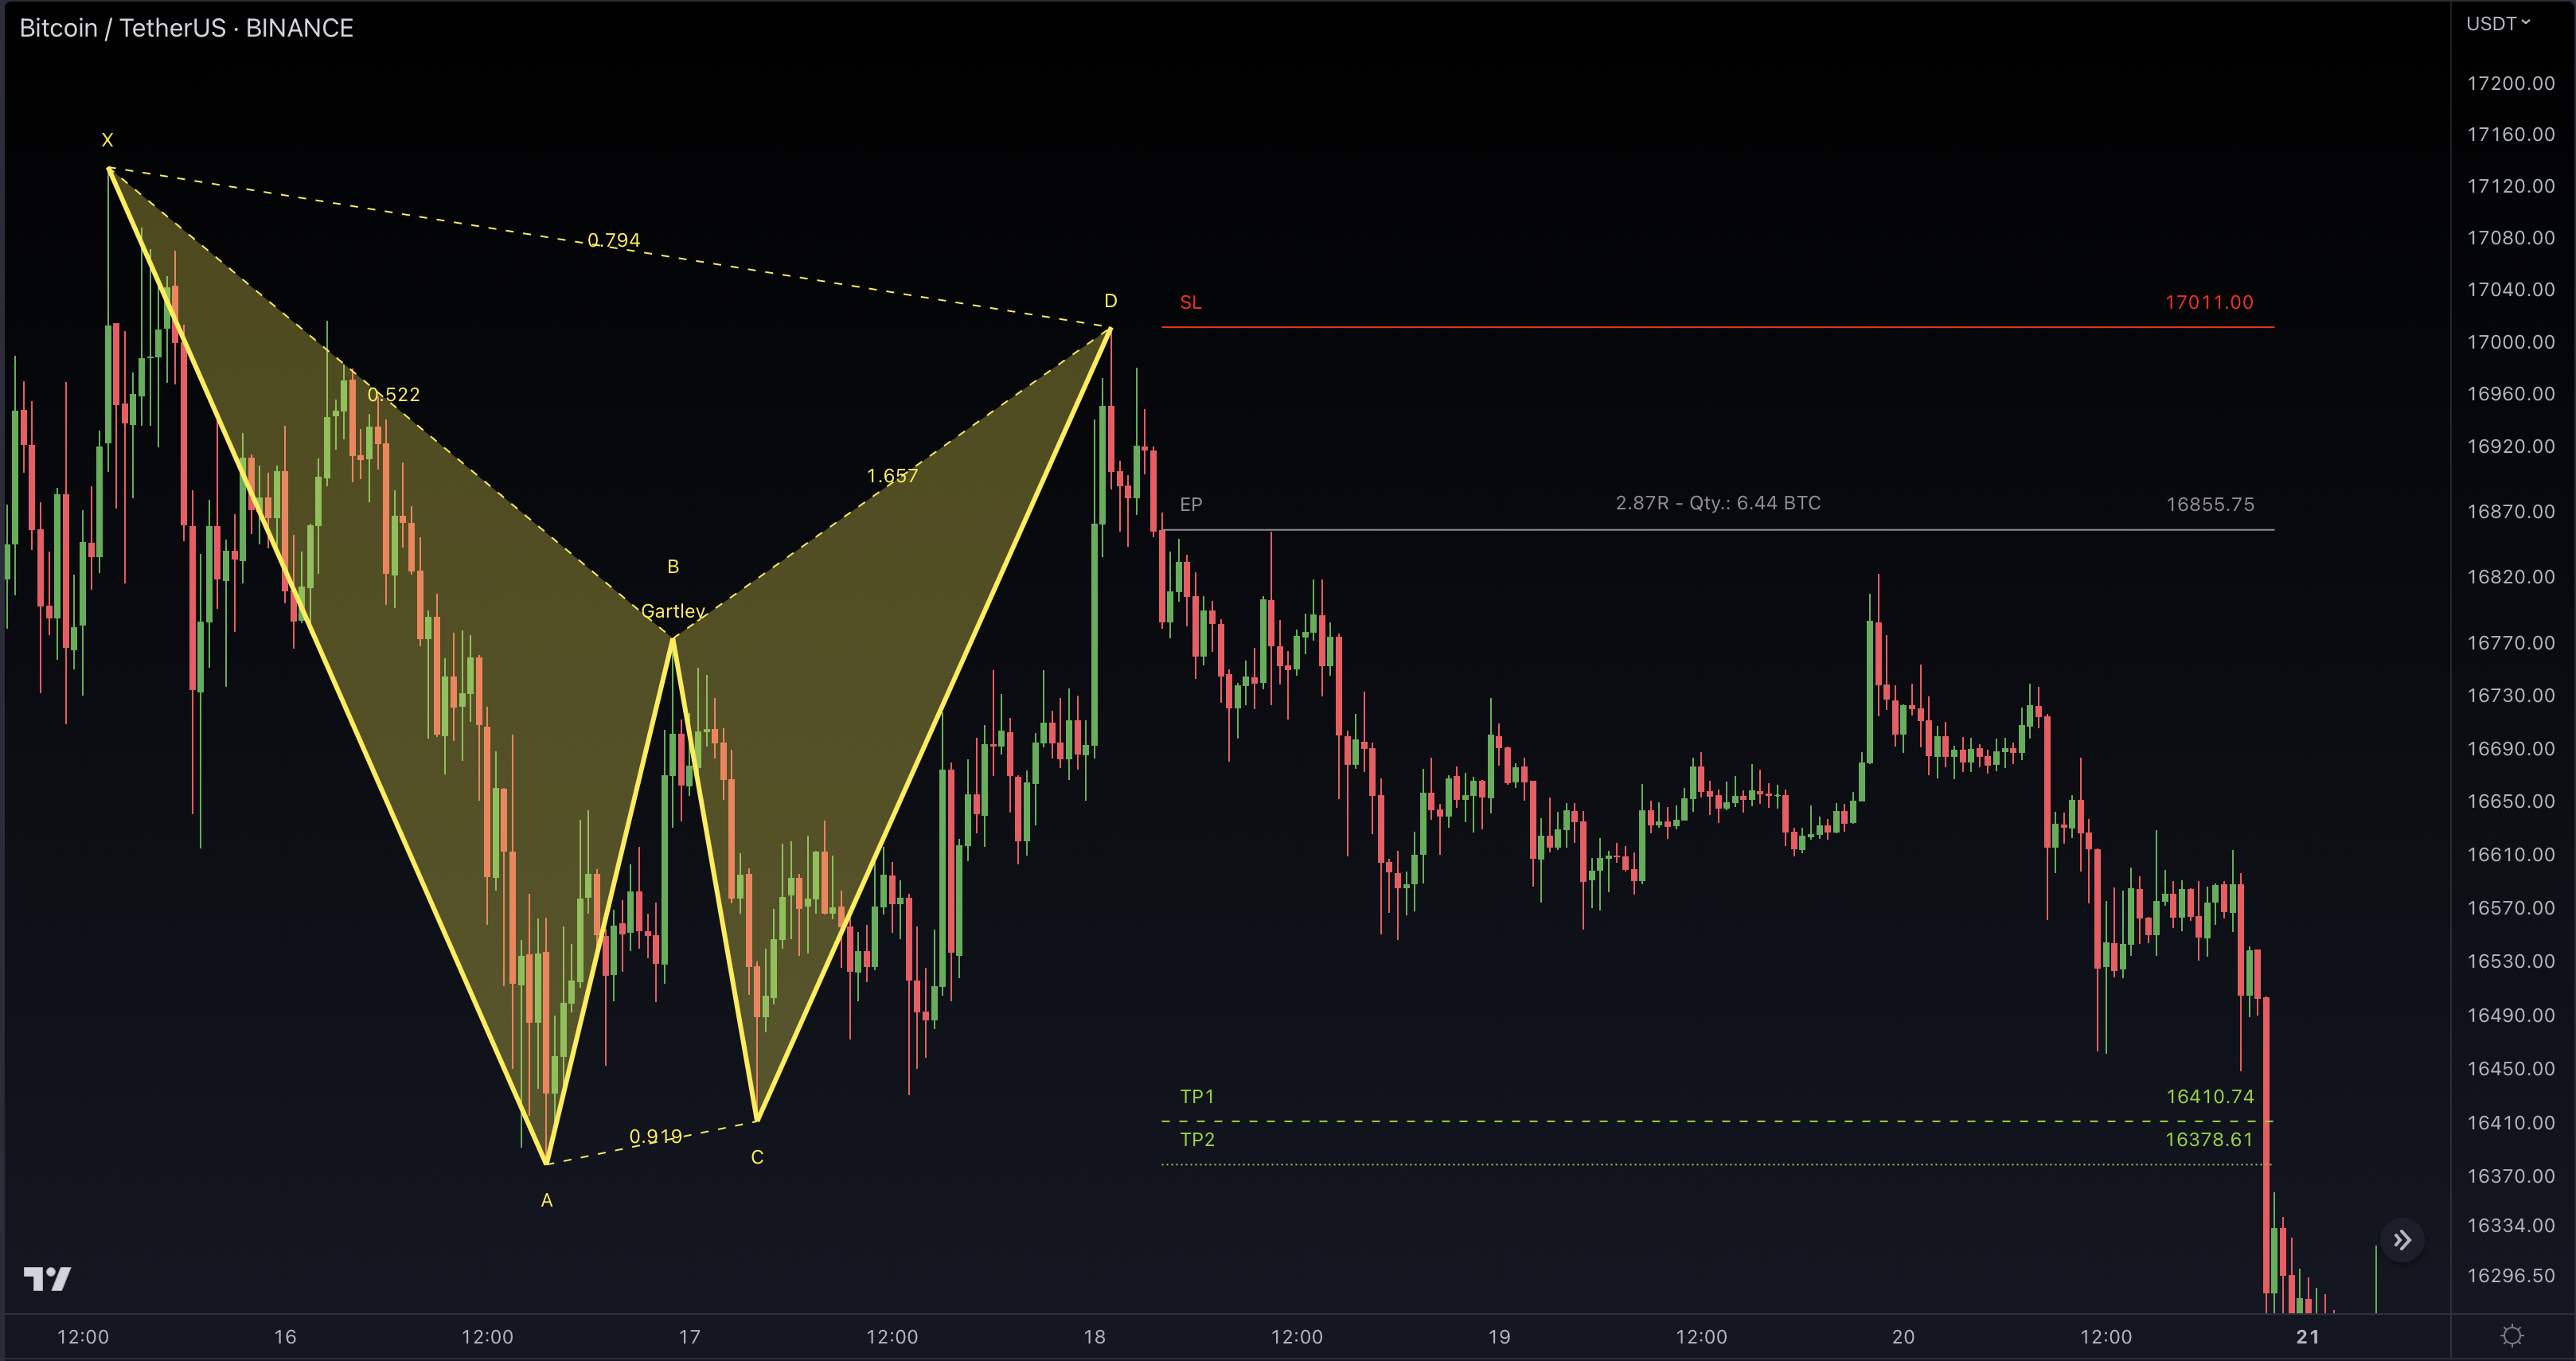
Gartley
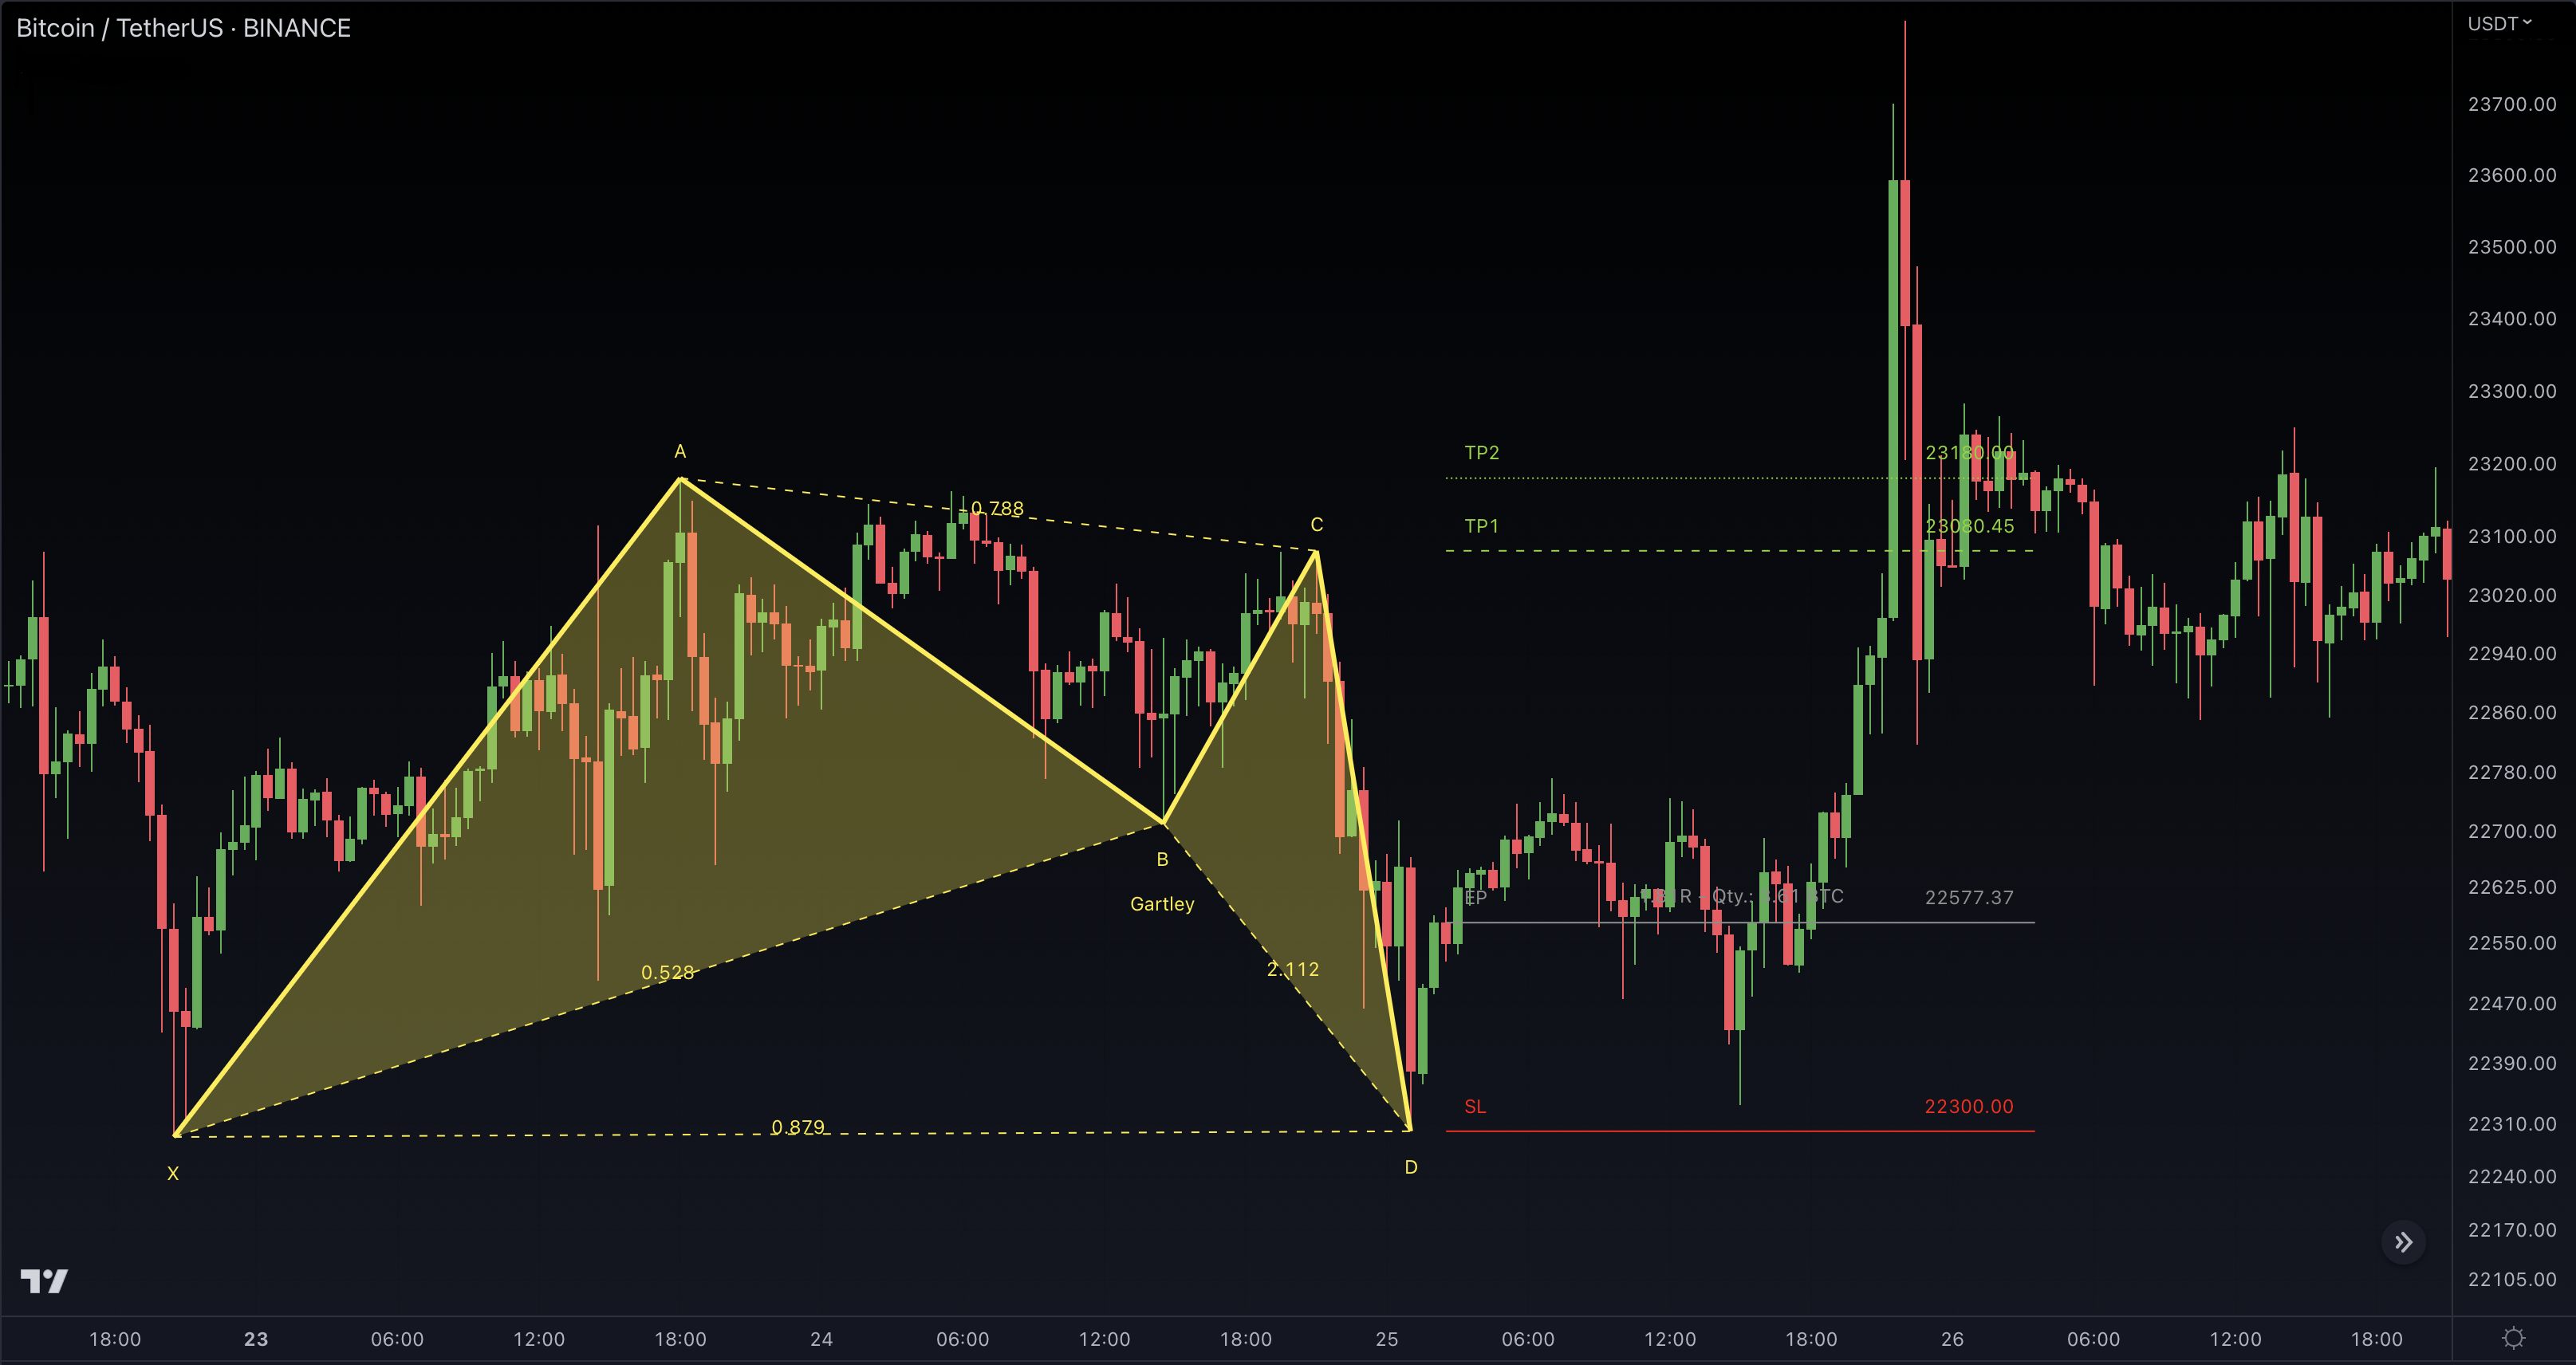
The Gartley pattern is composed of a series of price swings and retracements that form specific geometric shapes based on Fibonacci ratios.
The Gartley pattern is characterized by a specific sequence of price moves, including an initial impulse leg, followed by a retracement that forms the X point, another leg that forms the A point, a deeper retracement that forms the B point, a C point that forms with a retracement to the 0.618 or 0.786 Fibonacci level of the initial impulse leg, and finally, a completion of the pattern at the D point, which forms with a retracement to the 0.786 Fibonacci level of the XA leg.
Traders use the Gartley pattern to identify potential entry and exit points in the market, as well as to set stop-loss and take-profit levels.
Bat
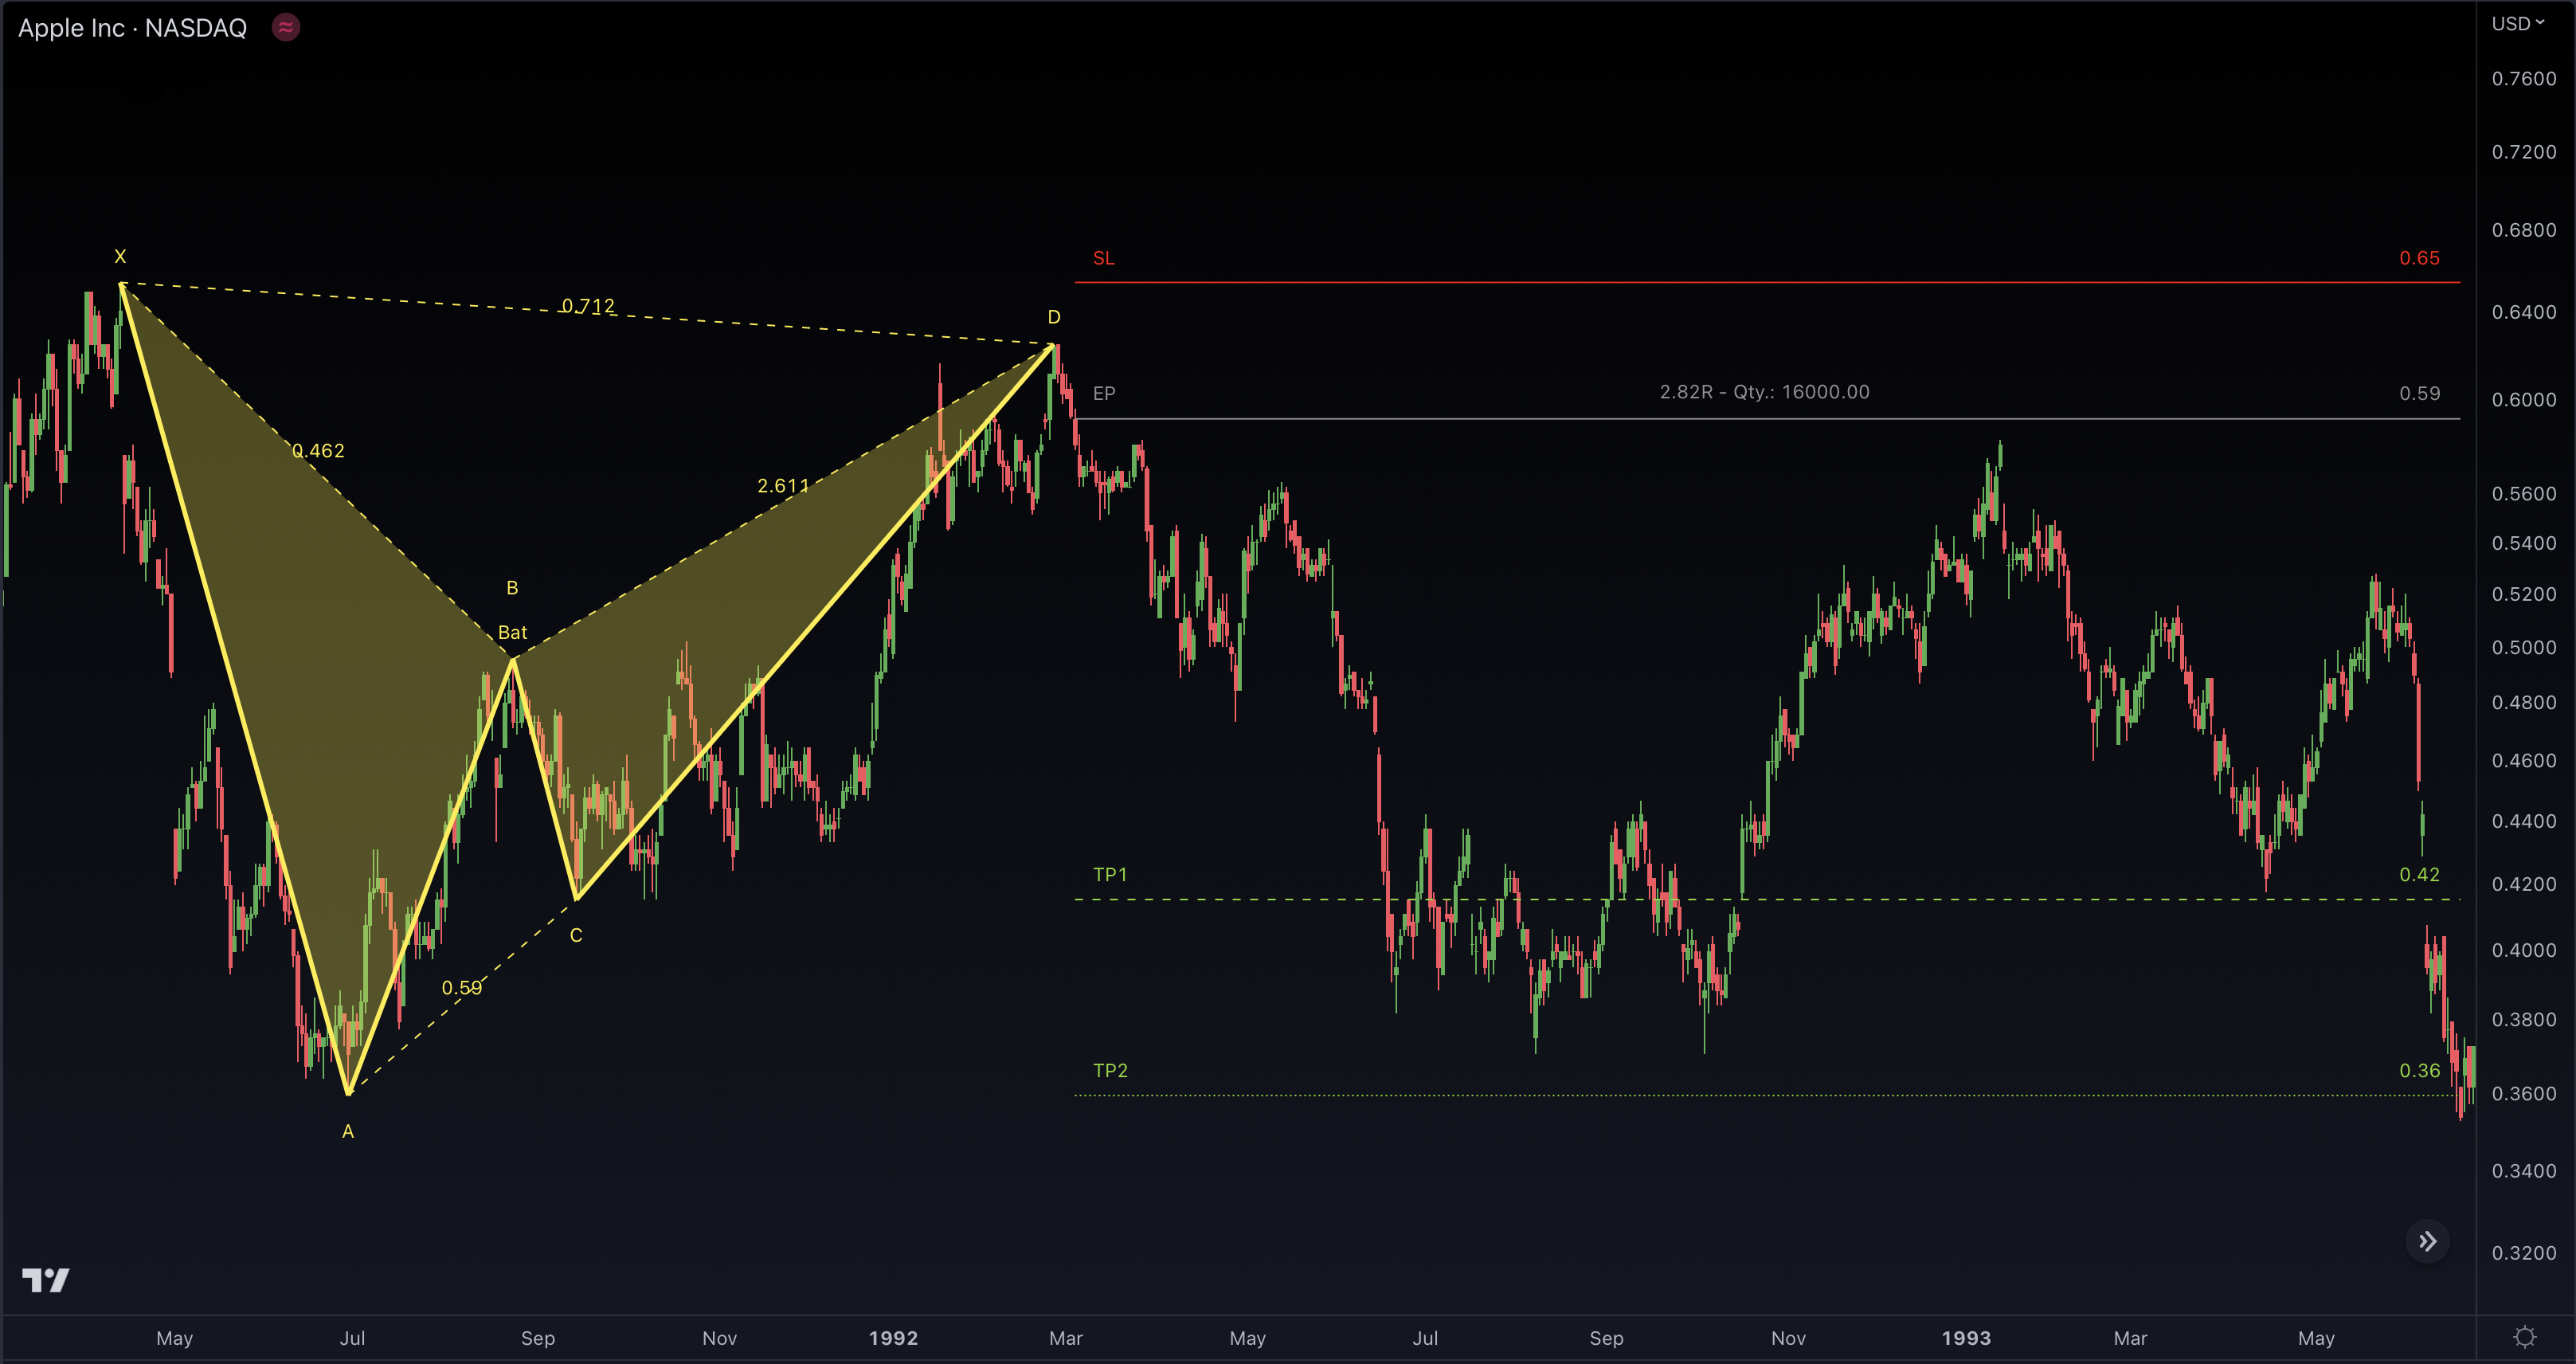
The Bat pattern derives its name from the distinctive shape of a bat's wings, which it resembles when plotted on a price chart.
The Bat pattern is composed of a specific sequence of price movements, including an initial impulse leg, a retracement that forms the X point, another leg that forms the A point, a deeper retracement forming the B point, a C point that forms with a retracement to the 0.382 or 0.618 Fibonacci level of the initial impulse leg, and finally, a completion of the pattern at the D point. The D point forms with a retracement to the 0.886 or 1.618 Fibonacci level of the XA leg.
Traders who are skilled in identifying the Bat pattern can use it to pinpoint potential entry and exit points in the market, as well as to set stop-loss and take-profit levels. However, it is important to note that the Bat pattern is less common than other harmonic patterns, such as the Gartley and Butterfly patterns. As such, it may require more experience and practice to identify accurately. Fortunately, our Harmonic Patterns Suite indicator does all this time-consuming work for you.
Butterfly
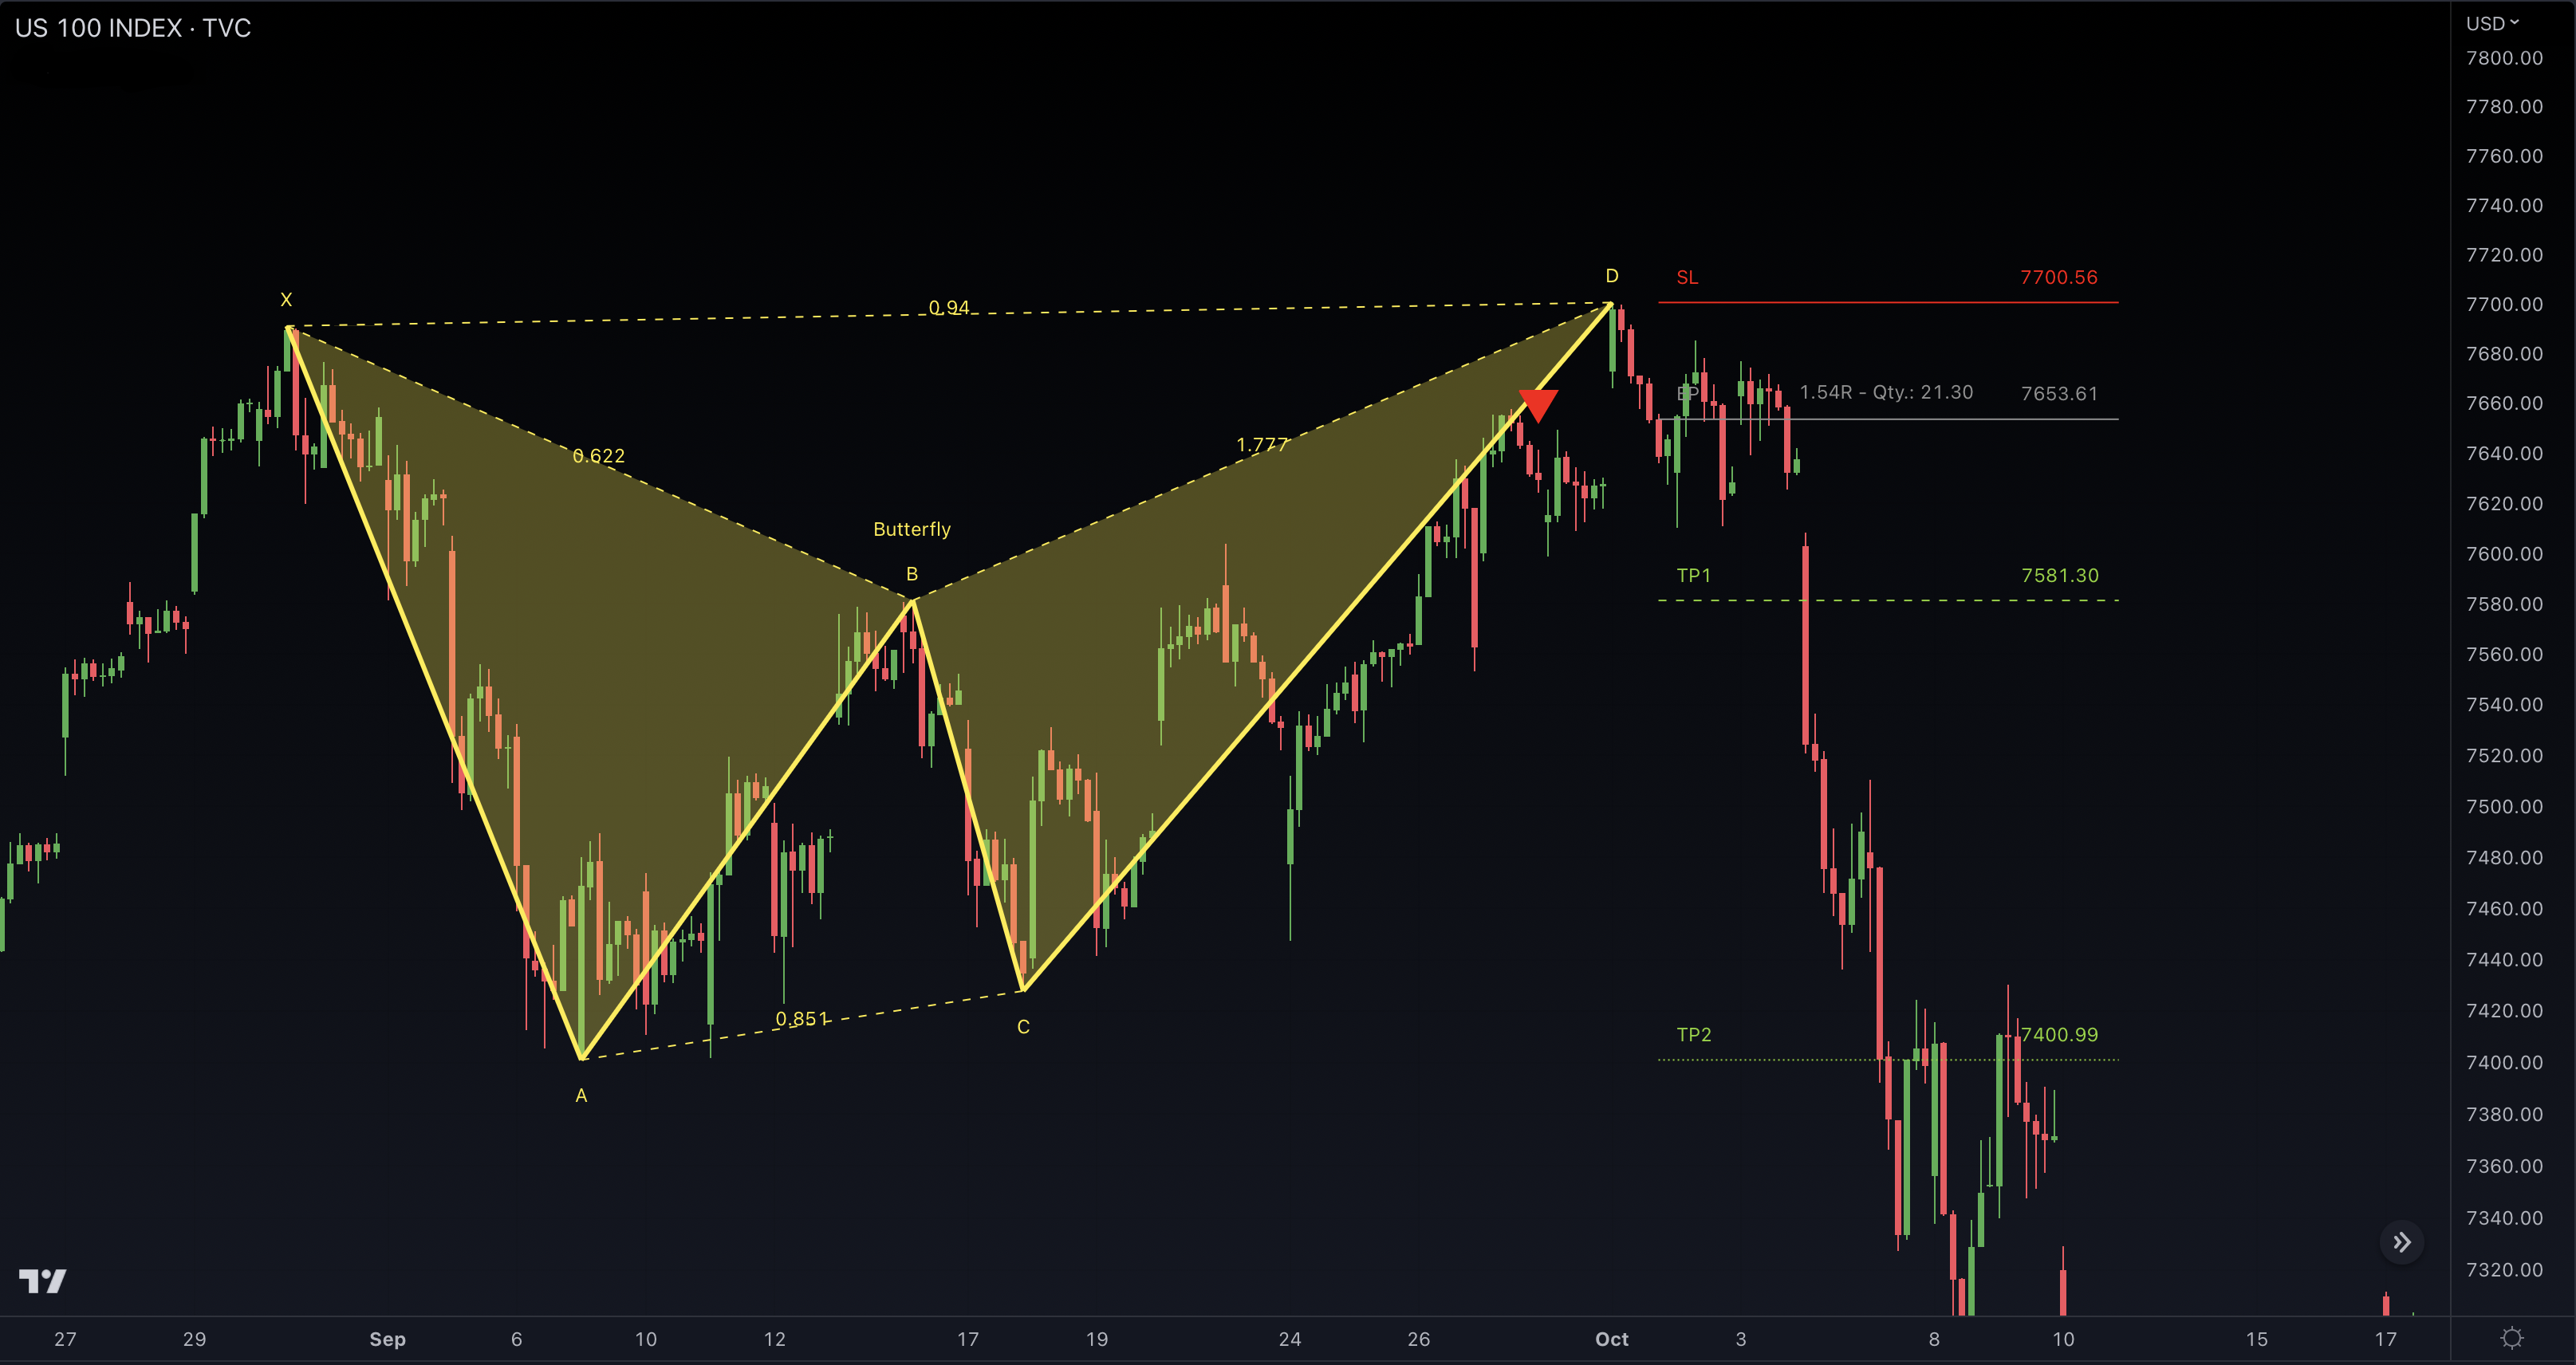
The Butterfly pattern is a popular harmonic chart pattern used by traders to identify potential trend reversals in financial markets. This pattern is named after its unique shape, which closely resembles the wings of a Butterfly.
The Butterfly pattern consists of distinct price movements. It begins with an initial impulse leg, followed by a retracement that establishes the X point. Subsequently, another leg forms to create the A point, succeeded by a deeper retracement that constitutes the B point. The C point materializes with a retracement to either the 0.786 or 0.886 Fibonacci level of the initial impulse leg. Finally, the pattern concludes at the D point, which forms with a retracement to the 1.272 or 1.618 Fibonacci level of the XA leg.
Once identified, the Butterfly pattern can be used to pinpoint potential entry and exit points in the market. Additionally, the pattern can be utilized to set stop-loss and take-profit levels to manage risk and maximize profits.
Crab
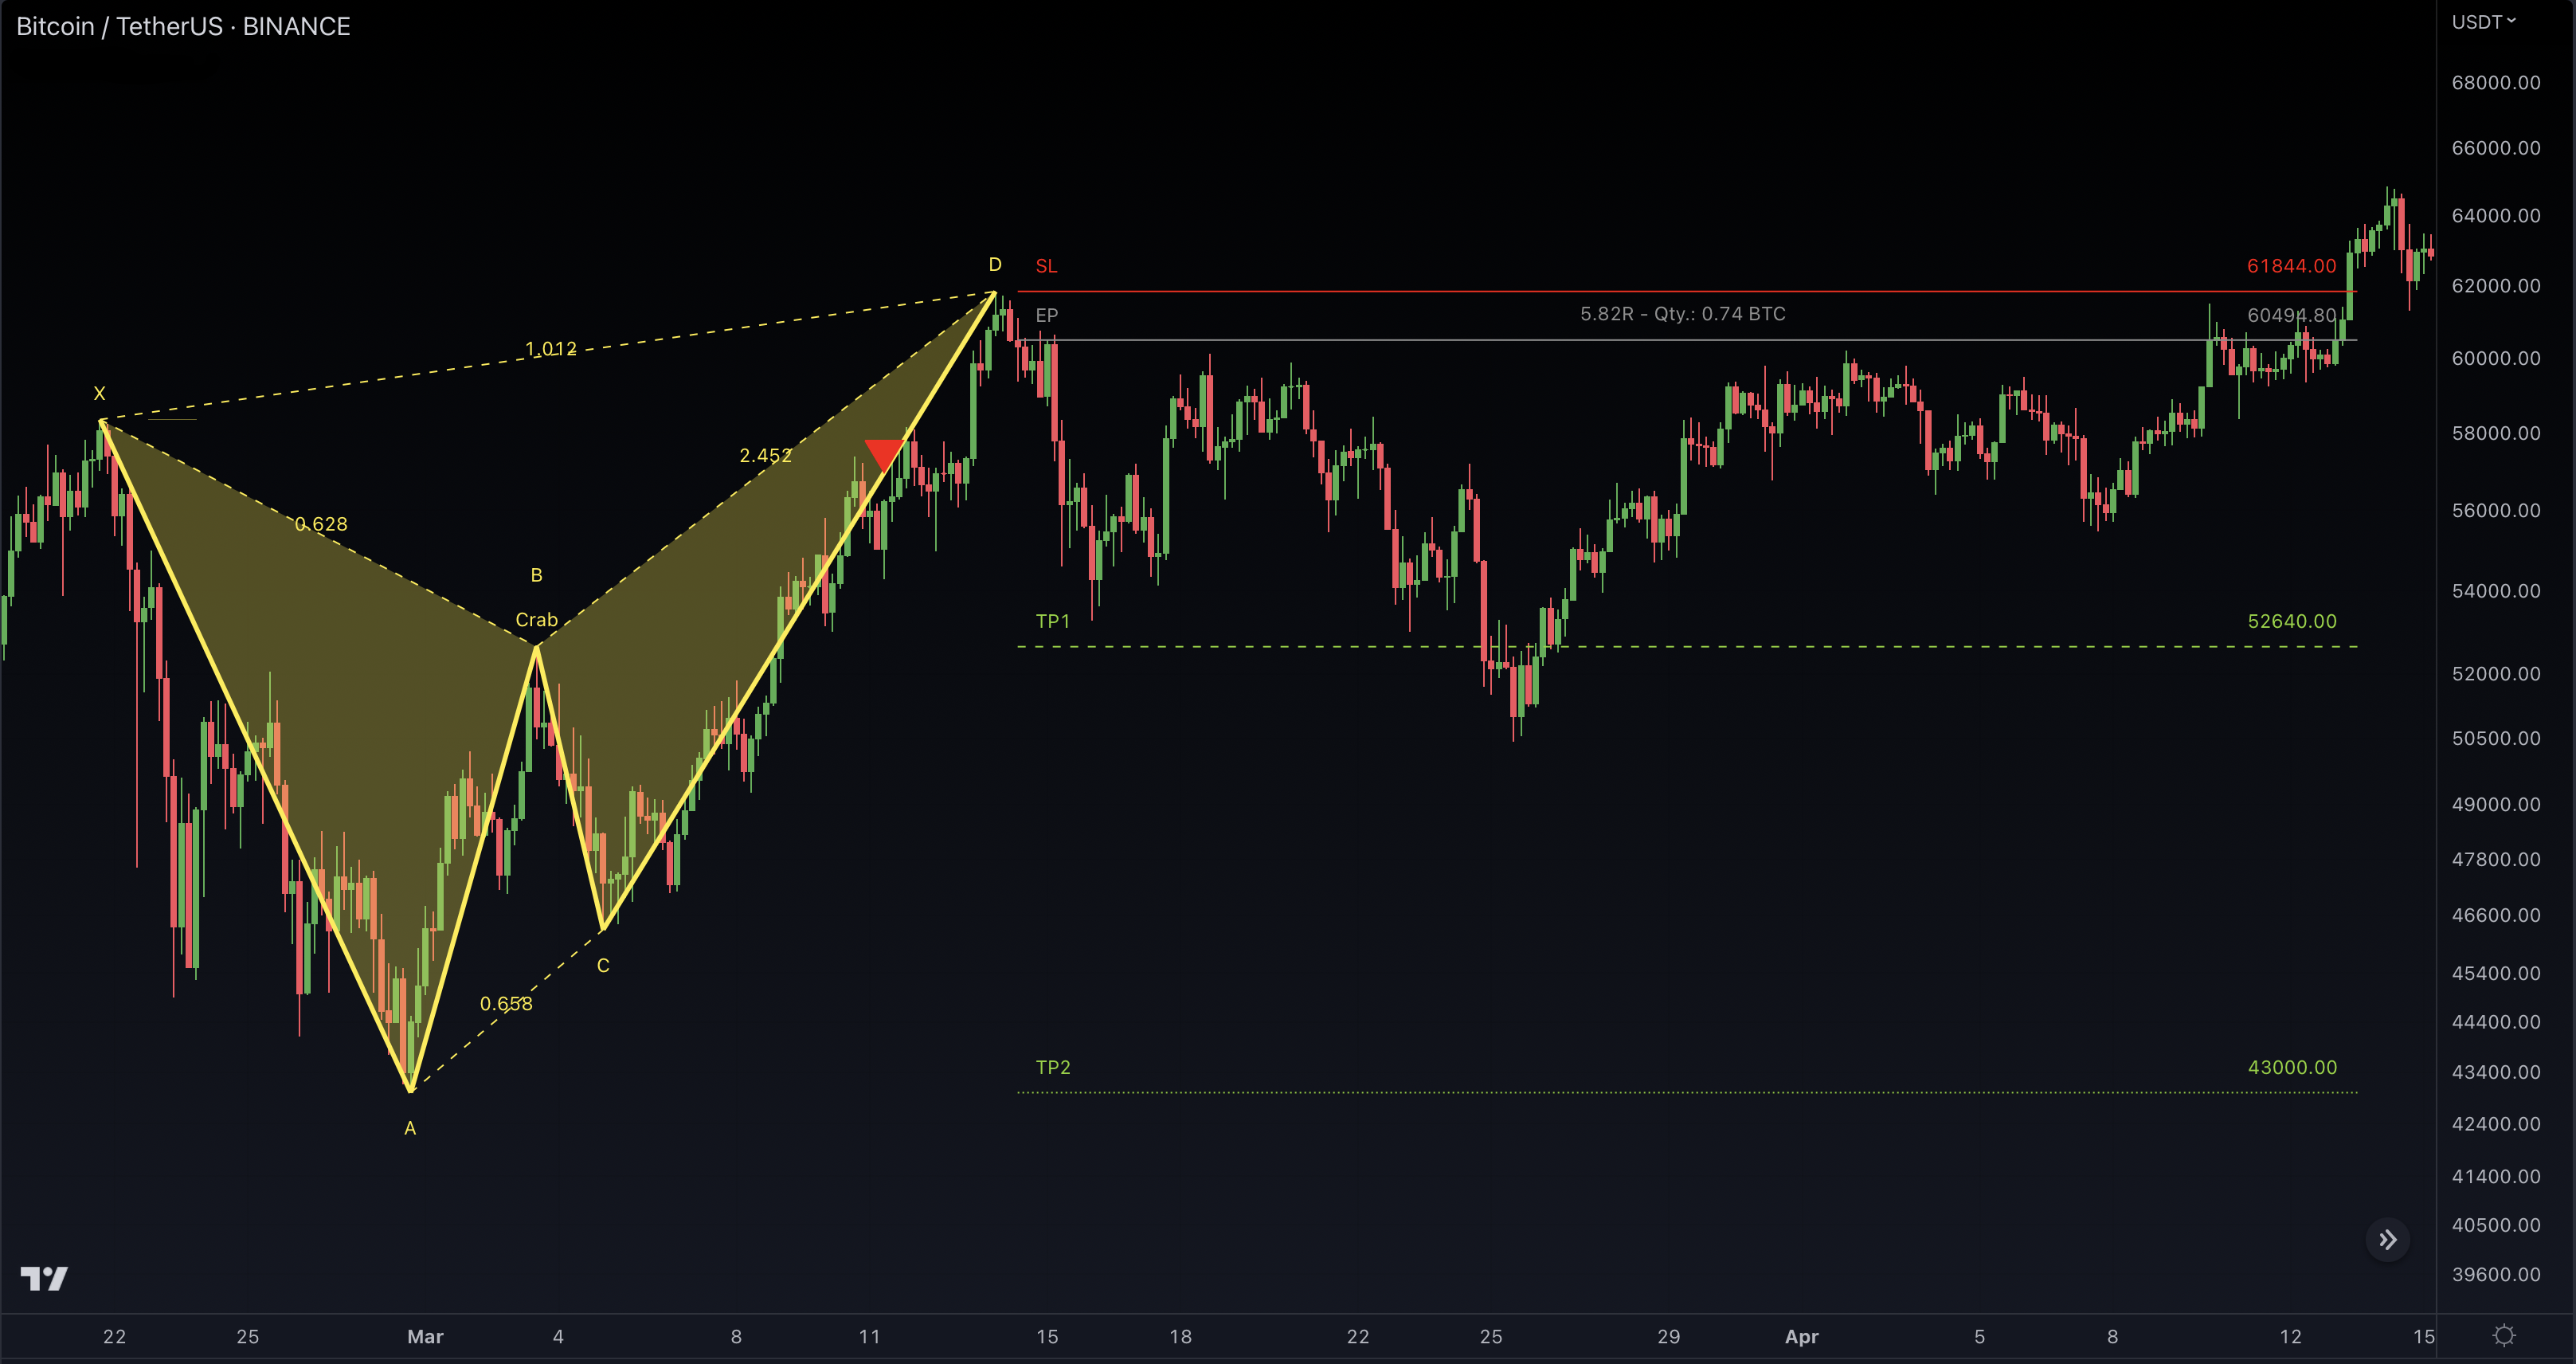
The Crab pattern is a widely used harmonic chart pattern. It is named after its resemblance to the sideways movement of a Crab, where the price action moves horizontally for an extended period before resuming its trend.
The Crab pattern emerges through a distinctive series of price movements. It commences with an initial impulse leg, accompanied by a retracement that establishes the X point. Subsequently, another leg develops to form the A point, followed by a deeper retracement that defines the B point. The C point materializes with a retracement to either the 0.382 or 0.886 Fibonacci level of the XA leg. Finally, the pattern culminates at the D point, which emerges with a retracement to the 2.24 or 3.618 Fibonacci level of the BC leg.
Proficient traders who possess the ability to recognize the Crab pattern can leverage it to identify potential market entry and exit points, as well as establish appropriate stop-loss and take-profit levels. It is worth noting, however, that the Crab pattern is relatively less prevalent compared to other harmonic patterns like the Gartley and Butterfly patterns. Accurately identifying the Crab pattern may necessitate a higher level of skill and expertise. Fortunately, with Harmonic Patterns Suite, this task is alleviated as the platform handles the intricate work on your behalf.
Cypher
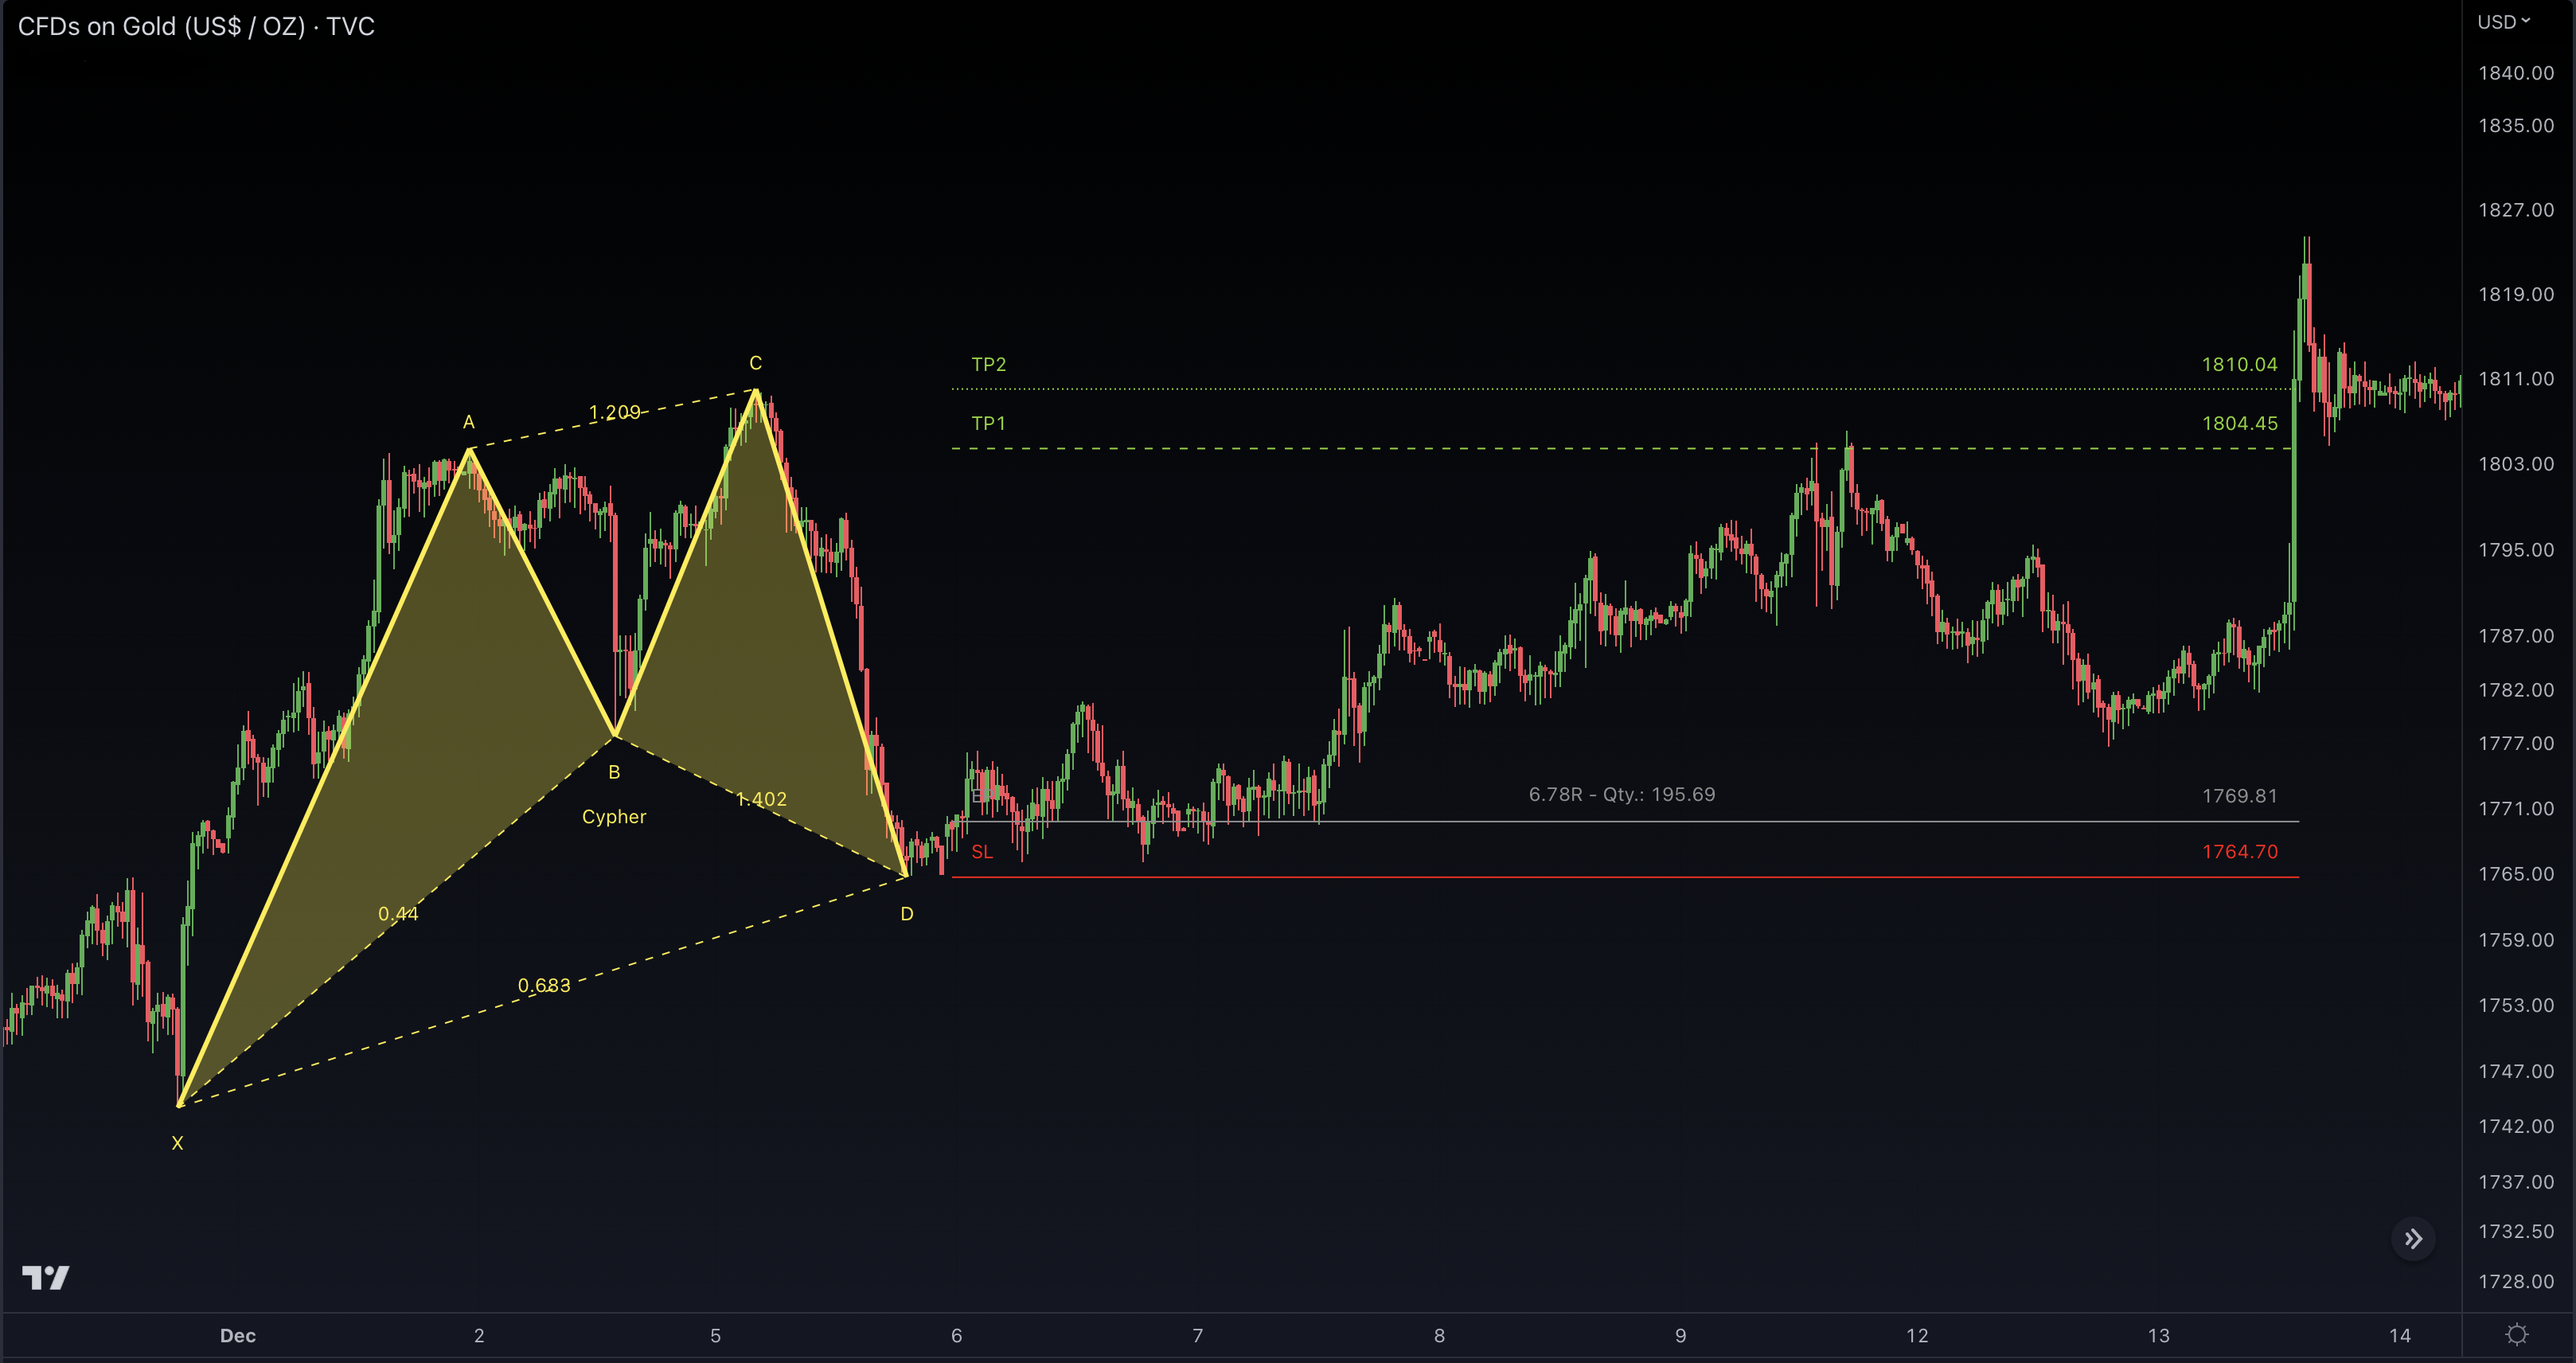
The Cypher pattern is another type of harmonic trading pattern that can provide potential trade setups in financial markets. It is considered a retracement pattern and is formed by a specific sequence of price swings and Fibonacci ratios.
The Cypher pattern is formed by a specific sequence of price moves, including an initial impulse leg, followed by a retracement that forms the X point, another leg that forms the A point, a deeper retracement that forms the B point, a C point that forms with a retracement to the 0.786 Fibonacci level of the XA leg, and finally, a completion of the pattern at the D point, which forms with a retracement to the 1.272 or 1.414 Fibonacci level of the BC leg.
If traders have the ability to identify the Cypher pattern accurately, they can use it as a powerful tool to find potential entry and exit points in the market and determine optimal stop-loss and take-profit levels. It is important to keep in mind, however, that the Cypher pattern is not as common as other harmonic patterns like the Gartley, Butterfly and Bat patterns. Identifying the Cypher pattern effectively may demand experience and expertise. However, our Harmonic Patterns Suite Tool simplifies the process, enabling traders to master this task with ease.
Shark
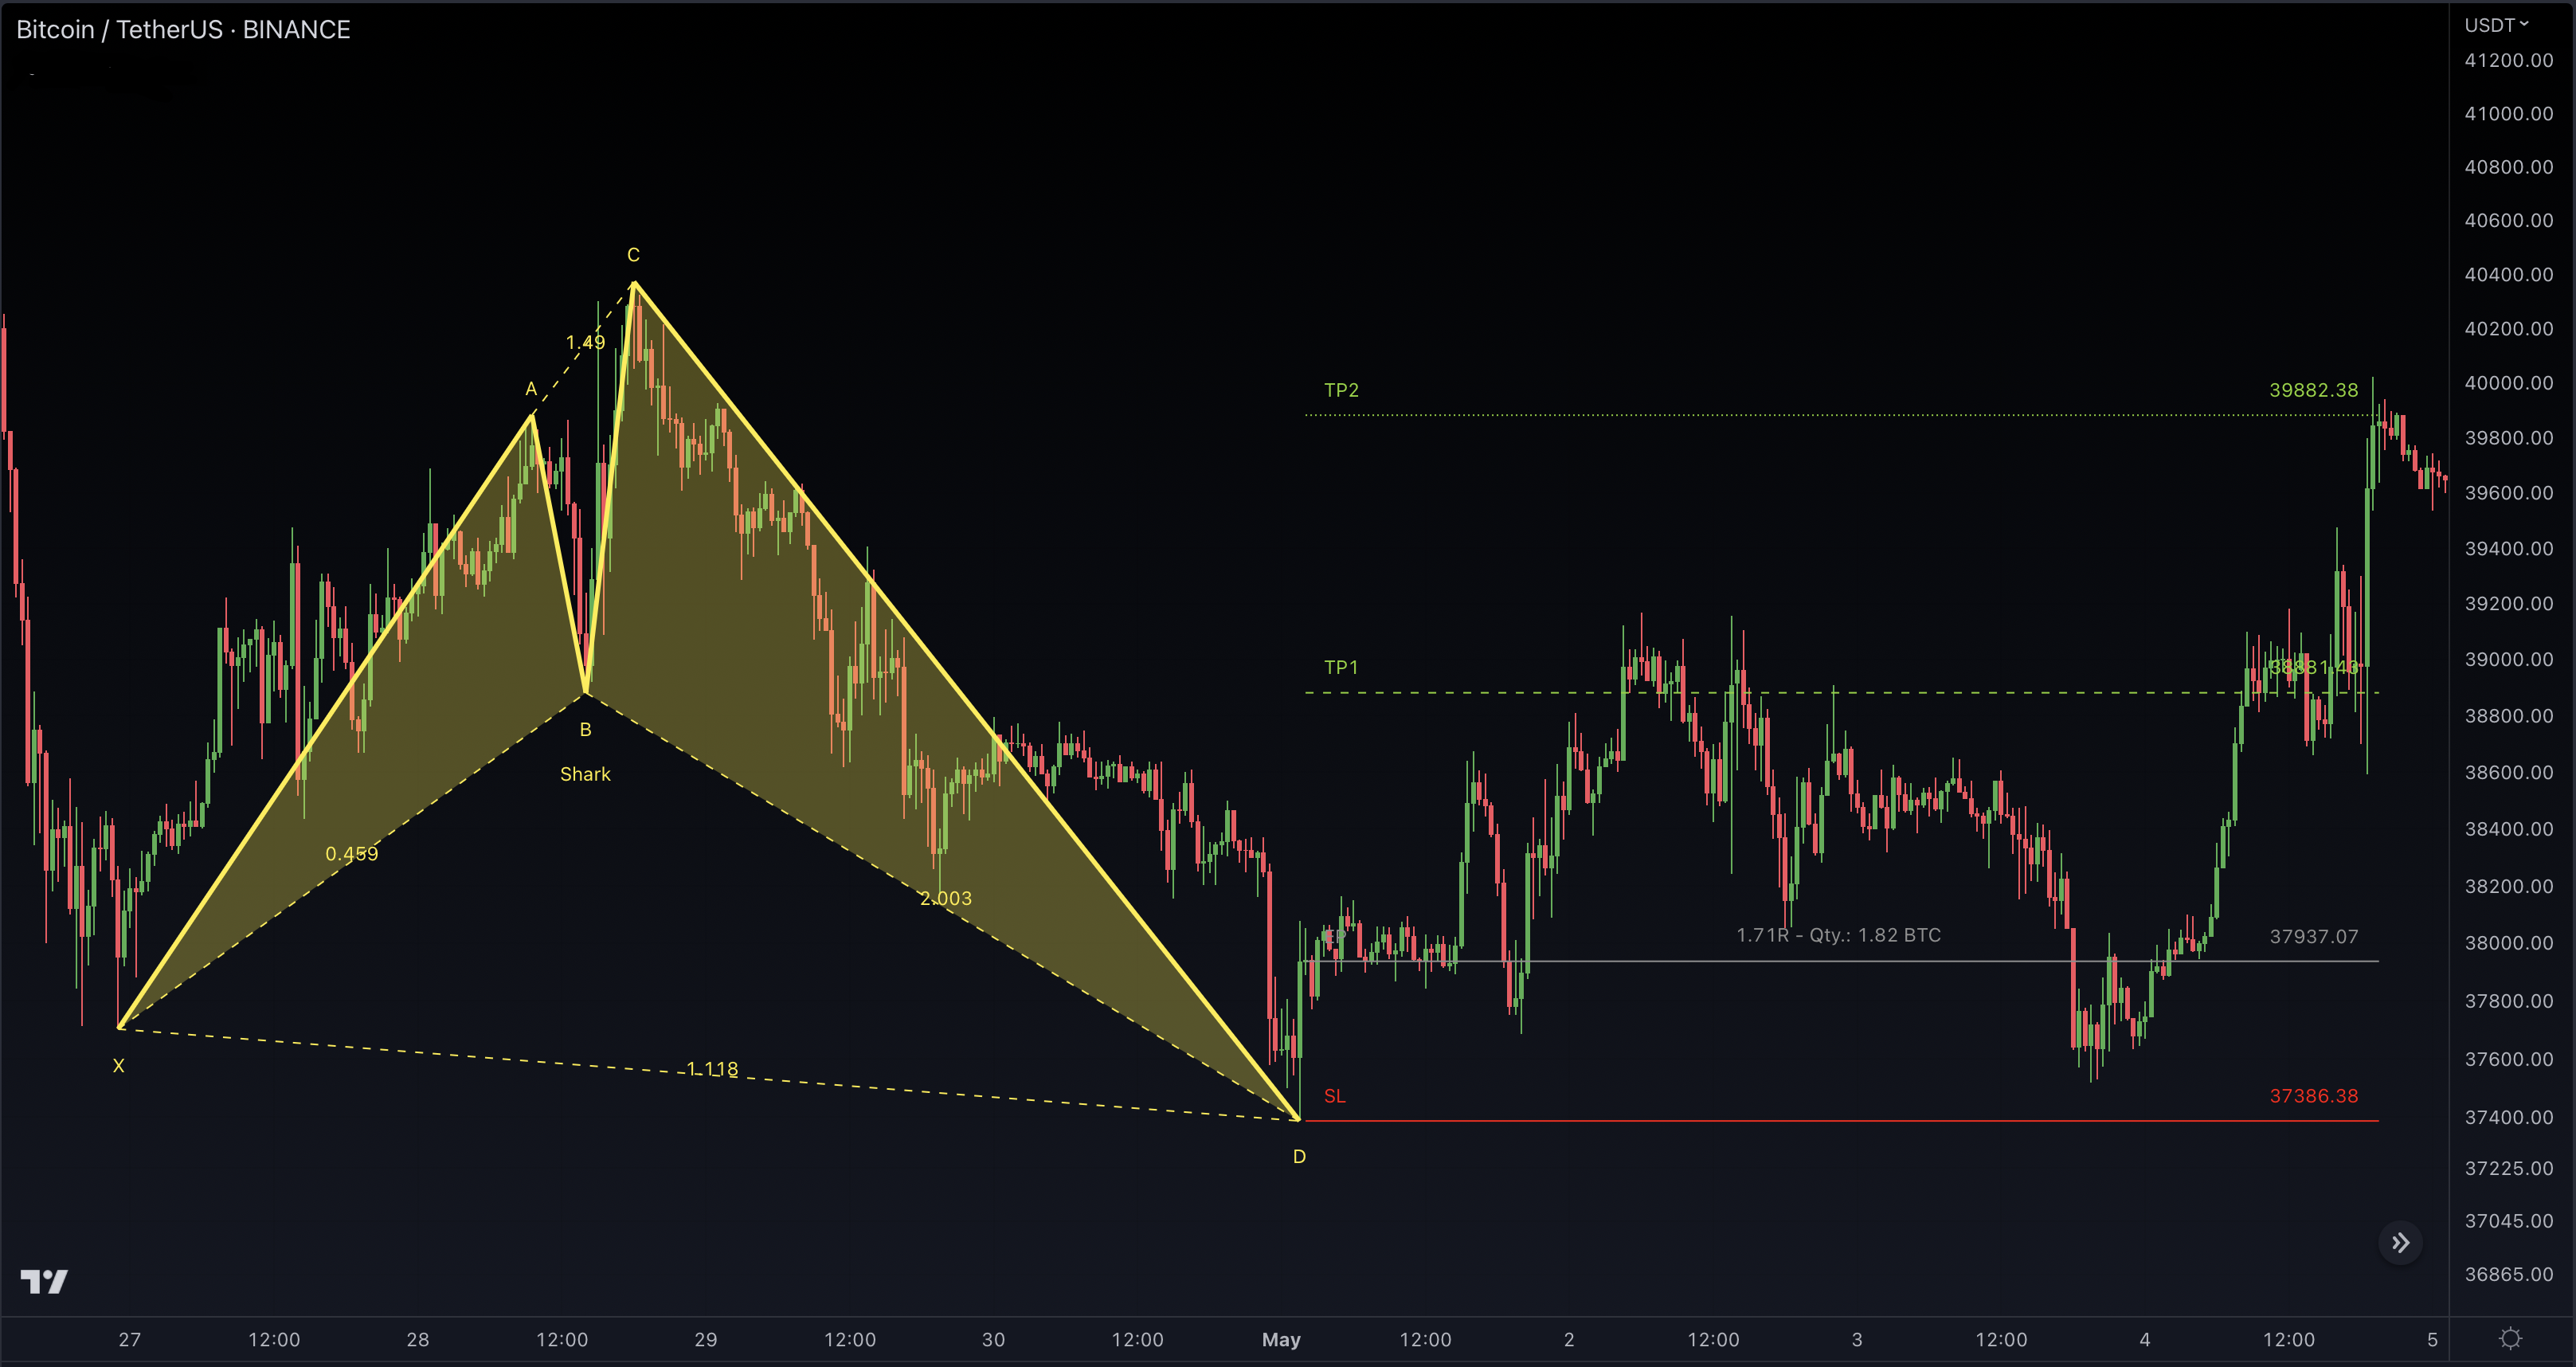
The Shark pattern is a lesser-known harmonic chart pattern used by traders to identify potential trend reversals in financial markets. It is a five-point pattern that involves an initial impulse leg, followed by a retracement forming the X point, then an extended move forming the A point, a deep retracement that forms the B point at the 1.13-1.618 Fibonacci extension of XA, an extended move that forms the C point, and finally, the completion of the pattern at the D point, which forms at the 1.618-2.24 Fibonacci extension of BC.
The Shark pattern is a relatively rare pattern, and it can be challenging to identify accurately. Traders who are experienced in recognizing the shark pattern can use it to identify potential entry and exit points in the market, as well as to set stop-loss and take-profit levels. However, with Harmonic Patterns Suite, finding Shark patterns is a piece of cake for anyone.
5-0
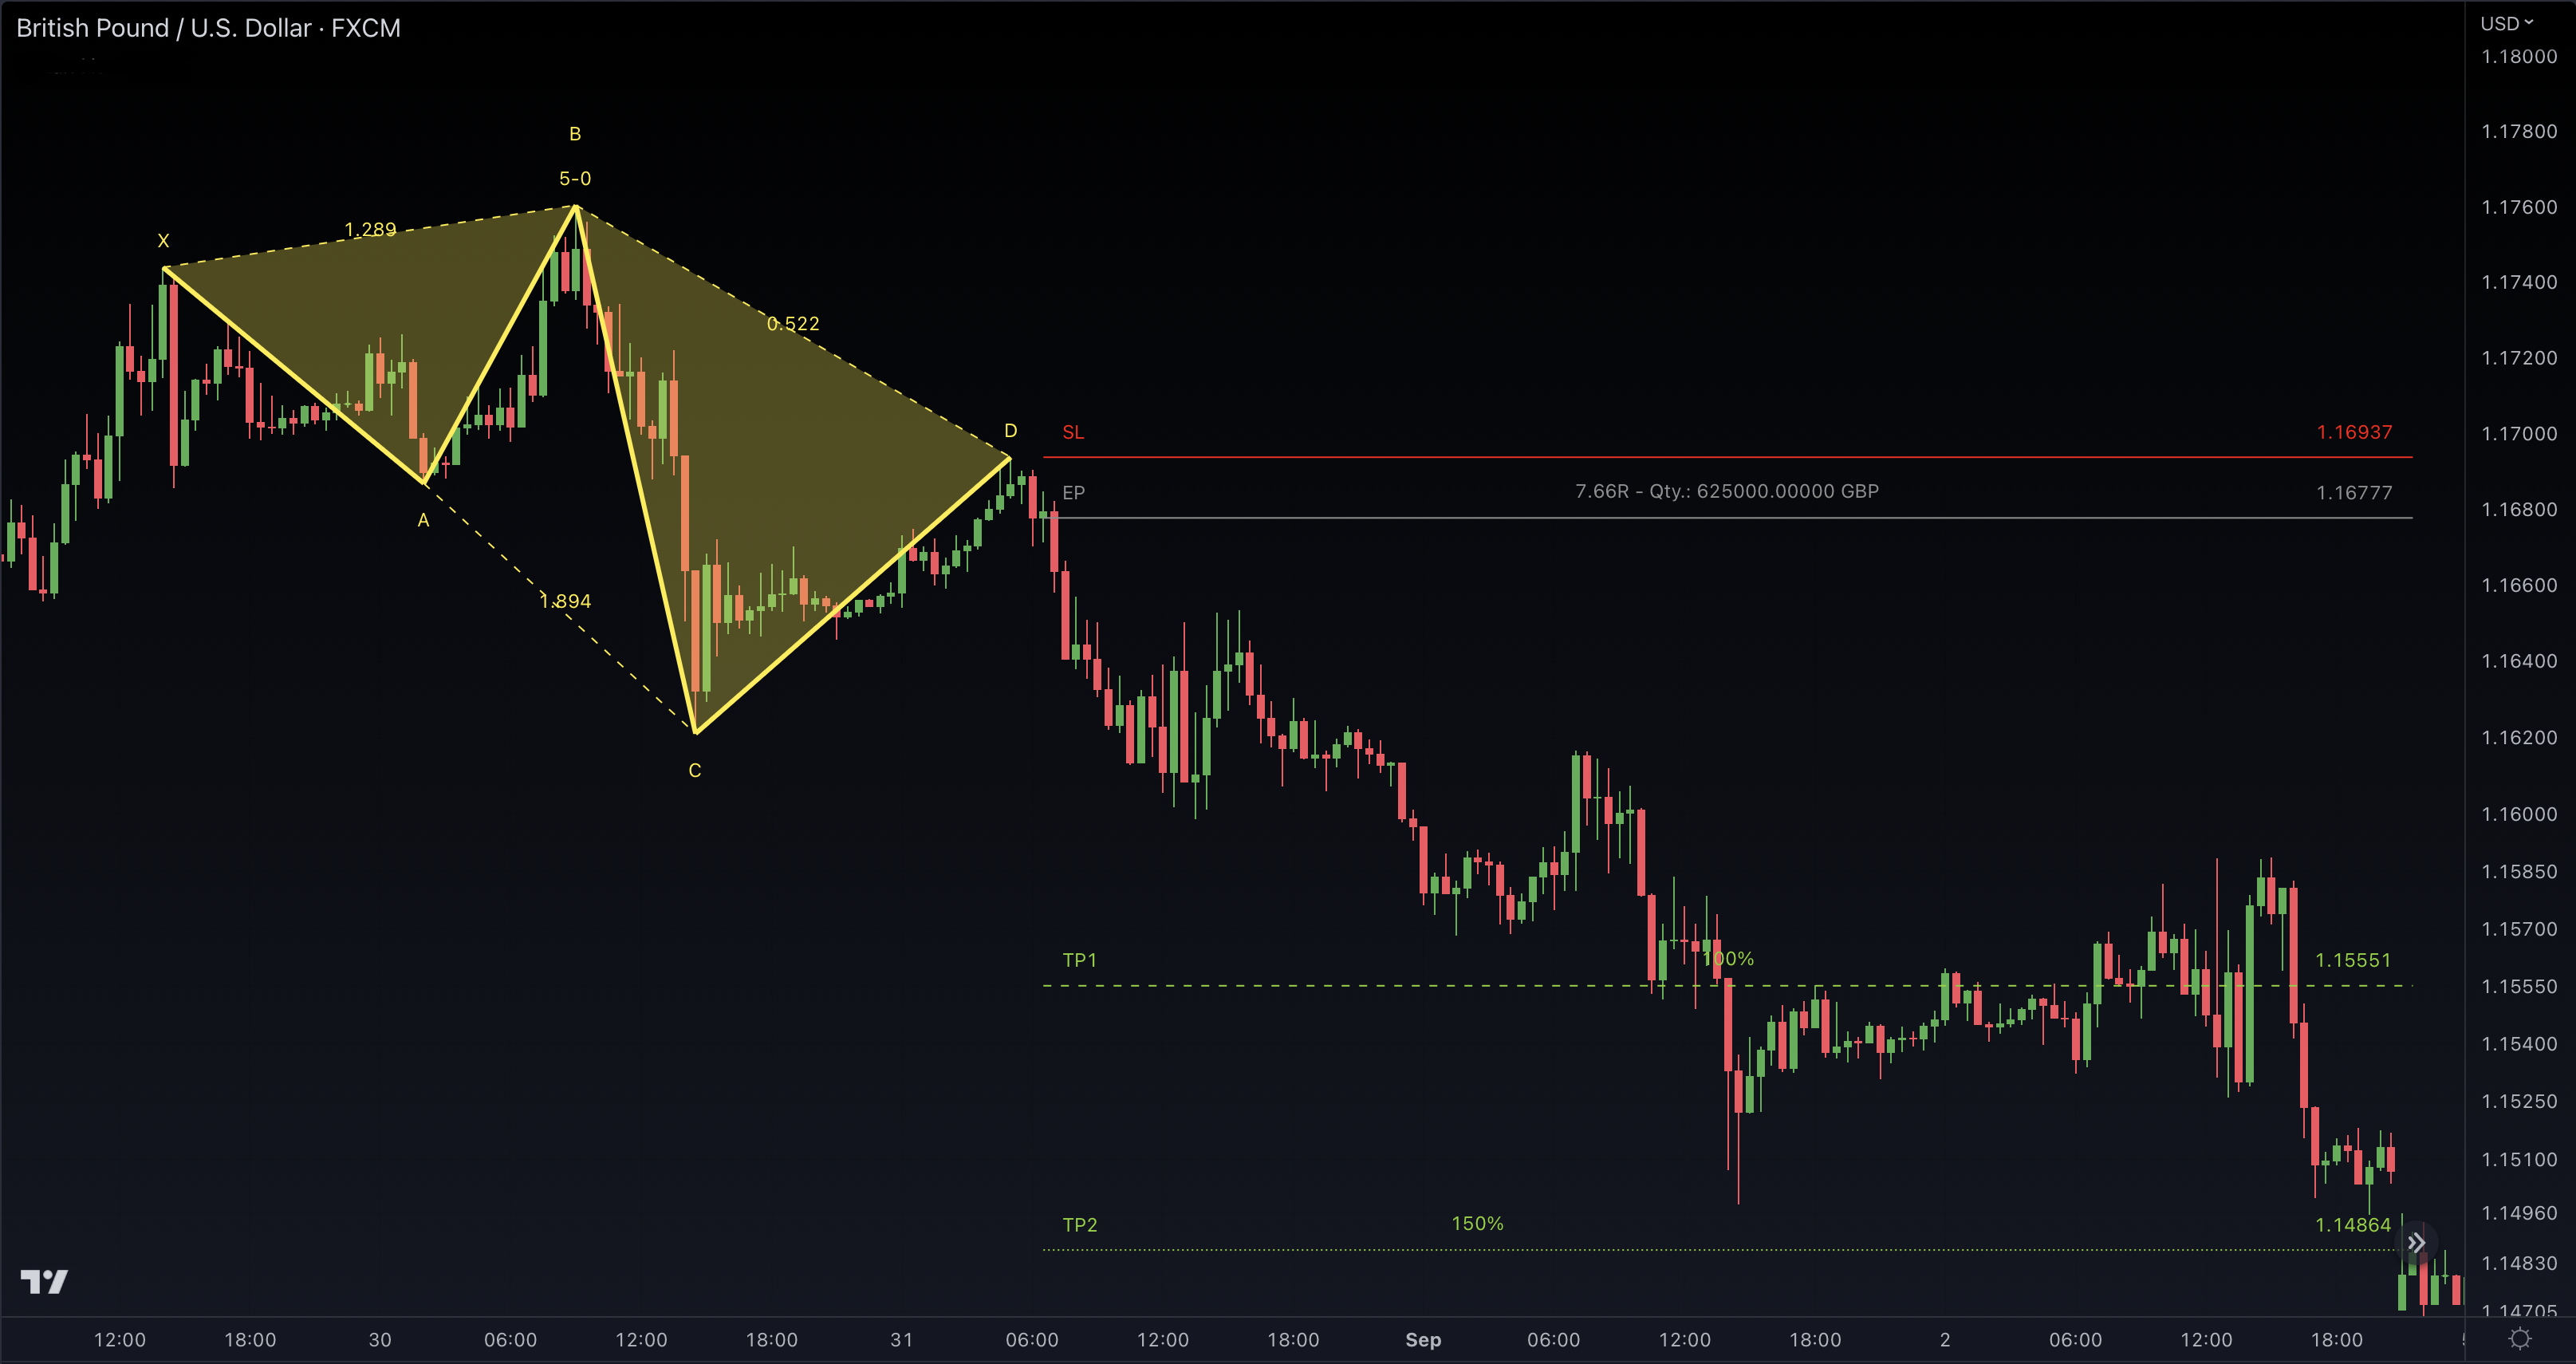
The 5-0 pattern is a unique harmonic chart pattern that traders can use to detect potential trend reversals in the financial markets. It is a five-point pattern that begins with an initial move forming the X point, followed by a retracement forming the A point, an extended move forming the B point, a retracement forming the C point, and finally, the completion of the pattern at the D point.
Unlike other popular harmonic patterns such as Gartley and Butterfly, the 5-0 pattern is relatively rare and requires a higher level of experience and expertise to identify accurately. However, traders who have mastered this pattern can use it to pinpoint potential entry and exit points in the market and set effective stop-loss and take-profit levels. This is why the 5-0 pattern was a must have for our Harmonic Patterns Suite.
How To Trade With Harmonic Patterns Suite
The procedure for trading with the Harmonic Patterns Suite is identical for all harmonic patterns and nobody wants to read the same texts over and over again. For this reason, the procedure is described using the Gartley pattern as a representative example for all harmonic chart patterns included in the Harmonic Patterns Suite.
1. Choose Breakout Conditions
Choose one out of 7 breakout conditions. Based on the breakout condition you choose, the entry point (EP) will be calculated for you automatically. If you use the default settings, "TRN Bars Signal + Trend" is preset as the breakout condition.
If you want to know more about the breakout conditions, go to our Breakout Conditions section to learn all about this feature.
2. Identify The Pattern
Add Harmonic Patterns Suite to your chart and look for harmonic chart patterns on the asset and timeframe of your choice.
You can also use the alerts to easy getting notified when a pattern is in the making or gets confirmed on the Symbol and timeframe of your choice. Please check out our Alerts section to learn how to use them.
With our Market Scanner you can search for harmonic patterns on up to 40 different symbols at the same time. Just get notified when a pattern is found, breaks out or is confirmed.
Visit our Market Scanner section and learn how it works.
3. Place Your Order
When the price has reached the reversal zone and a reversal gets confirmed, place your order near the price level of the grey entry point line (EP) above point D if a bullish pattern got confirmed or under point D if a bearish pattern got confirmed (like in the figure above).
Our Pattern Statistics make it easy for you to see how successful a Pattern is on the Asset and timeframe you are watching. You should always check them out before entering a trade. Visit our Pattern Statistics to learn how to use and adjust them correctly.
4. Set Stop-Loss And Take-Profit
Set your stop-loss at the price level of the red stop-loss line (SL). Set your take-profit at the price level of one of the green take-profit-lines (TP1, TP2,). Take into account that your risk/reward ratio (R) was calculated on the basis of TP1.
Enhance the precision and effectiveness of your stop-loss and take-profit orders by leveraging the Swing Statistics feature in our Swing Suite tool. Visit our How To Use Statistics section to gain valuable insights on how to utilize this tool to its full potential.
Use our build in risk management feature to optimize your trade. Check out our Risk Management section if you want to know how it works.
5. Monitor Your Trade
Once you've entered the trade, monitor it closely. Adjust your stop loss and profit target as the price moves, and consider exiting the trade if the price starts to move against you.
Utilize the TRN Bars to effectively monitor your trades. Discover the inner workings of this tool by referring to the designated section How To Use TRN Bars.