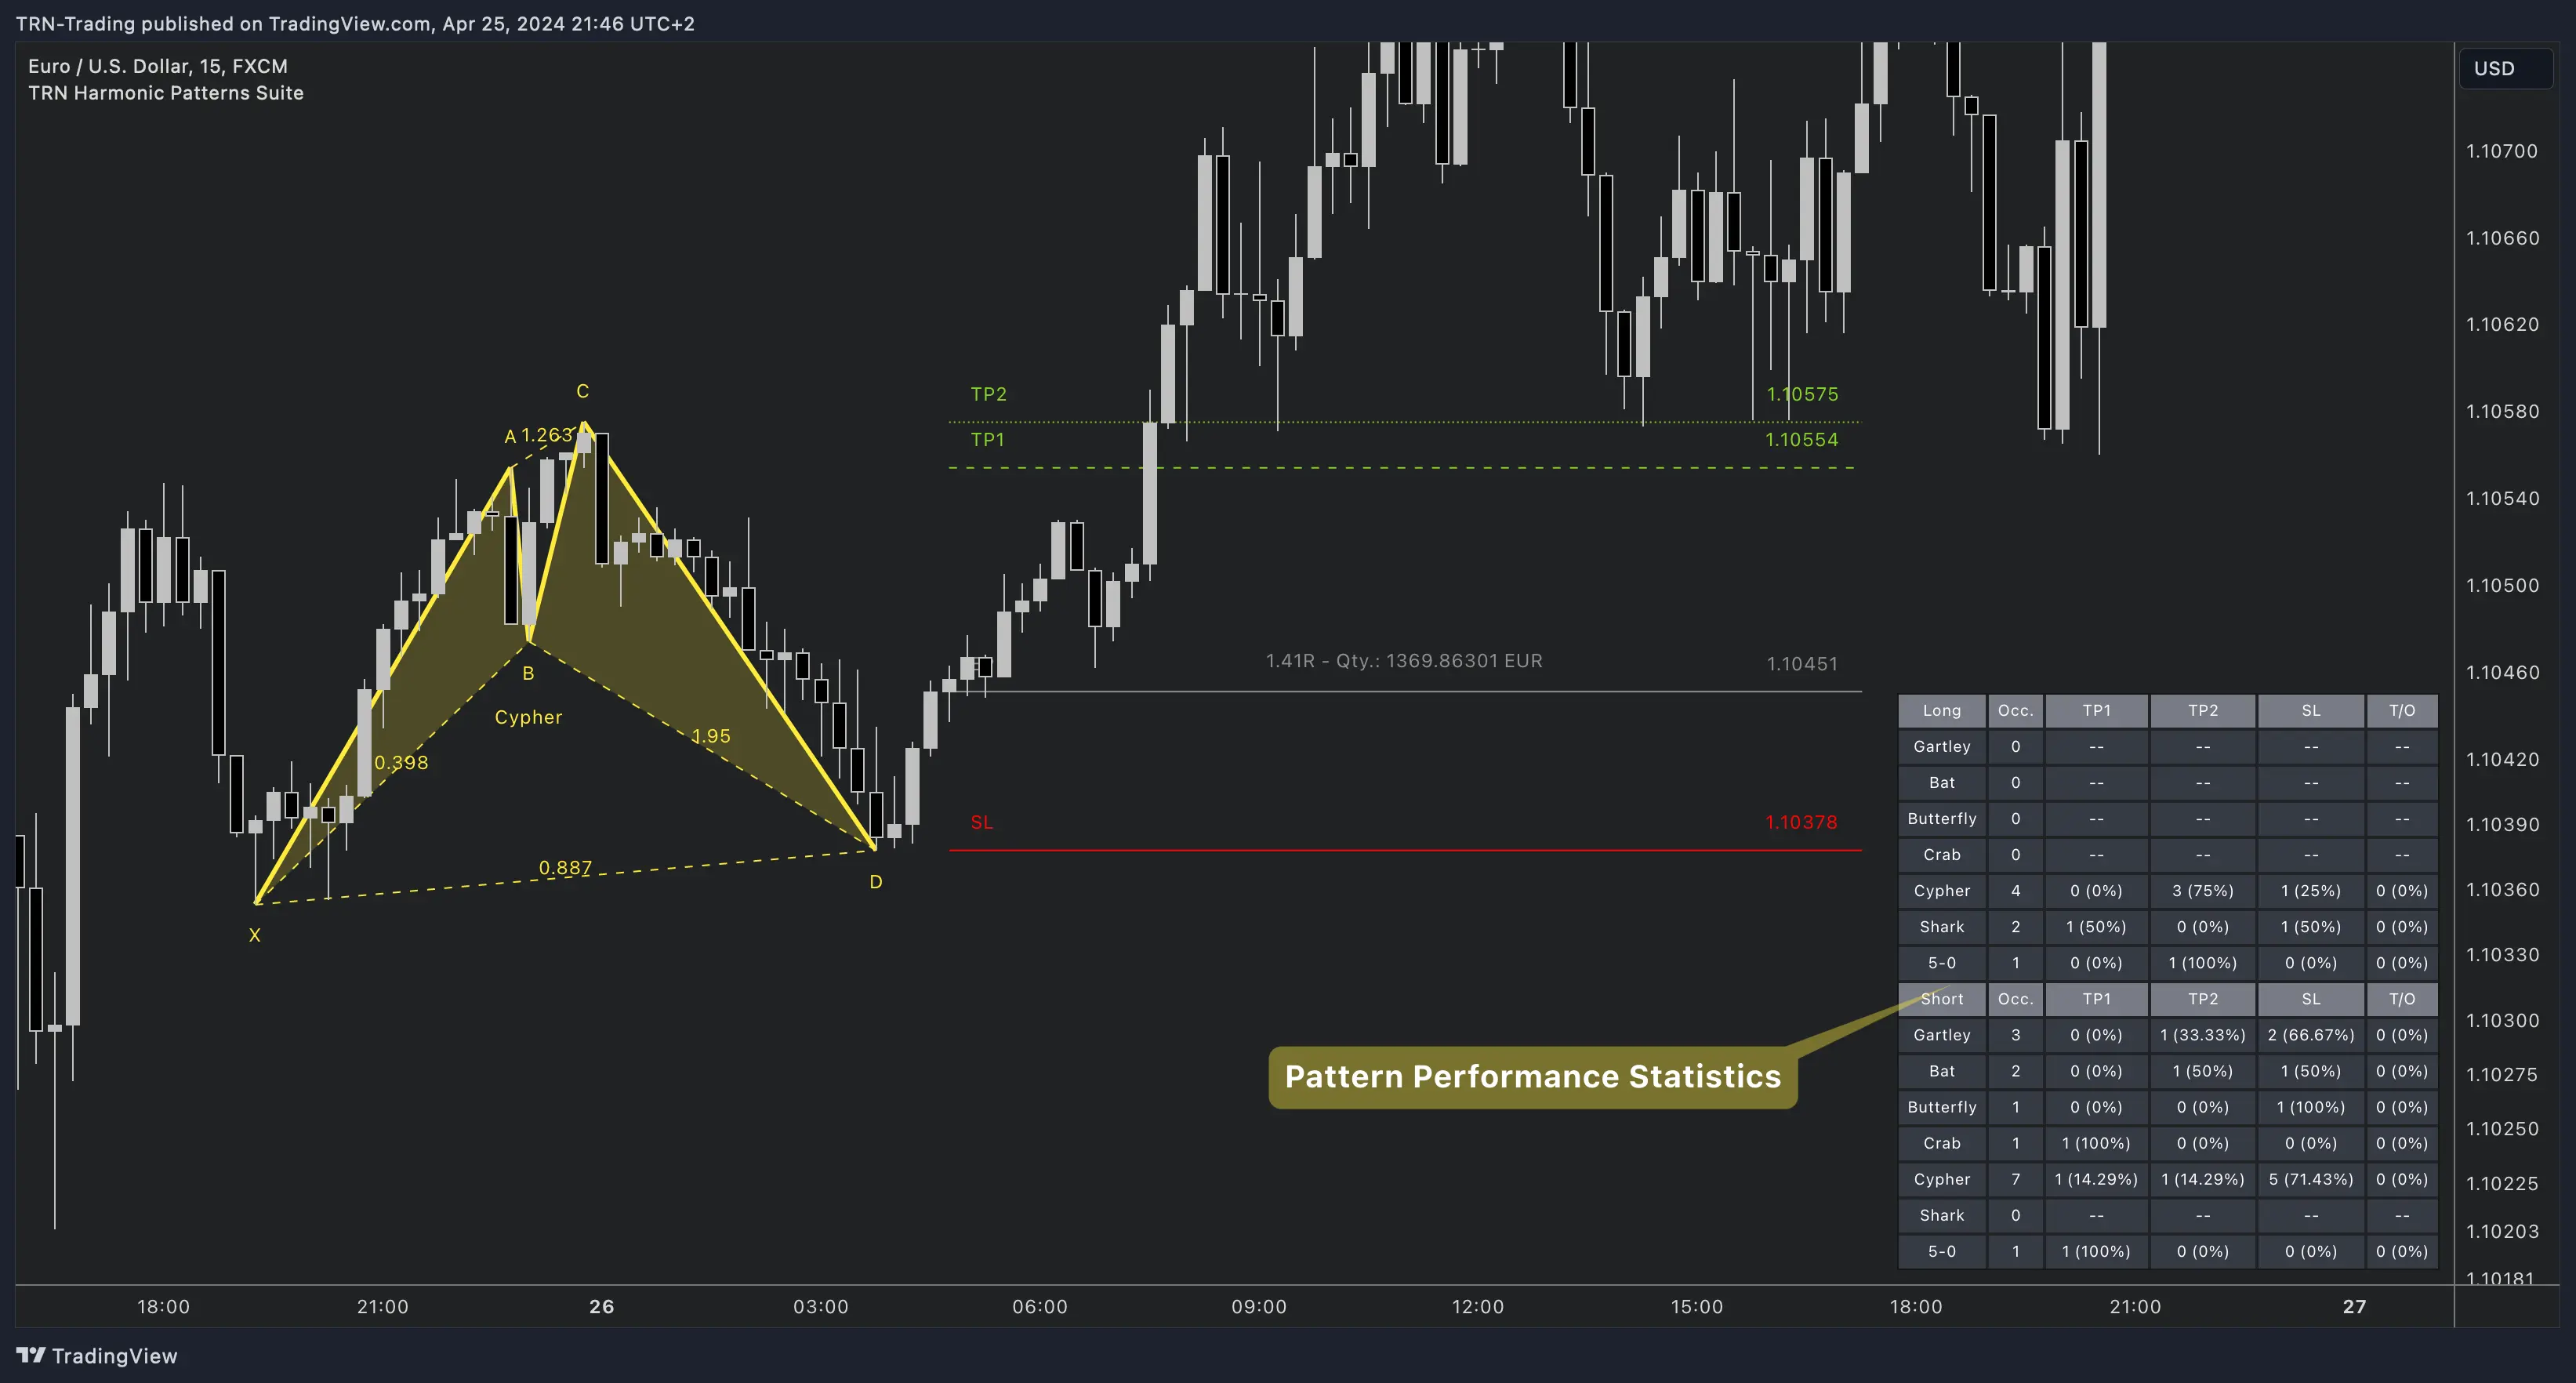
Harmonic Pattern Statistics

Harmonic pattern statistics provide valuable insights into the success rate of a specific pattern on the asset and timeframe you are analyzing. Always review these statistics before entering a trade to make informed decisions.
Understanding the Statistics
The initial columns, labeled "Short" and "Long", categorize identified breakouts based on different harmonic patterns. The subsequent columns provide detailed metrics for each pattern:
- Occ. (Occurrence): The number of times the pattern has occurred, categorized by the values of R from the first column.
- TP1, TP2 (Take Profit): The success rate of hitting Take Profit targets 1 and 2.
- SL (Stop Loss): The frequency of hitting the Stop Loss level.
- T/O (Time Out): Instances where neither the Stop Loss nor Take Profit targets were hit within a specified time frame.
Why It Matters
These statistics help traders assess the reliability of a pattern and optimize their risk management strategies. By analyzing the occurrence rates, success of take profit levels, and stop loss frequency, you can make more confident trading decisions.
Always combine pattern statistics with other technical analysis tools to validate your trading strategy and improve accuracy.
FAQ
What is considered a good success rate for harmonic patterns?
A success rate above 60% for TP1 is considered good. However, the overall profitability depends on your risk-reward ratio and position sizing strategy. Learn more about risk management.
Do success rates vary by timeframe?
Yes, higher timeframes (4H and above) typically show better success rates due to reduced market noise. Our statistics tool helps you analyze pattern performance across different timeframes.
How can I optimize my trading based on these statistics?
Focus on patterns with higher success rates and favorable risk-reward ratios. Consider using breakout confirmation methods to improve entry timing.