Harmonic Patterns Detection
TRN's Harmonic Patterns Suite identifies 7 Fibonacci-based patterns with precision. Our algorithm scans for these complex formations across multiple timeframes, providing real-time alerts and statistical success rates.
Key Components
- XA Leg: The initial price move.
- AB Leg: A retracement of the XA leg, typically 61.8%.
- BC Leg: A retracement of the AB leg, typically 38.2% or 88.6%.
- CD Leg: An extension of the BC leg, typically 127.2% or 161.8%.
Trading Implications
The Gartley pattern signals a potential reversal at point D. Traders often enter a trade at this point, with a stop-loss just beyond it. The target is usually set at the 38.2% or 61.8% retracement of the CD leg.
Butterfly Pattern
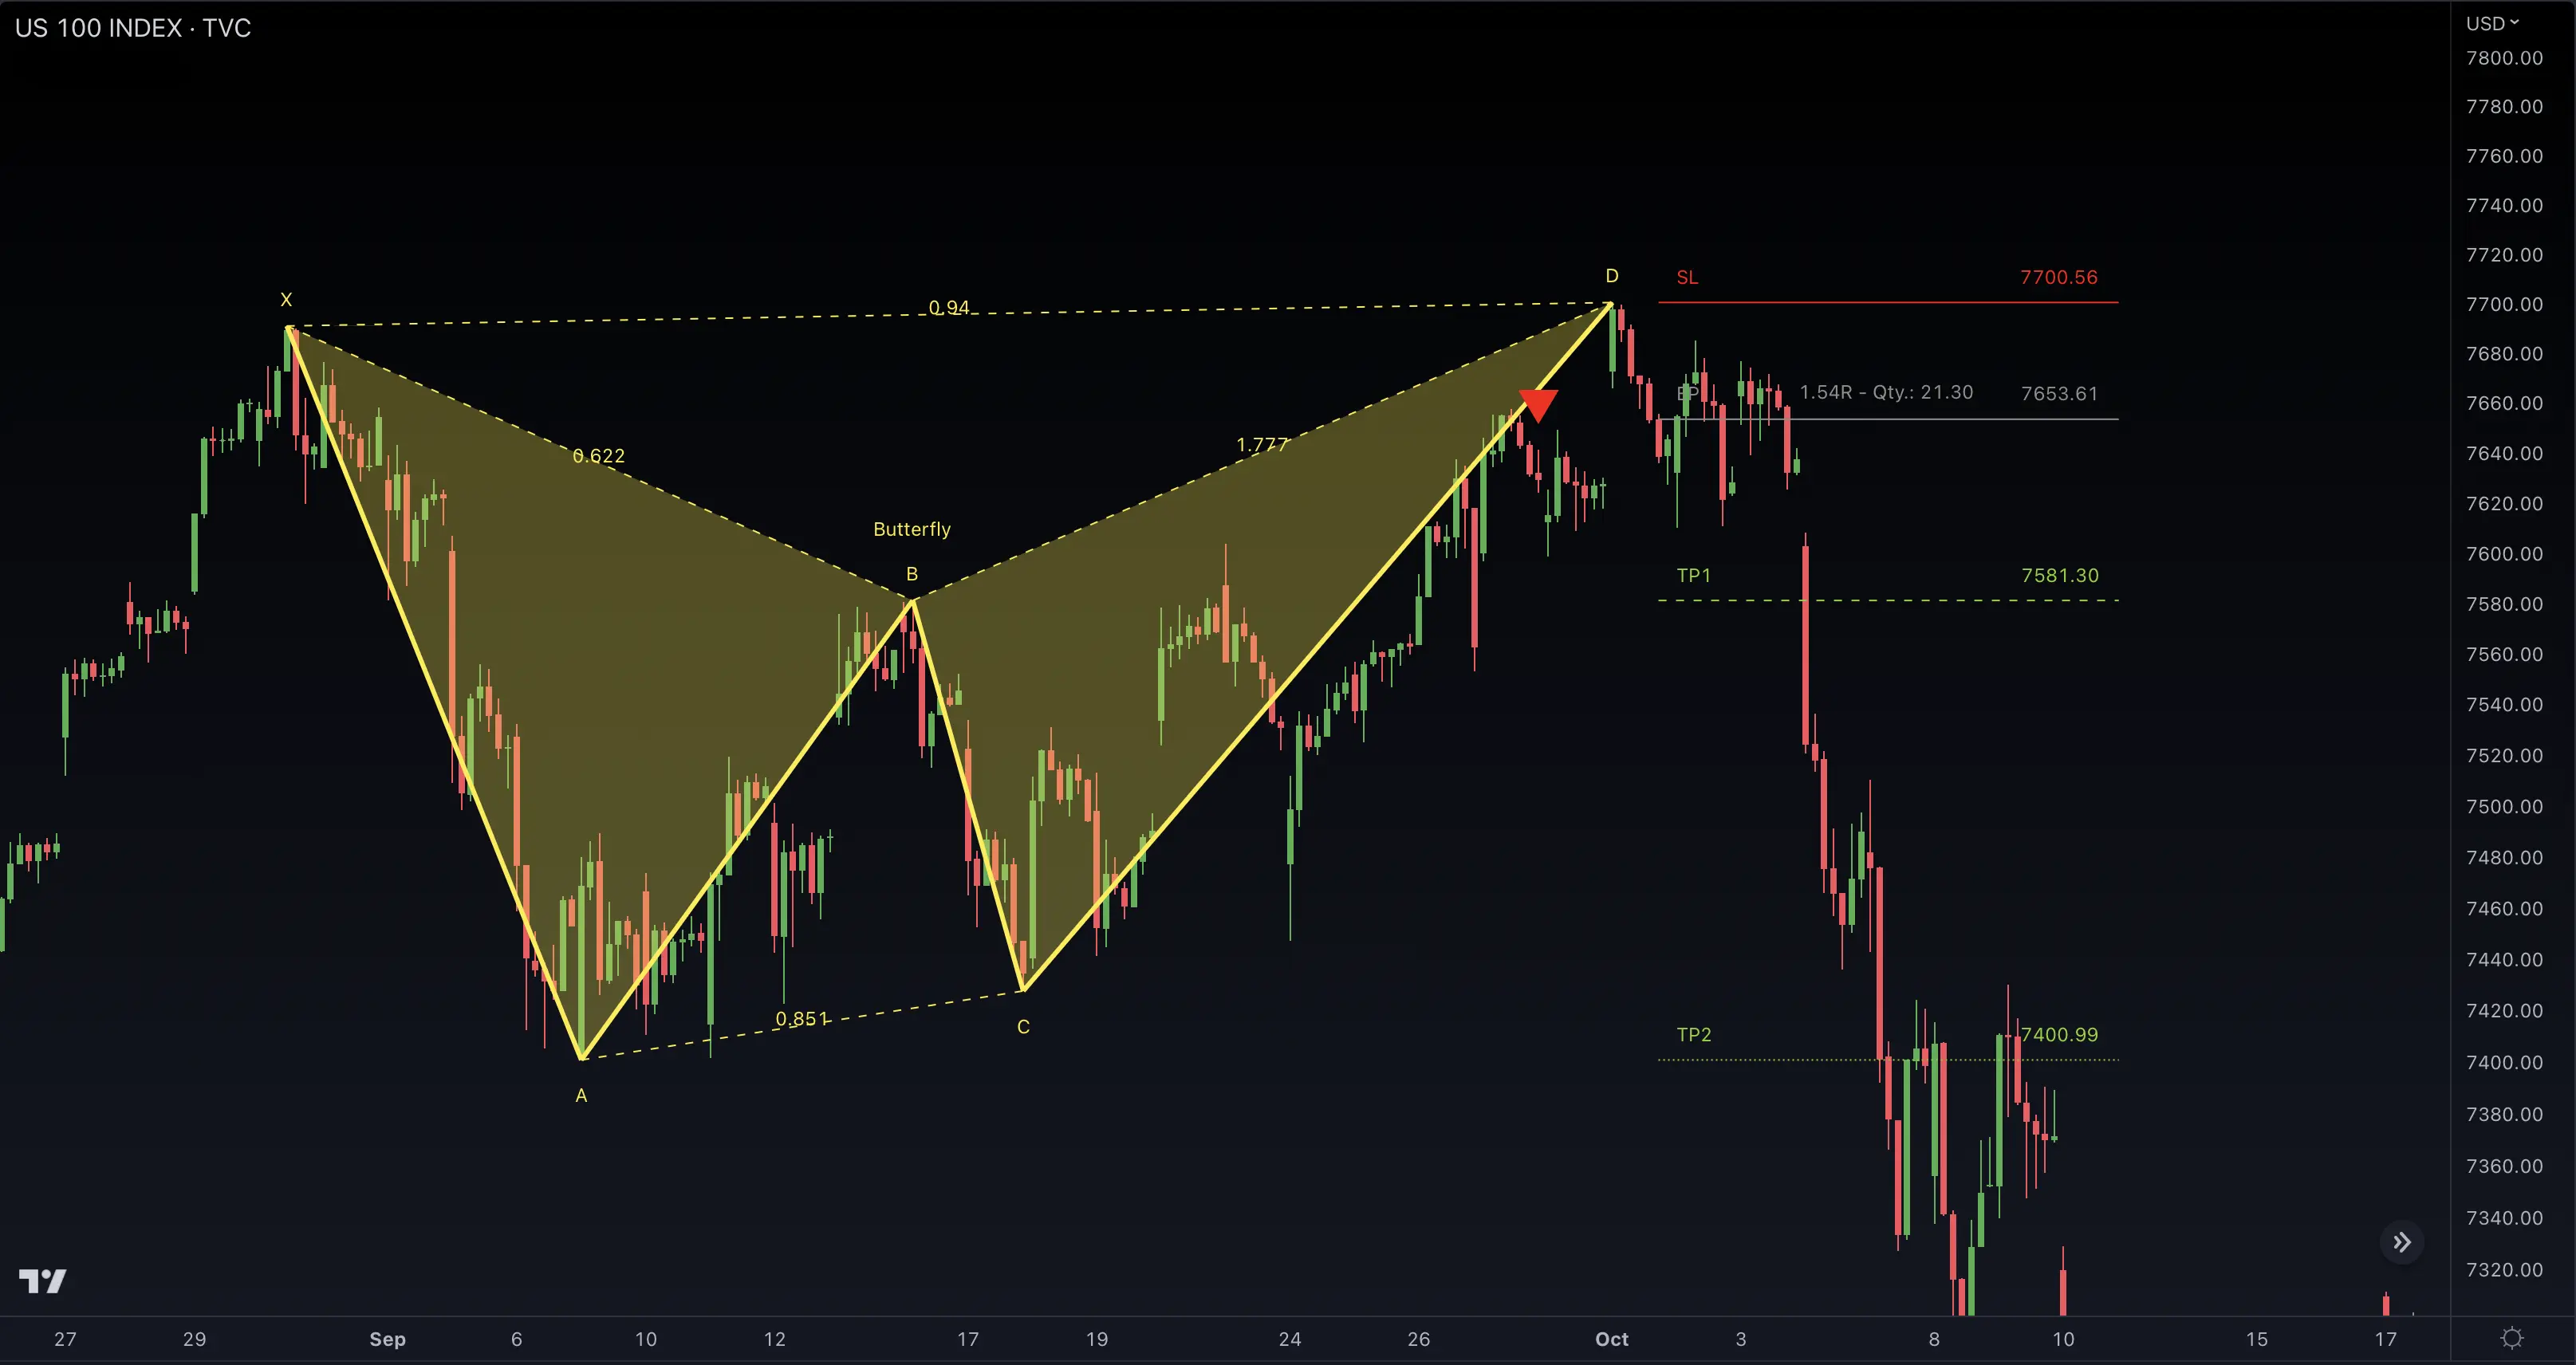
Pattern Formation
The Butterfly pattern is similar to the Gartley but has a more extended CD leg. It also forms an "M" or "W" shape and is identified using specific Fibonacci levels.
Key Components
- XA Leg: The initial price move.
- AB Leg: A retracement of the XA leg, typically 78.6%.
- BC Leg: A retracement of the AB leg, typically 38.2% or 88.6%.
- CD Leg: An extension of the BC leg, typically 161.8% or 224%.
Trading Implications
The Butterfly pattern signals a potential reversal at point D. Traders often enter a trade at this point, with a stop-loss just beyond it. The target is usually set at the 38.2% or 61.8% retracement of the CD leg.
Bat Pattern
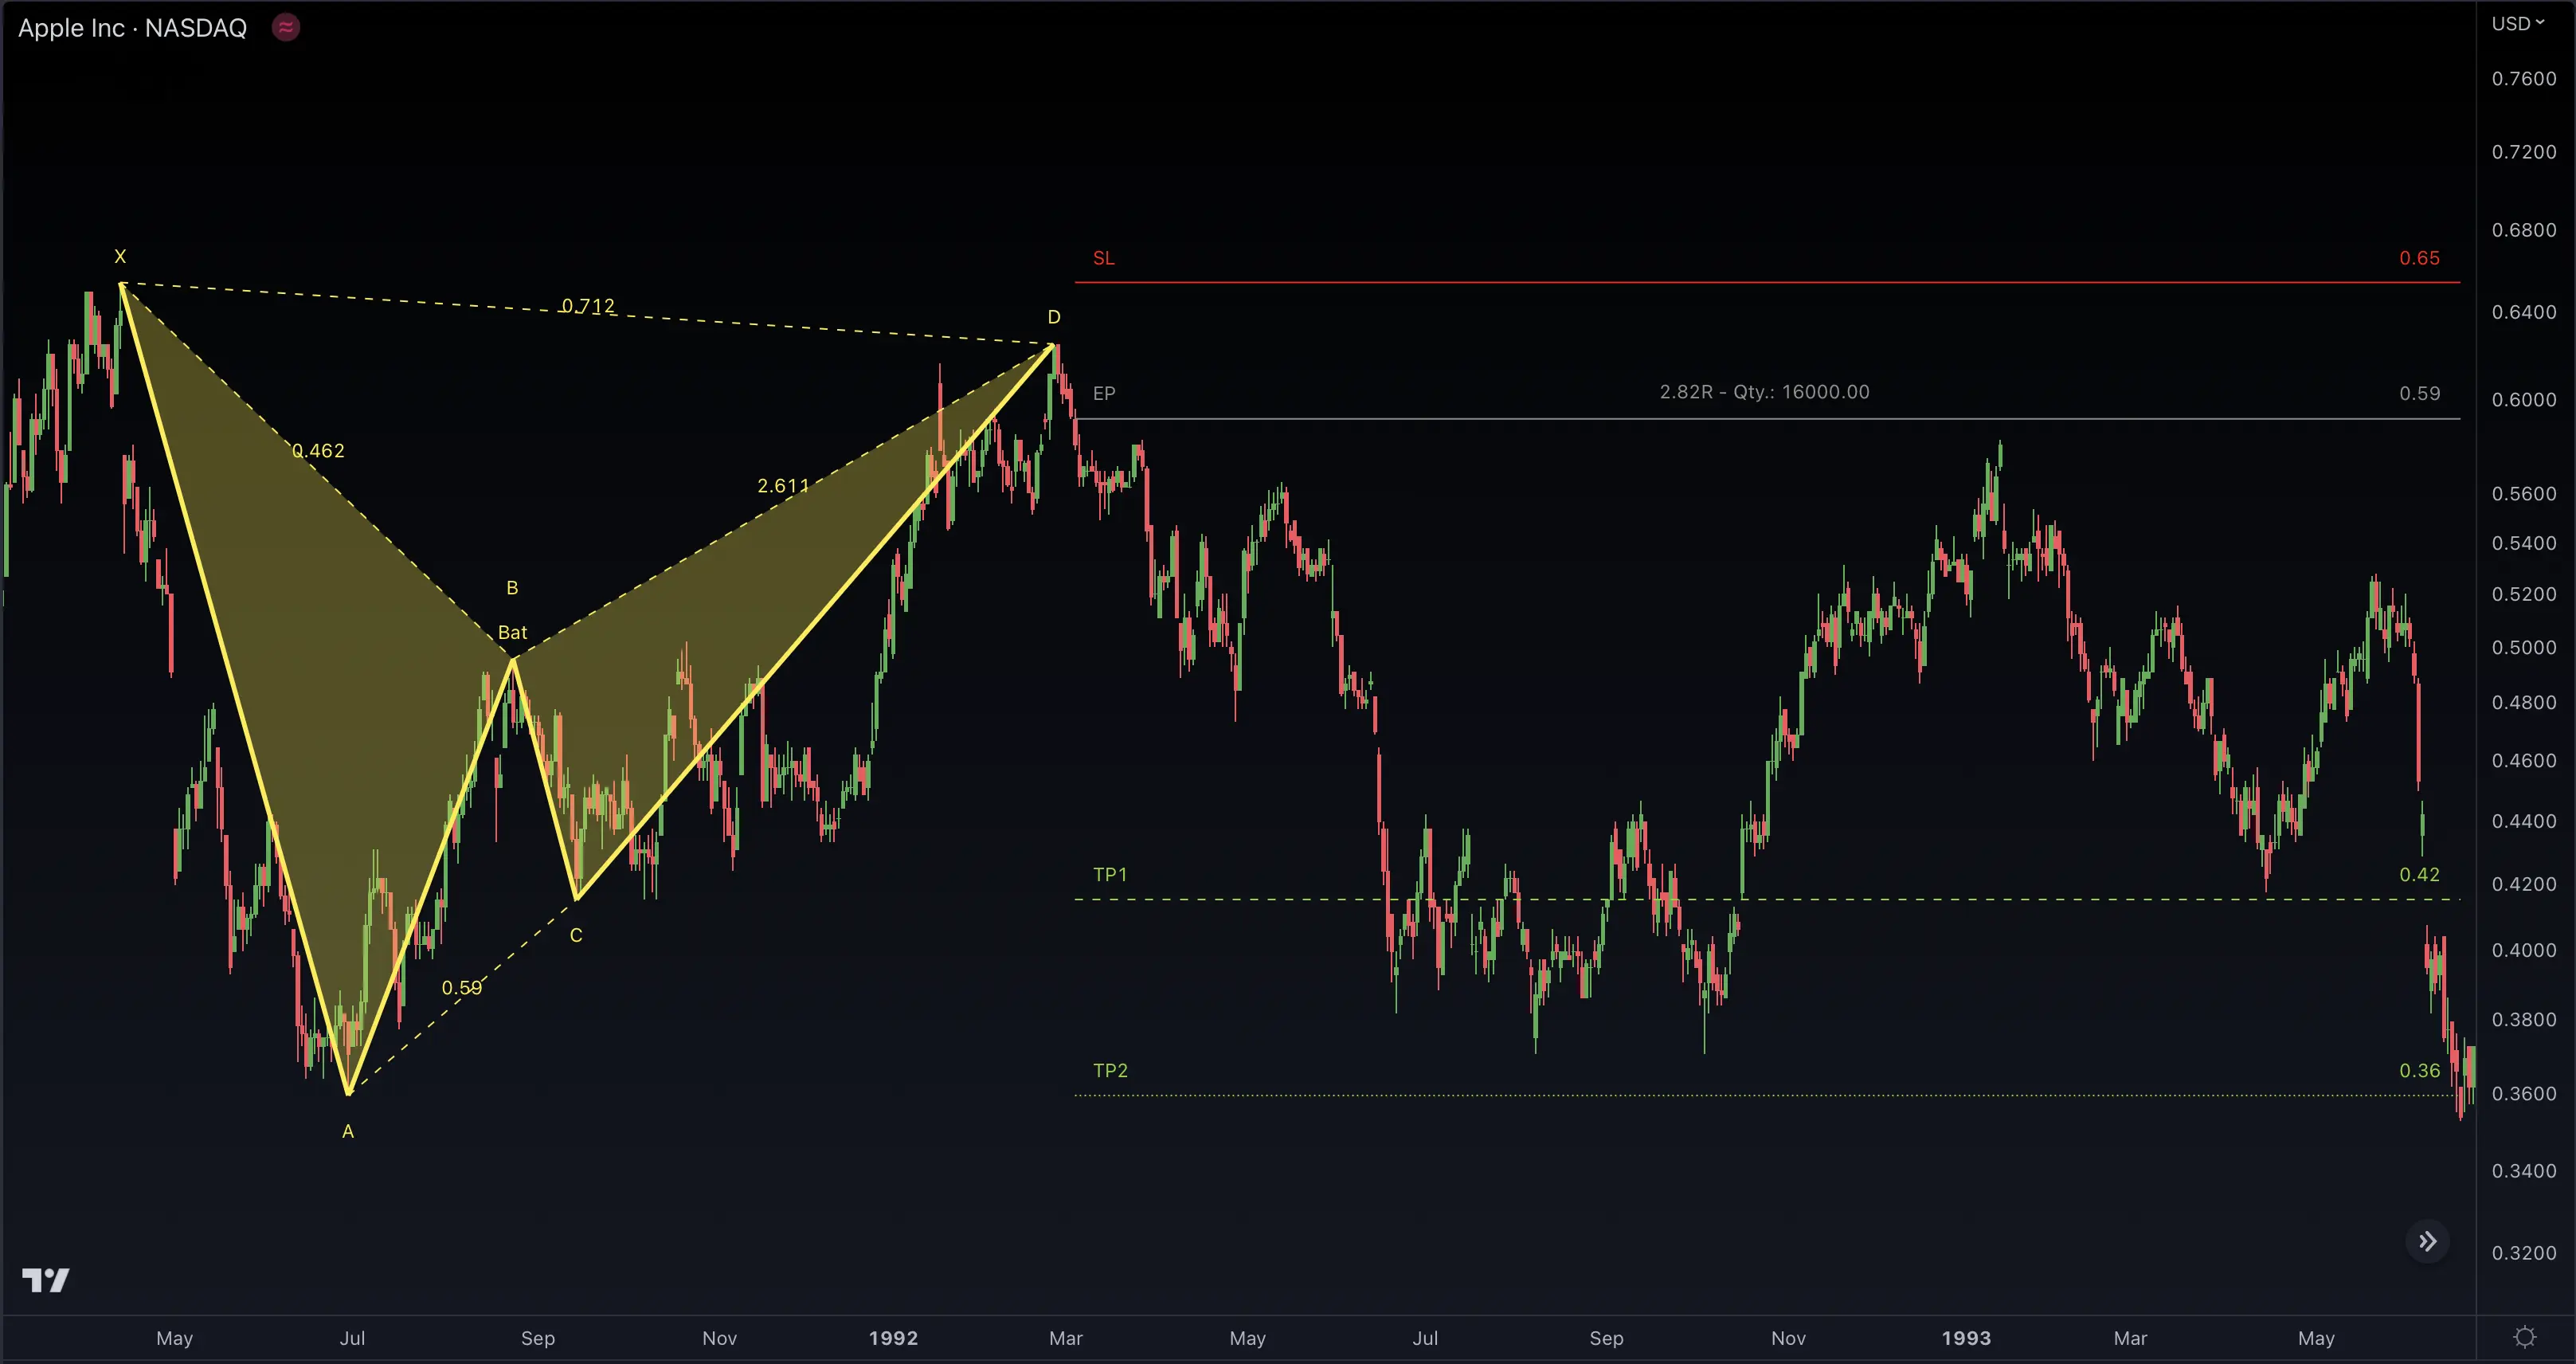
Pattern Formation
The Bat pattern is a variation of the Gartley pattern with a more precise Fibonacci retracement level for the AB leg. It also forms an "M" or "W" shape.
Key Components
- XA Leg: The initial price move.
- AB Leg: A retracement of the XA leg, typically 38.2% or 50%.
- BC Leg: A retracement of the AB leg, typically 38.2% or 88.6%.
- CD Leg: An extension of the BC leg, typically 161.8% or 261.8%.
Trading Implications
The Bat pattern signals a potential reversal at point D. Traders often enter a trade at this point, with a stop-loss just beyond it. The target is usually set at the 38.2% or 61.8% retracement of the CD leg.
5-0 Pattern
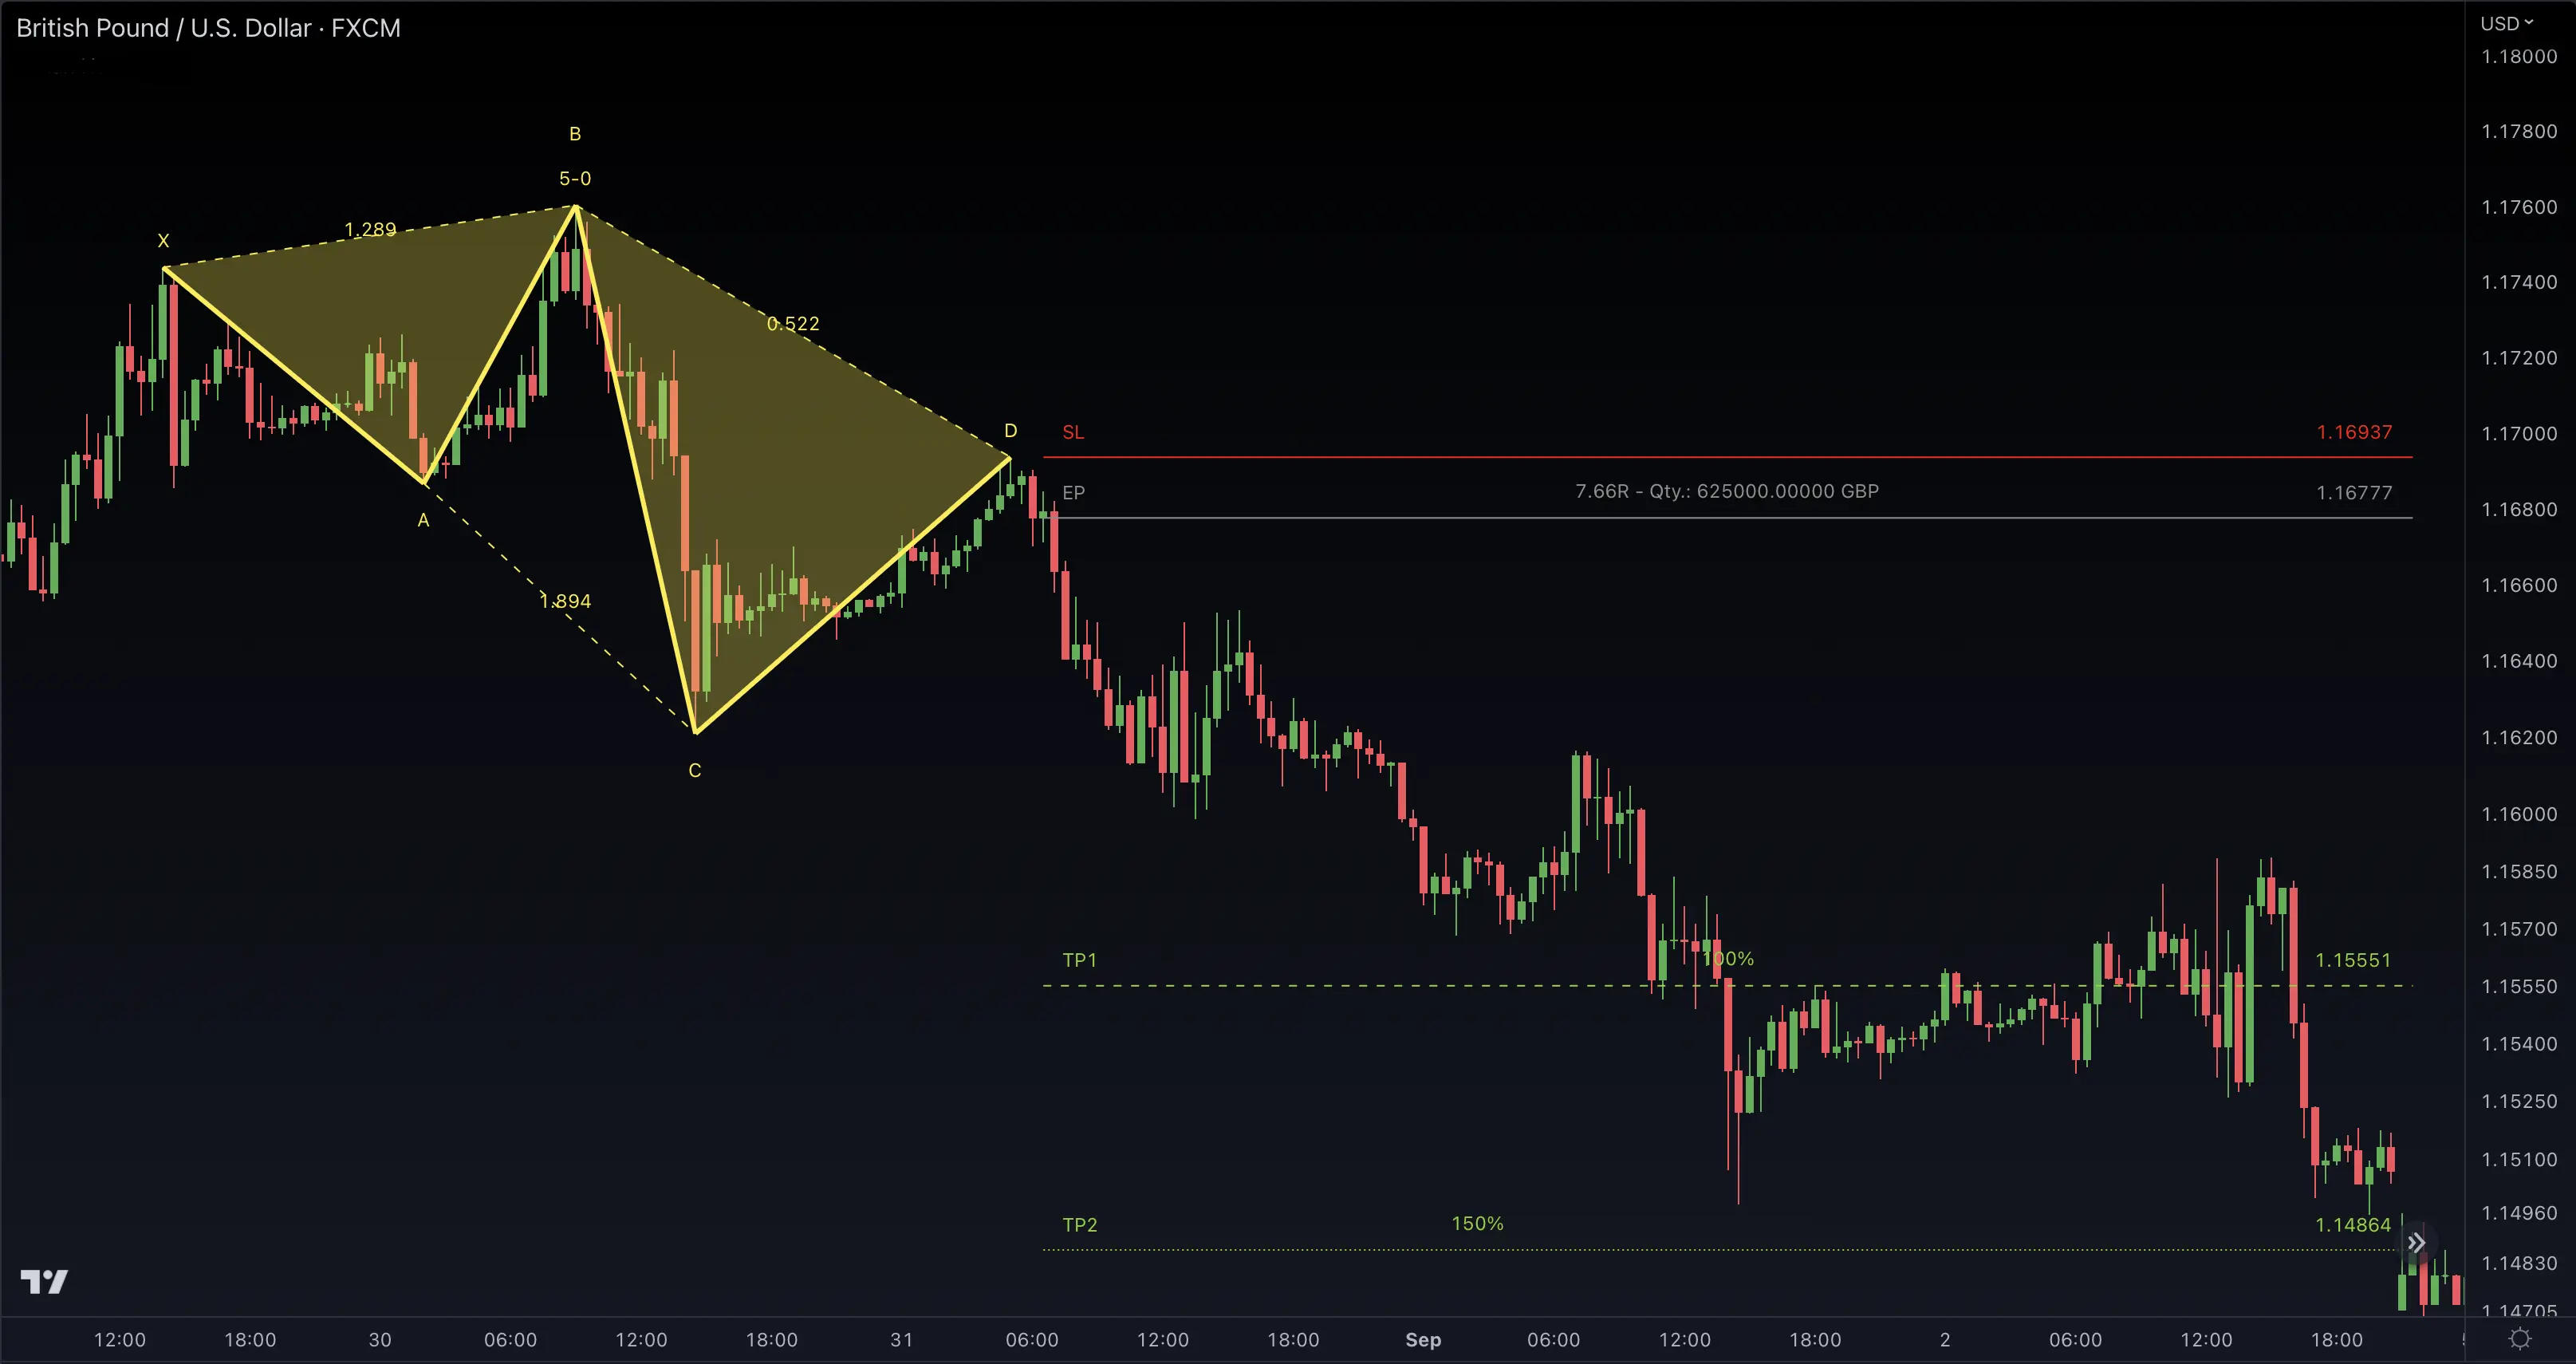
Pattern Formation
The 5-0 pattern is a newer harmonic pattern that consists of five price swings. It is identified using specific Fibonacci retracement and extension levels.
Key Components
- XA Leg: The initial price move.
- AB Leg: A retracement of the XA leg, typically 113% or 161.8%.
- BC Leg: A retracement of the AB leg, typically 161.8% or 224%.
- CD Leg: An extension of the BC leg, typically 161.8% or 261.8%.
- DE Leg: An extension of the CD leg, typically 127.2% or 161.8%.
Trading Implications
The 5-0 pattern signals a potential reversal at point E. Traders often enter a trade at this point, with a stop-loss just beyond it. The target is usually set at the 38.2% or 61.8% retracement of the DE leg.
Crab Pattern
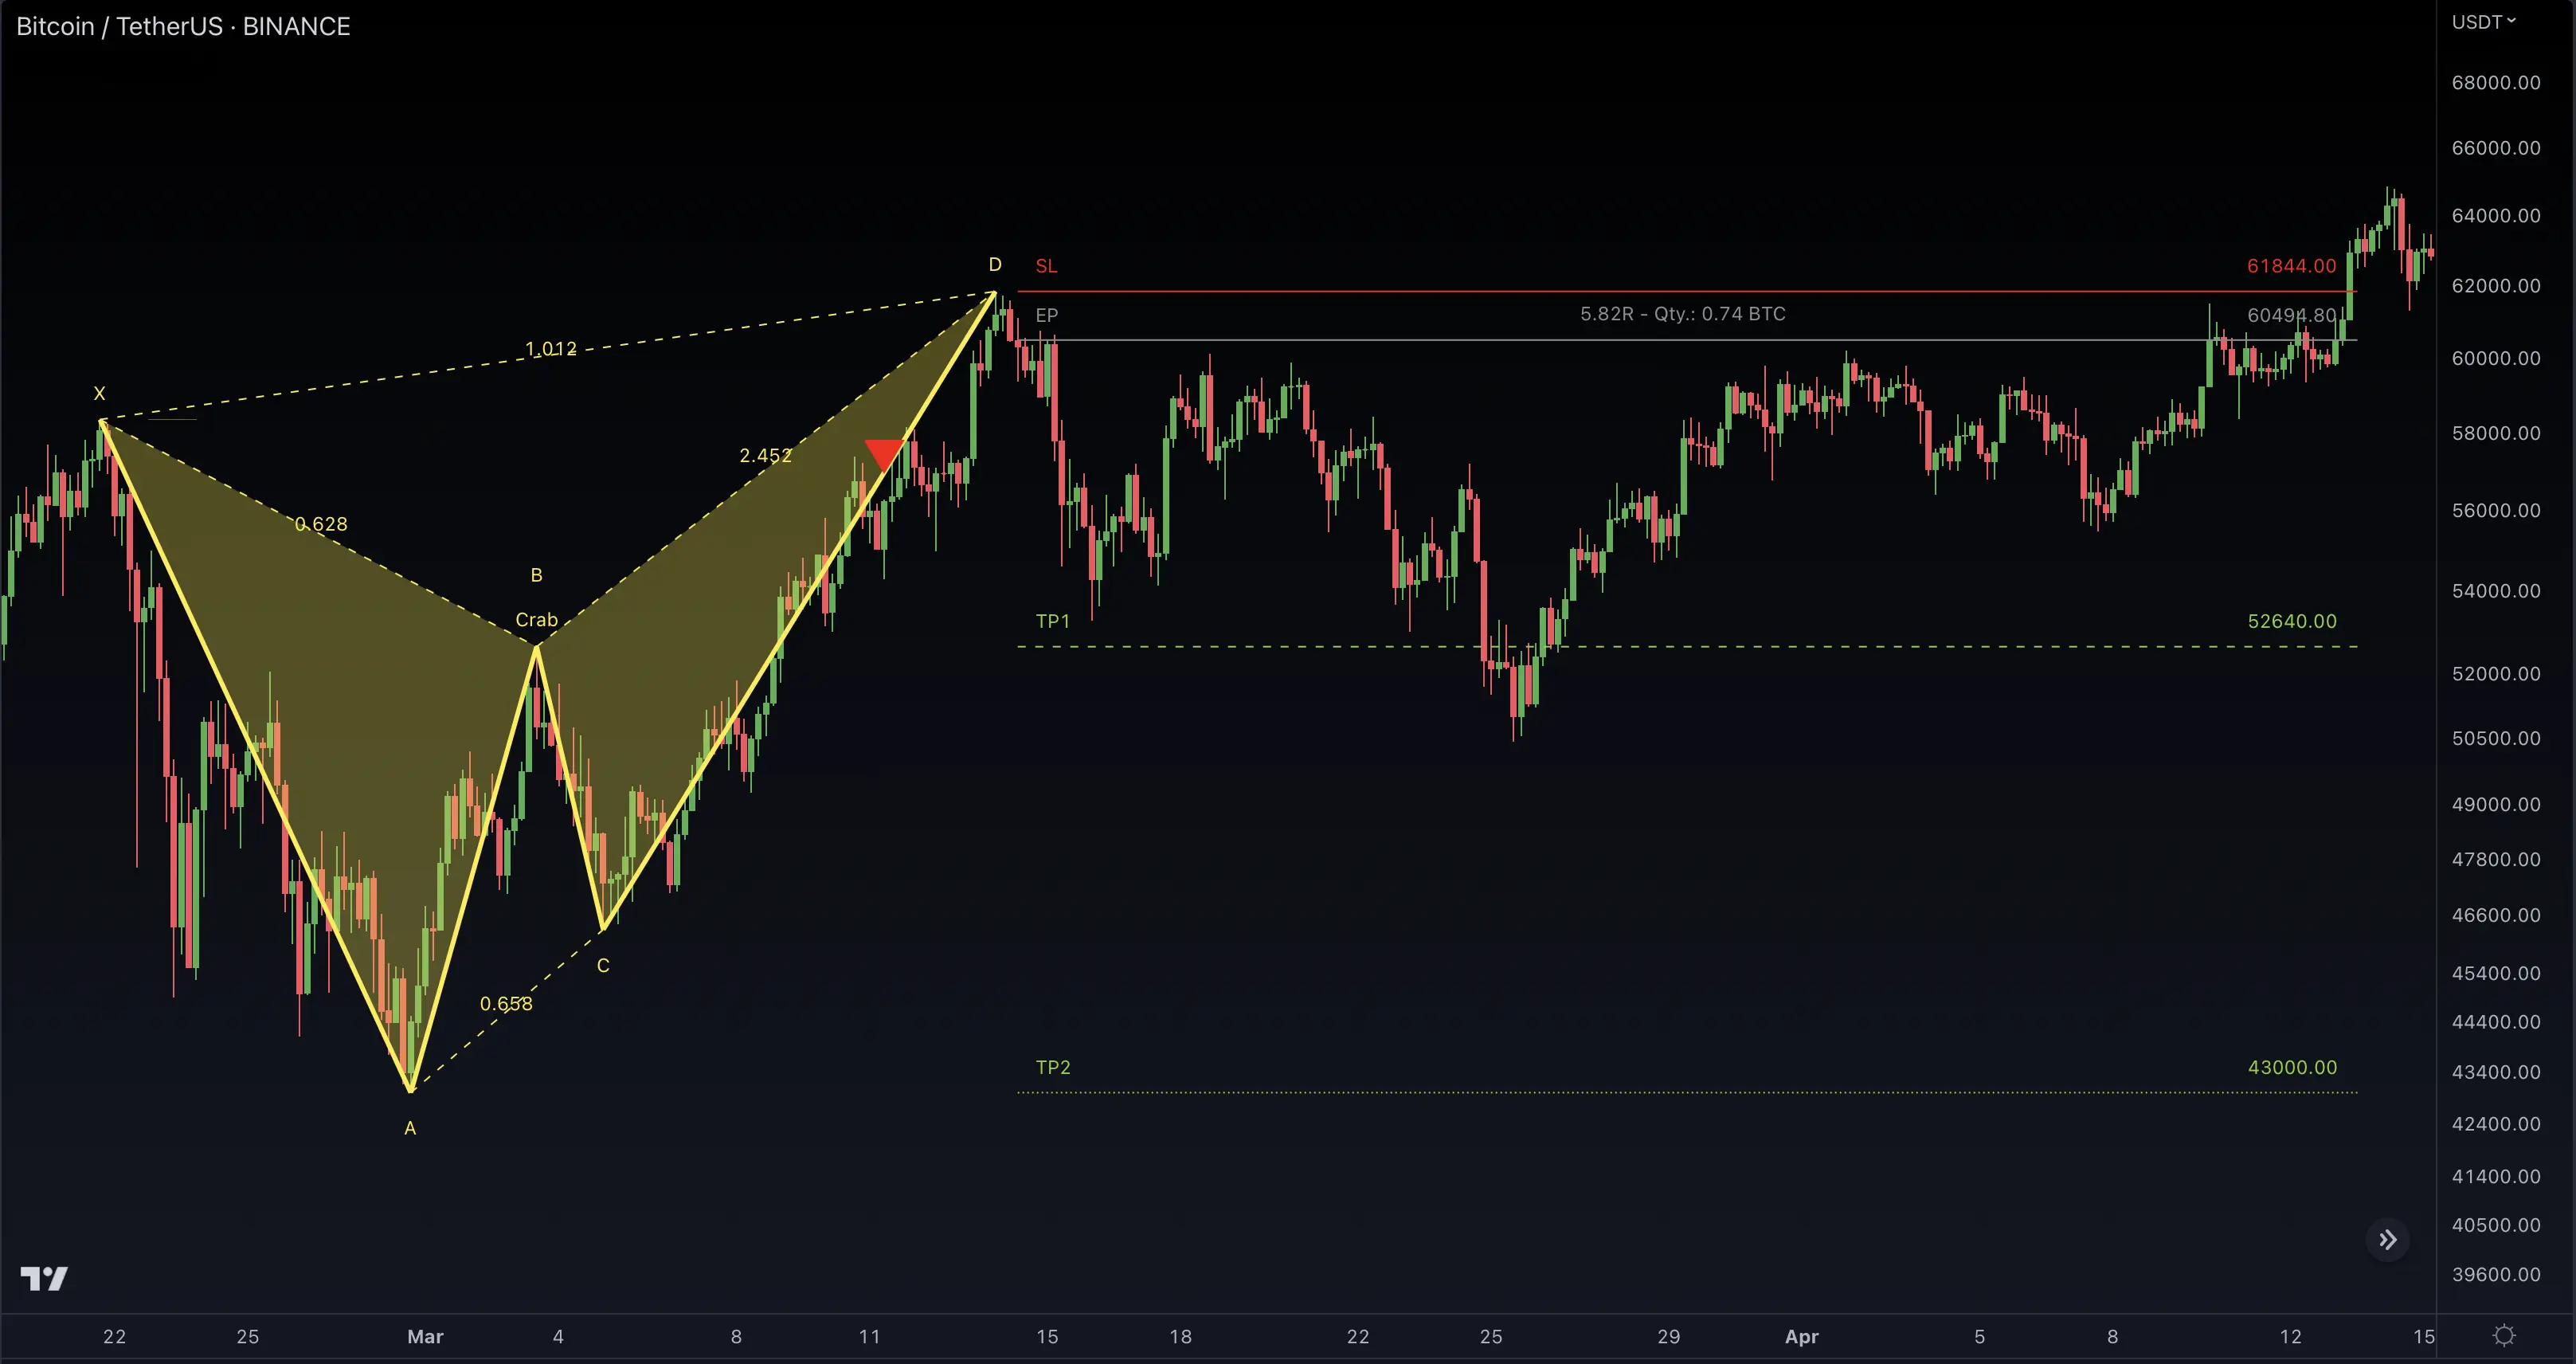
Pattern Formation
The Crab pattern is known for its extreme precision and is identified using specific Fibonacci retracement and extension levels. It consists of four price swings.
Key Components
- XA Leg: The initial price move.
- AB Leg: A retracement of the XA leg, typically 38.2% or 61.8%.
- BC Leg: A retracement of the AB leg, typically 38.2% or 88.6%.
- CD Leg: An extension of the BC leg, typically 261.8% or 361.8%.
Trading Implications
The Crab pattern signals a potential reversal at point D. Traders often enter a trade at this point, with a stop-loss just beyond it. The target is usually set at the 38.2% or 61.8% retracement of the CD leg.
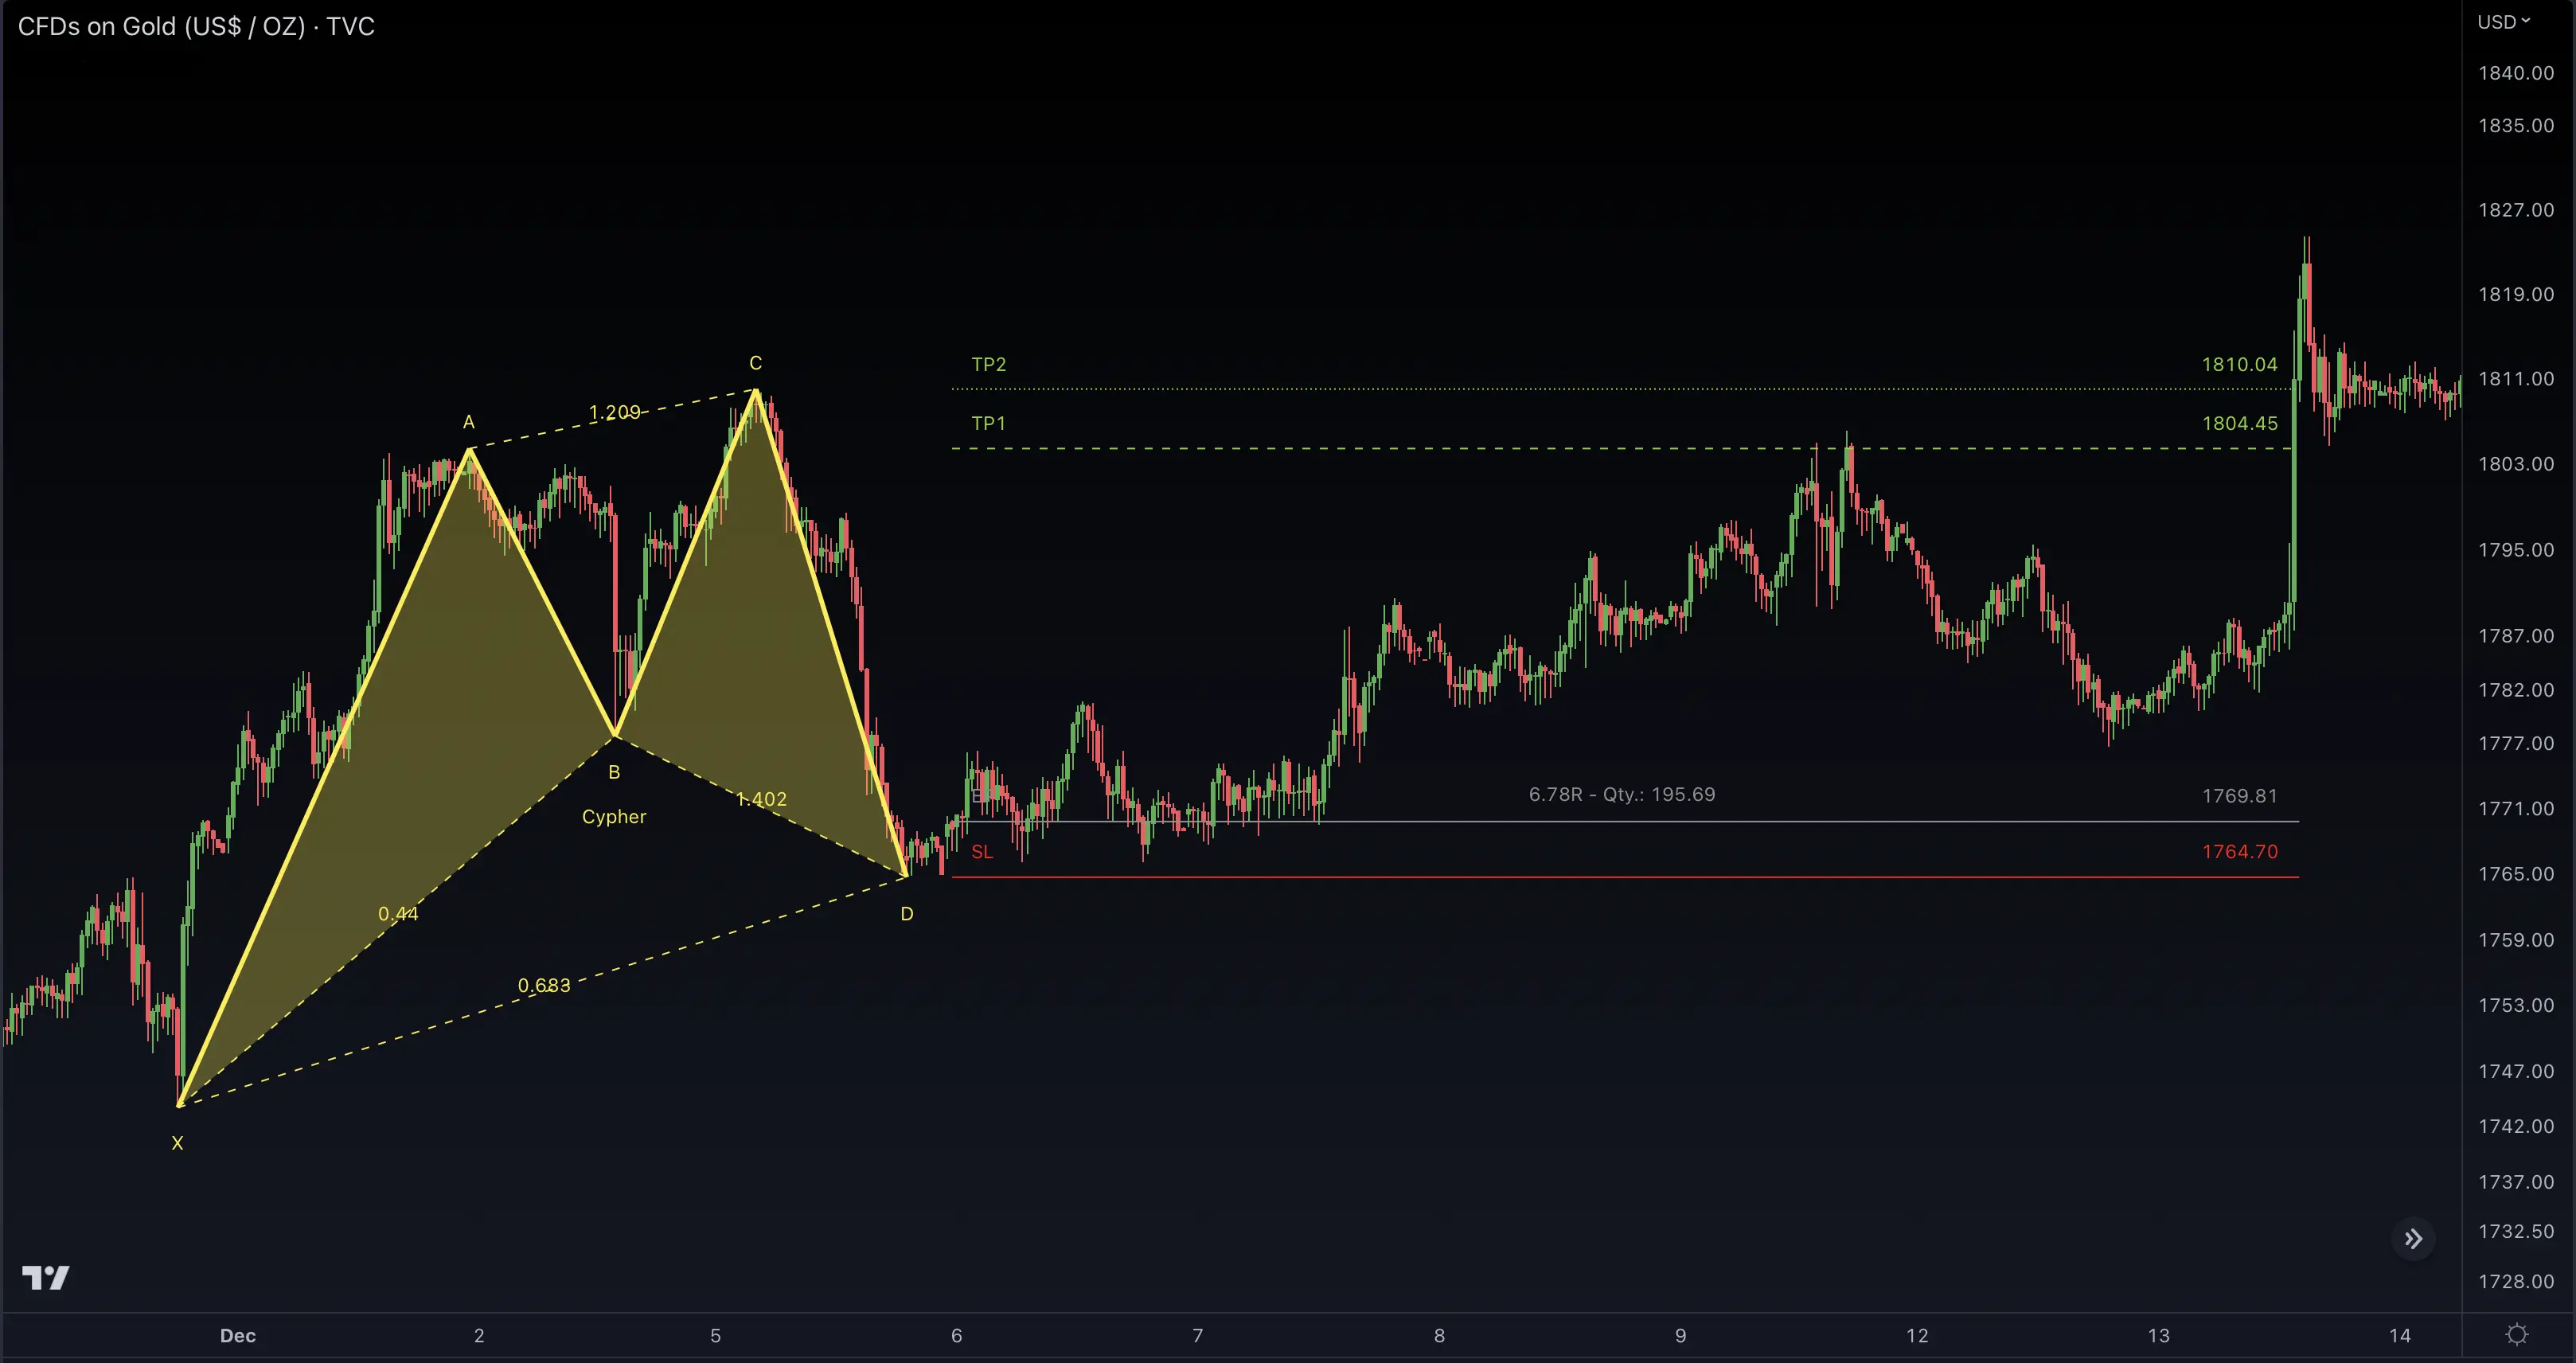
Cypher Pattern
Pattern Formation
The Cypher pattern is a newer harmonic pattern that consists of four price swings. It is identified using specific Fibonacci retracement and extension levels.
Key Components
- XA Leg: The initial price move.
- AB Leg: A retracement of the XA leg, typically 38.2% or 61.8%.
- BC Leg: A retracement of the AB leg, typically 113% or 141.4%.
- CD Leg: An extension of the BC leg, typically 78.6% or 127.2%.
Trading Implications
The Cypher pattern signals a potential reversal at point D. Traders often enter a trade at this point, with a stop-loss just beyond it. The target is usually set at the 38.2% or 61.8% retracement of the CD leg.
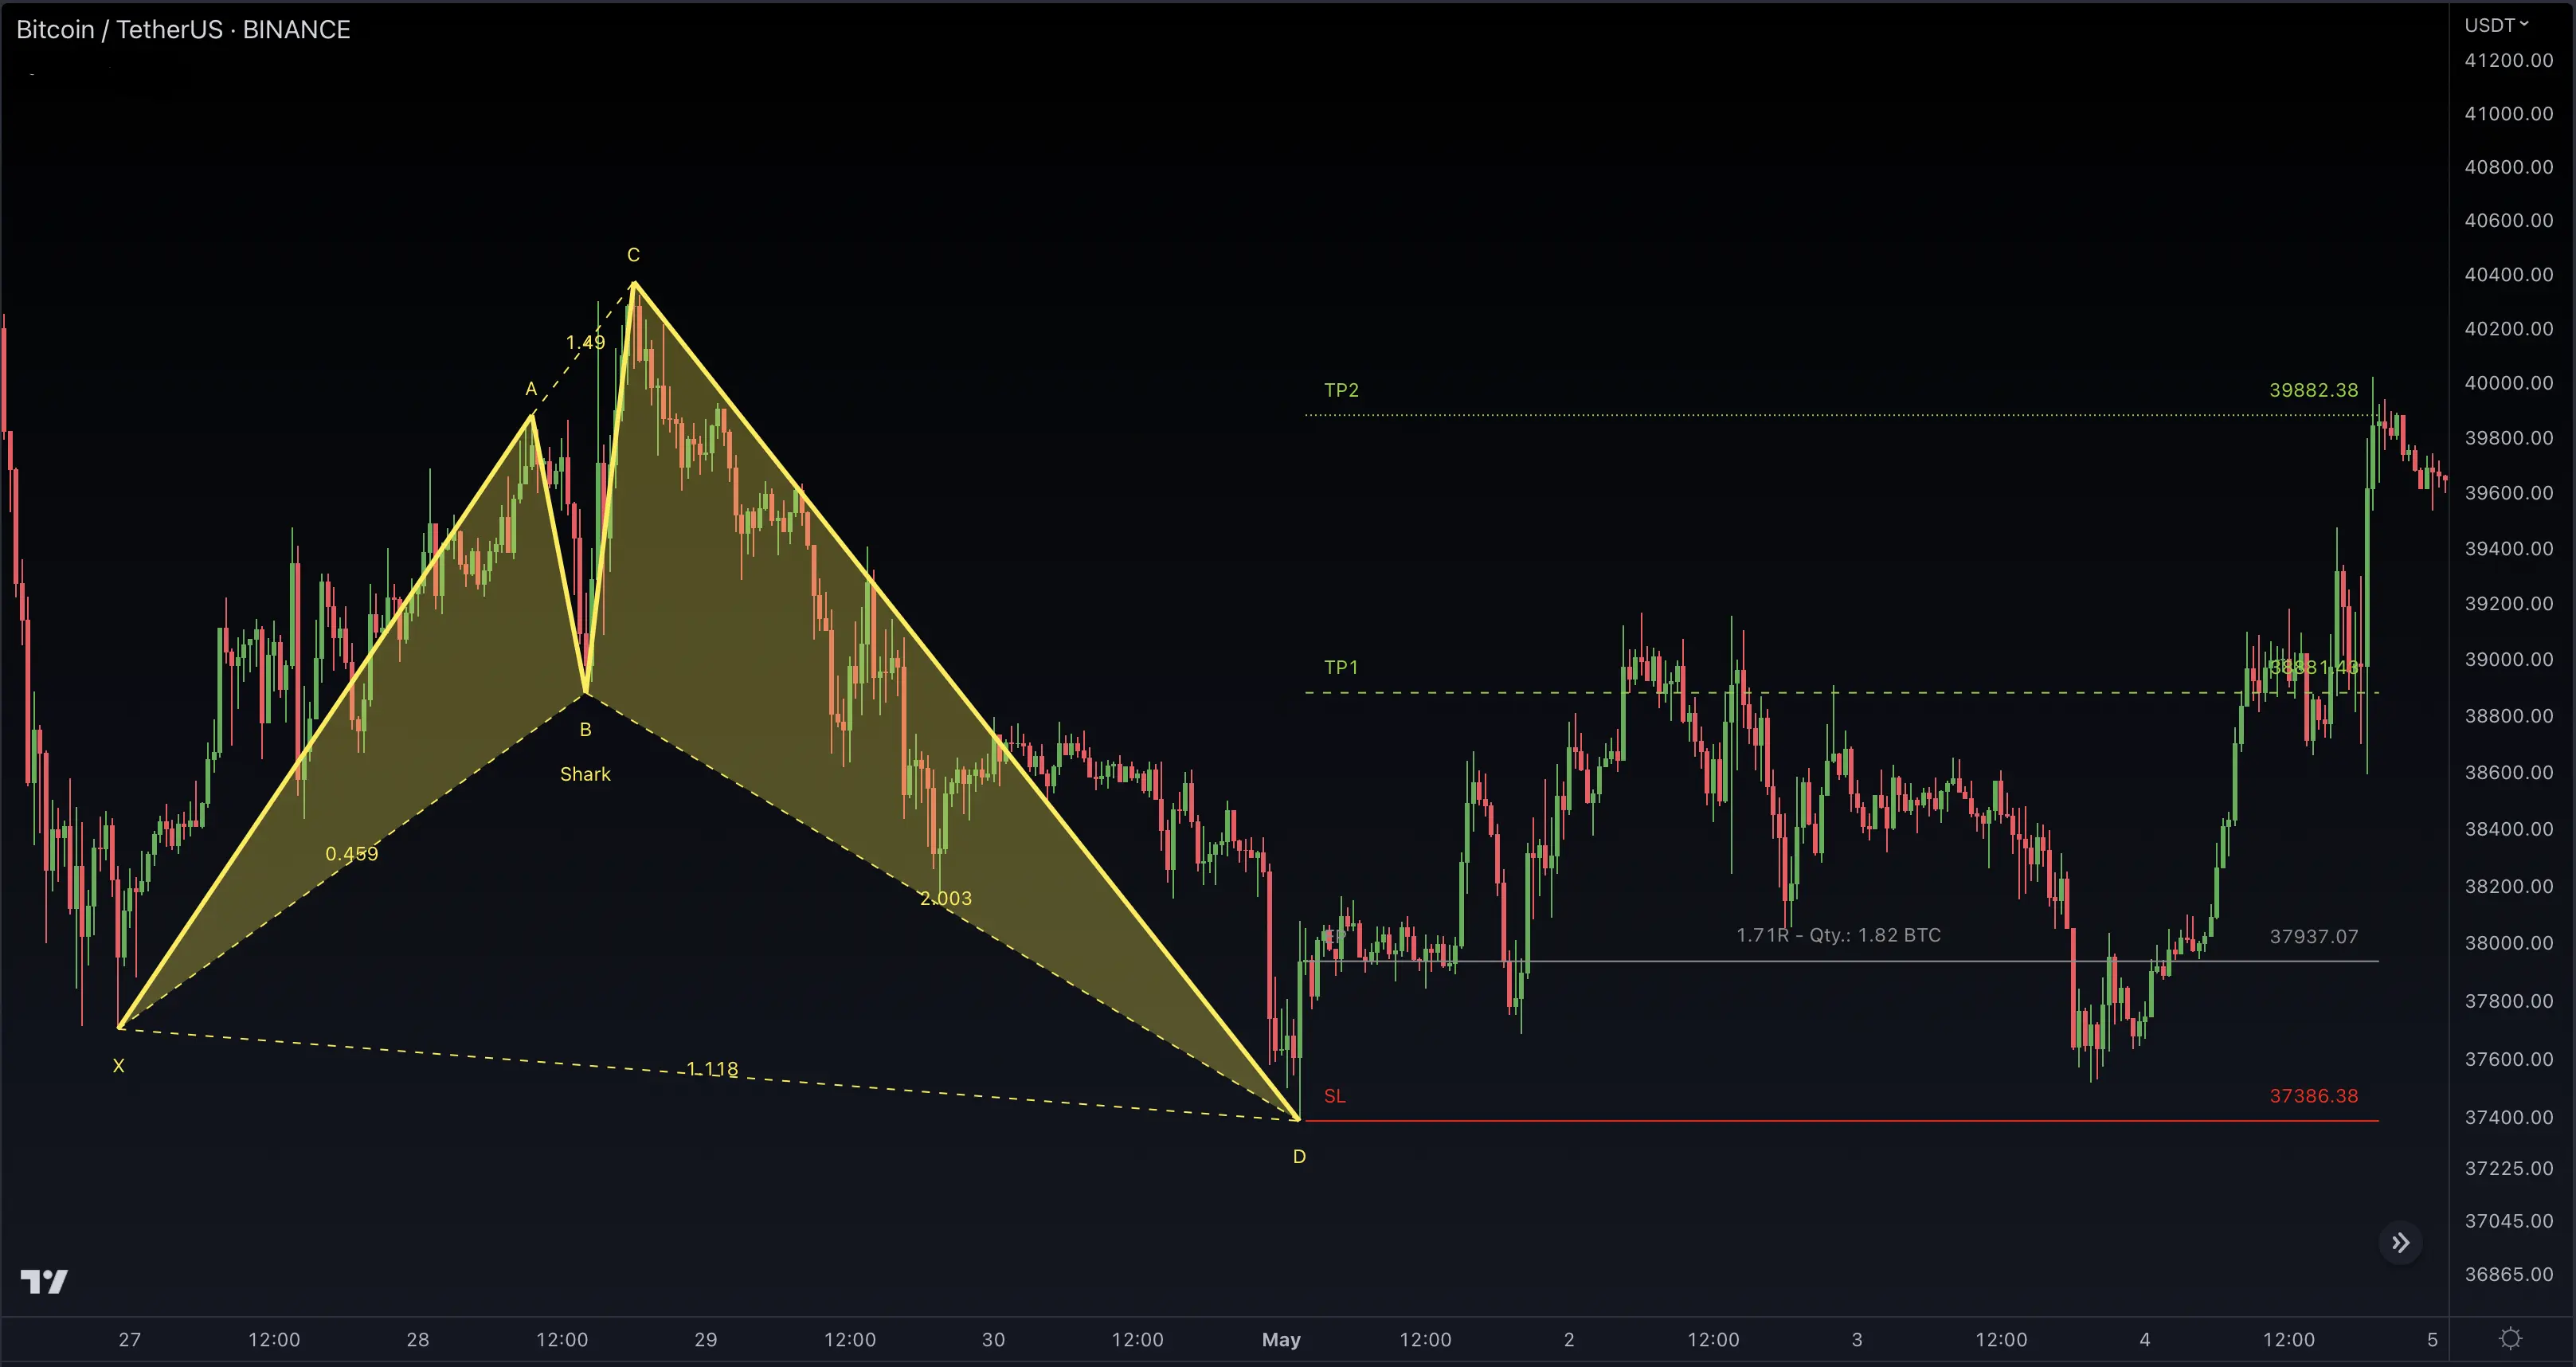
Shark Pattern
Pattern Formation
The Shark pattern is a newer harmonic pattern that consists of four price swings. It is identified using specific Fibonacci retracement and extension levels.
Key Components
- XA Leg: The initial price move.
- AB Leg: A retracement of the XA leg, typically 113% or 161.8%.
- BC Leg: A retracement of the AB leg, typically 161.8% or 224%.
- CD Leg: An extension of the BC leg, typically 161.8% or 261.8%.
Trading Implications
The Shark pattern signals a potential reversal at point D. Traders often enter a trade at this point, with a stop-loss just beyond it. The target is usually set at the 38.2% or 61.8% retracement of the CD leg.
FAQ
Which harmonic pattern is most reliable?
The Gartley and Butterfly patterns are often considered the most reliable due to their well-defined Fibonacci ratios and clear entry/exit points. However, success rates vary by market conditions and timeframe.
How can I confirm harmonic pattern signals?
Combine pattern signals with other technical indicators like Trend Bars Pro or divergence analysis. Also, check for support/resistance levels and market structure.
Why are Fibonacci ratios important in harmonic patterns?
Fibonacci ratios help identify precise reversal points and potential profit targets. They represent natural market rhythms and are used by many traders, creating self-fulfilling price action at these levels.