TRN Chart Patterns & TRN Swings/Divergence
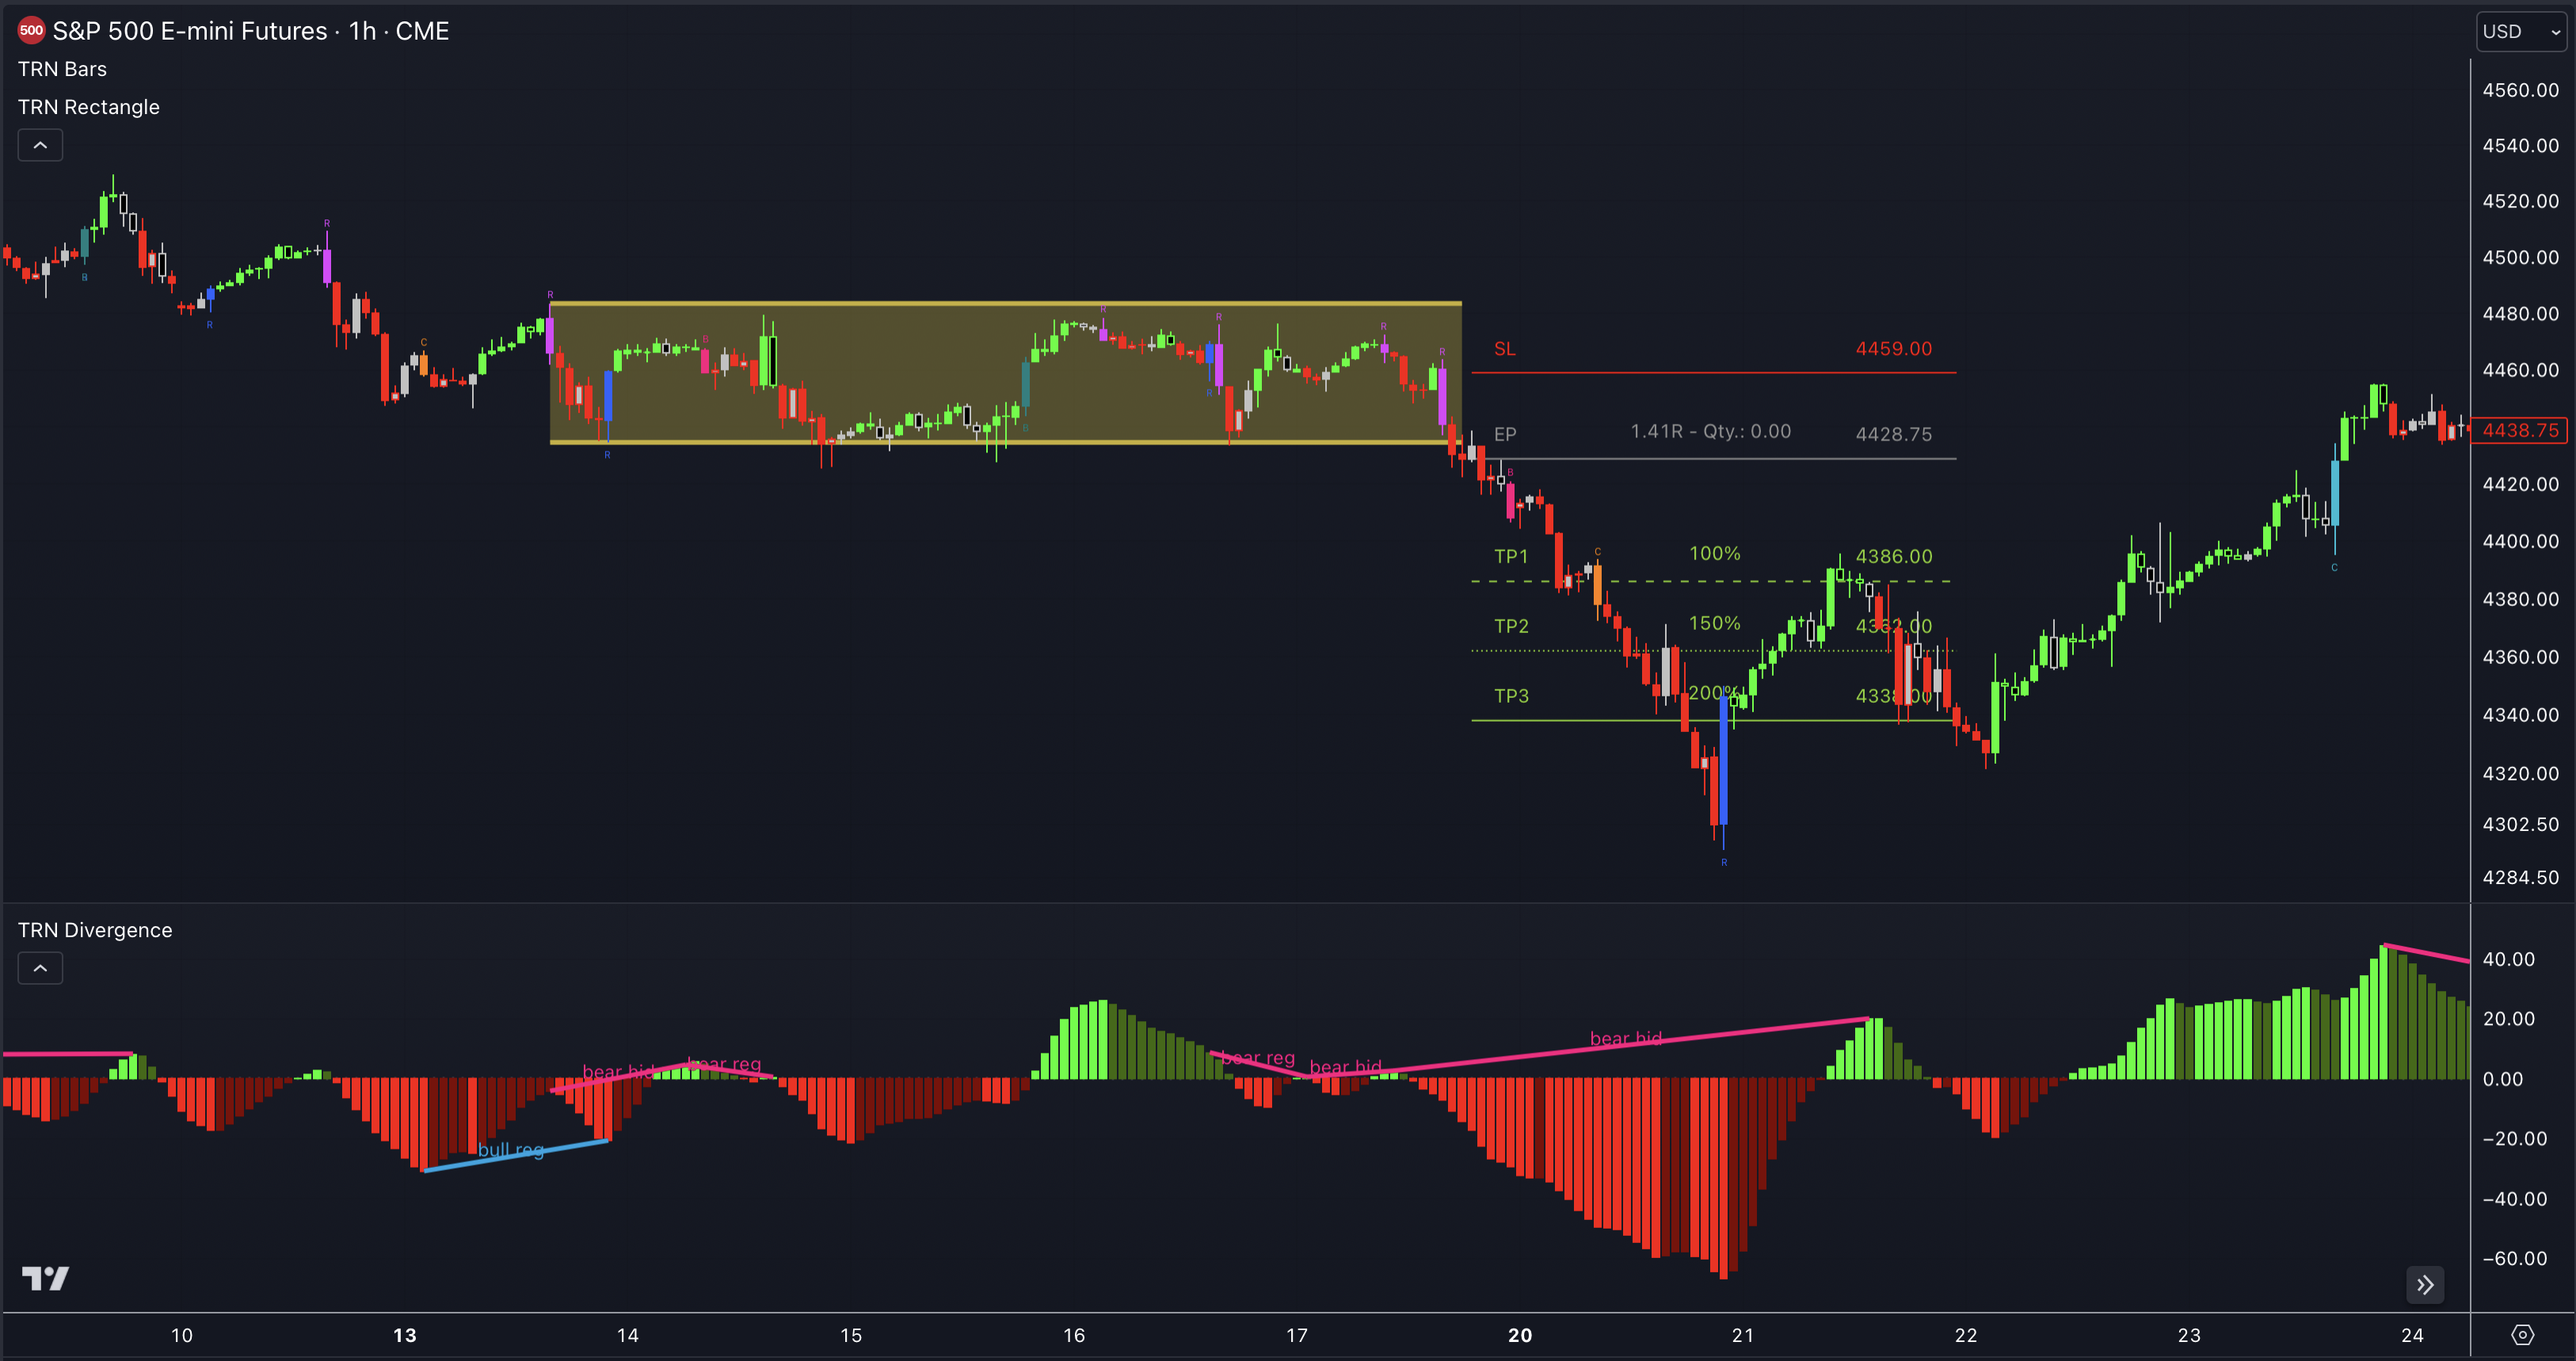
Chart patterns and oscillators provide different perspectives on price action. While chart patterns focus on visual patterns and structures, oscillators provide insights into momentum, overbought/oversold conditions, and buying/selling pressure. By combining these two approaches, you can gain a more comprehensive view of the market and potentially make more informed trading decisions.
Combined with the TRN Swings and/or TRN Divergence, the breakouts of the TRN Chart Patterns, such as the TRN Harmonics or the TRN Wedges, are further reinforced and their signals become even more reliable. For example if a pattern breakout gets confirmed right after a divergence or while we are in the overbought/oversold area of one of the oscillators of TRN Divergence like for example Relative Strength Index (RSI) or Commodity Channel Index (CCI).
If you want to know exactly how to trade the TRN Chart Patterns, study the different sections we have created for the different patterns.
Don't miss out on exploring our TRN Bars and TRN Divergence section to gain a comprehensive understanding of how to accurately identify and effectively trade these signals.
How To Use Divergences In Combination With The TRN Chart Patterns
Combining chart patterns with divergences can be a powerful approach in trading as it combines two different methods of analysis. Chart patterns provide insights into the price action and market sentiment, while divergences can indicate potential shifts in momentum or trend reversal.
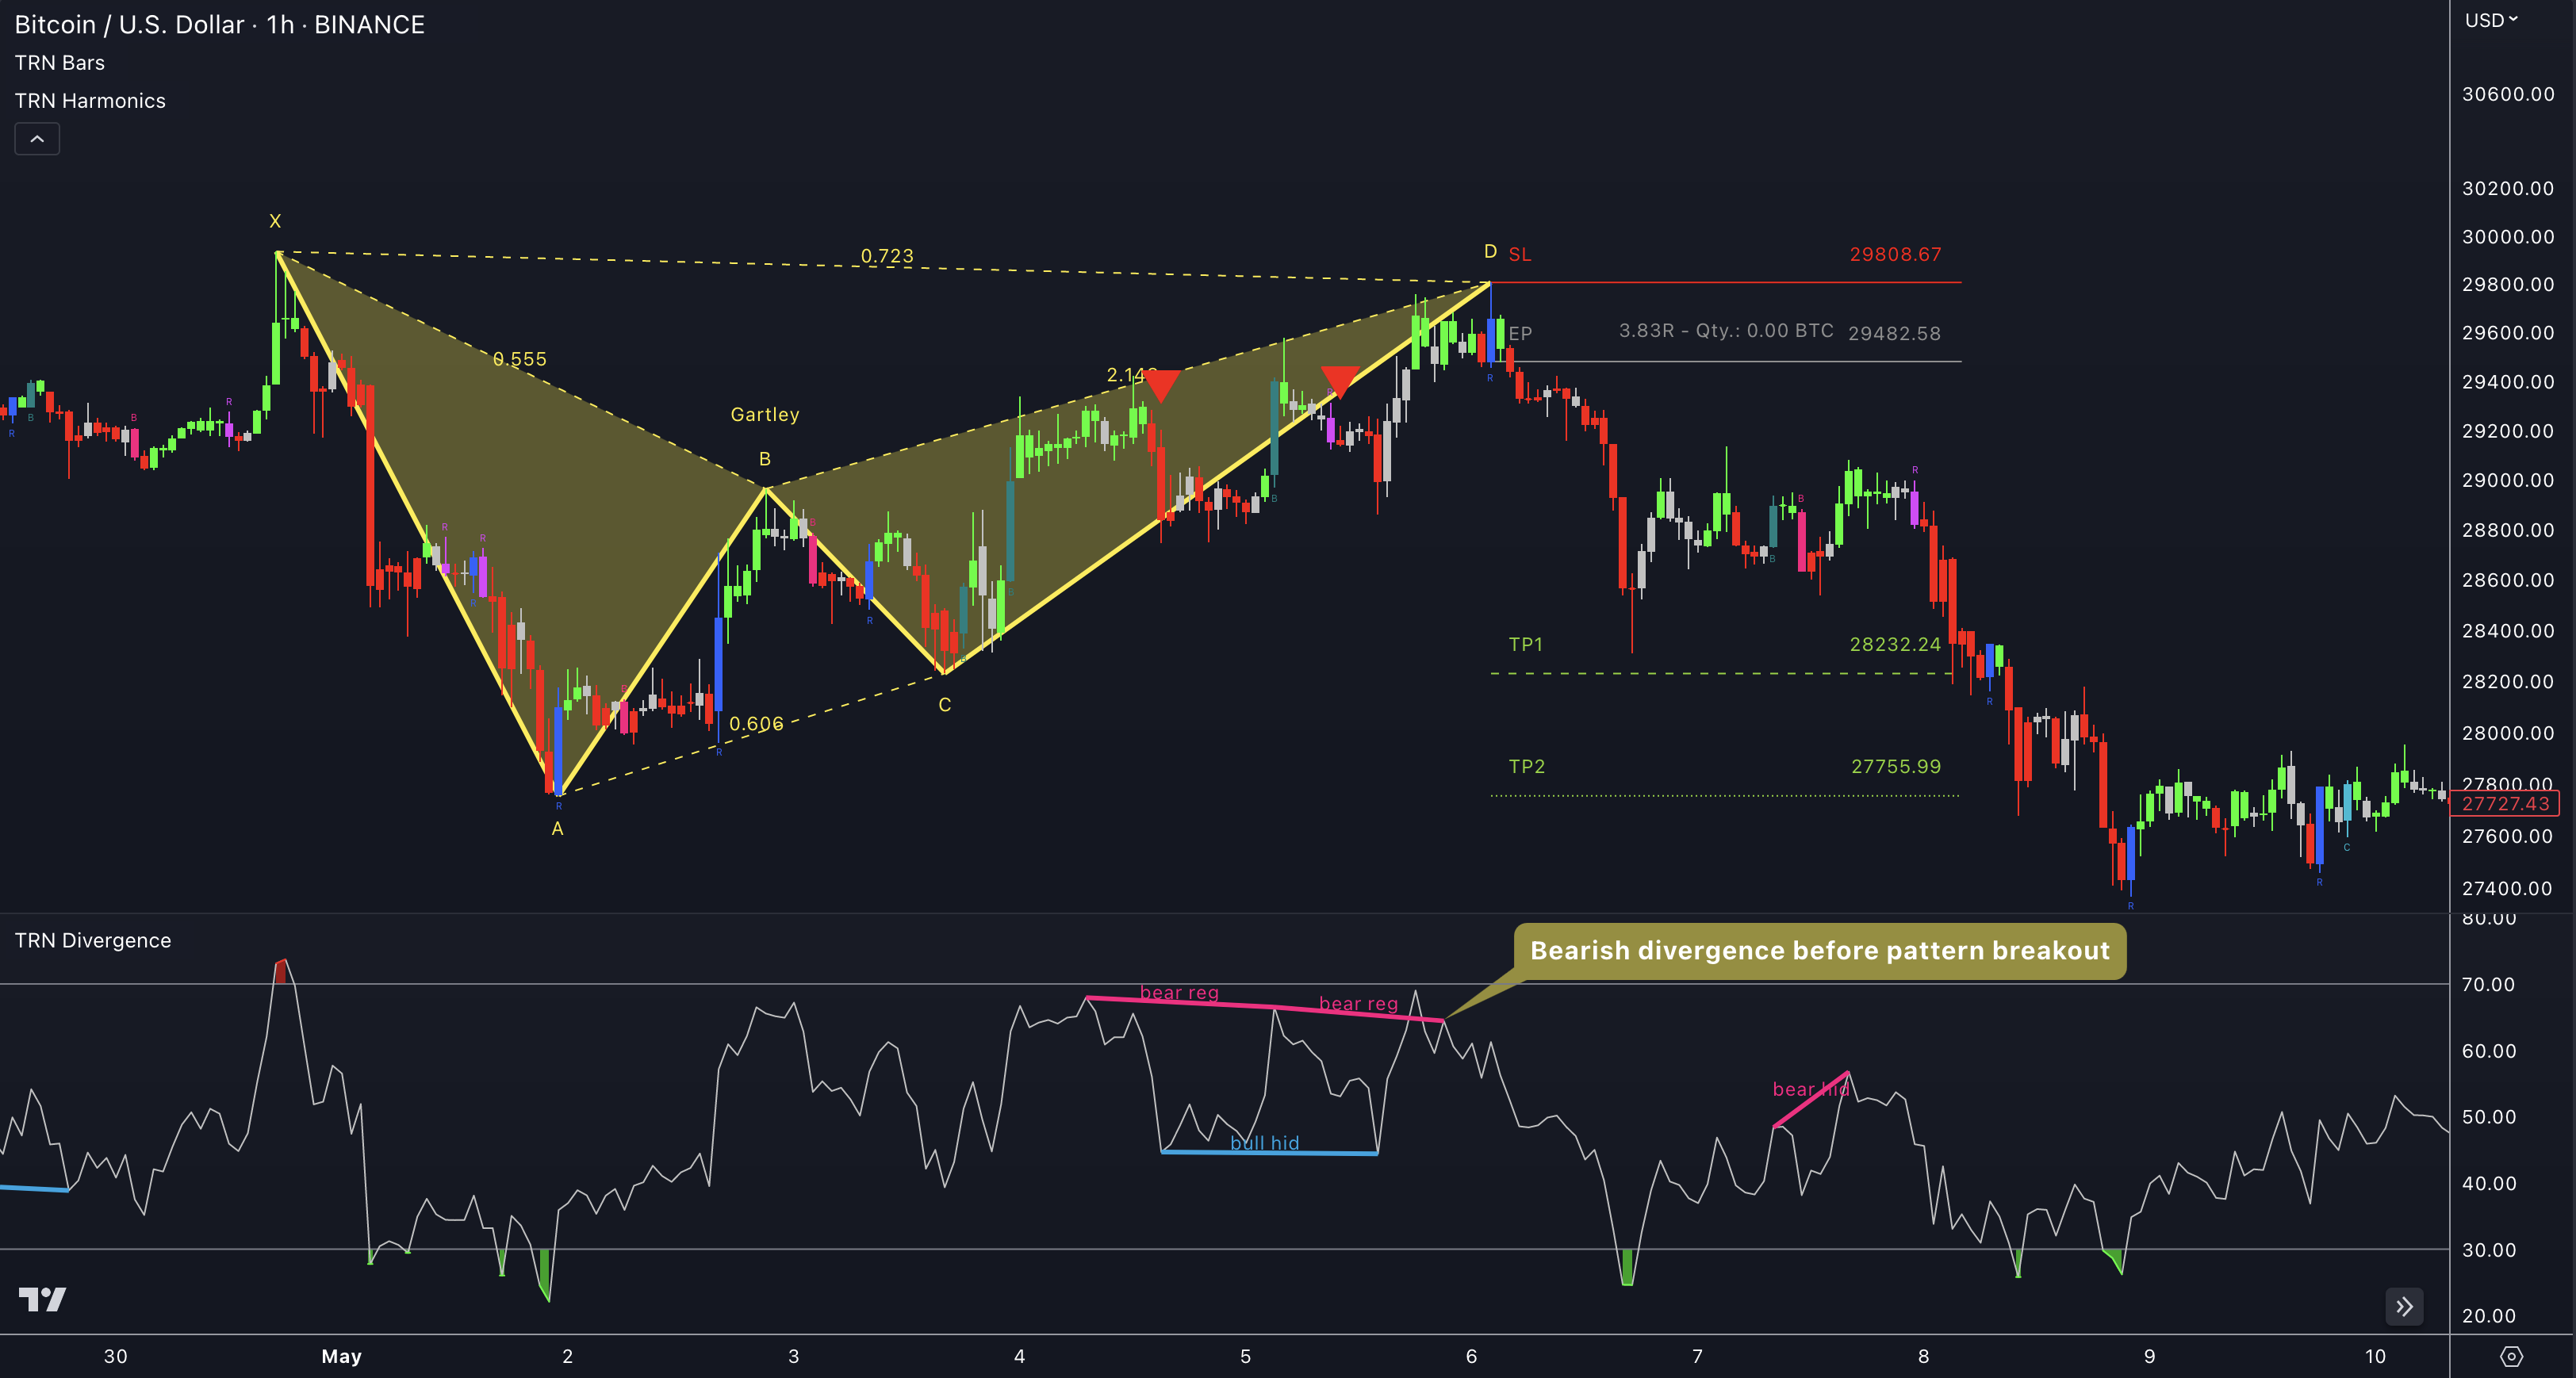
When a TRN chart pattern experiences a confirmed breakout, the presence of a divergence with the previous swing further reinforces the signal's validity.
In the provided example, the breakout from a Gartley pattern using our TRN Harmonics tool was confirmed after an observable bearish RSI divergence had already formed with the preceding swing prior to the breakout. This convergence of factors adds to the signal's significance and enhances its reliability.
How To Use Oscillators In Combination With TRN Chart Patterns
TRN Divergence contains a whole range of oscillators that can be combined with the TRN Chart Patterns. For reversal patterns we recommend the combination with momentum oscillators such as rsi, cci, mfi, stochastic oscillator or williams %R. Continuation patterns, on the other hand, can be combined with trend following oscillators such as the MACD and the AO or with volume oscillators such as CMF.
Visit our 11 Oscillators And Just One Tool section to learn more about the 12 oscillators build in our tool TRN Divergence.
Reversal Patterns
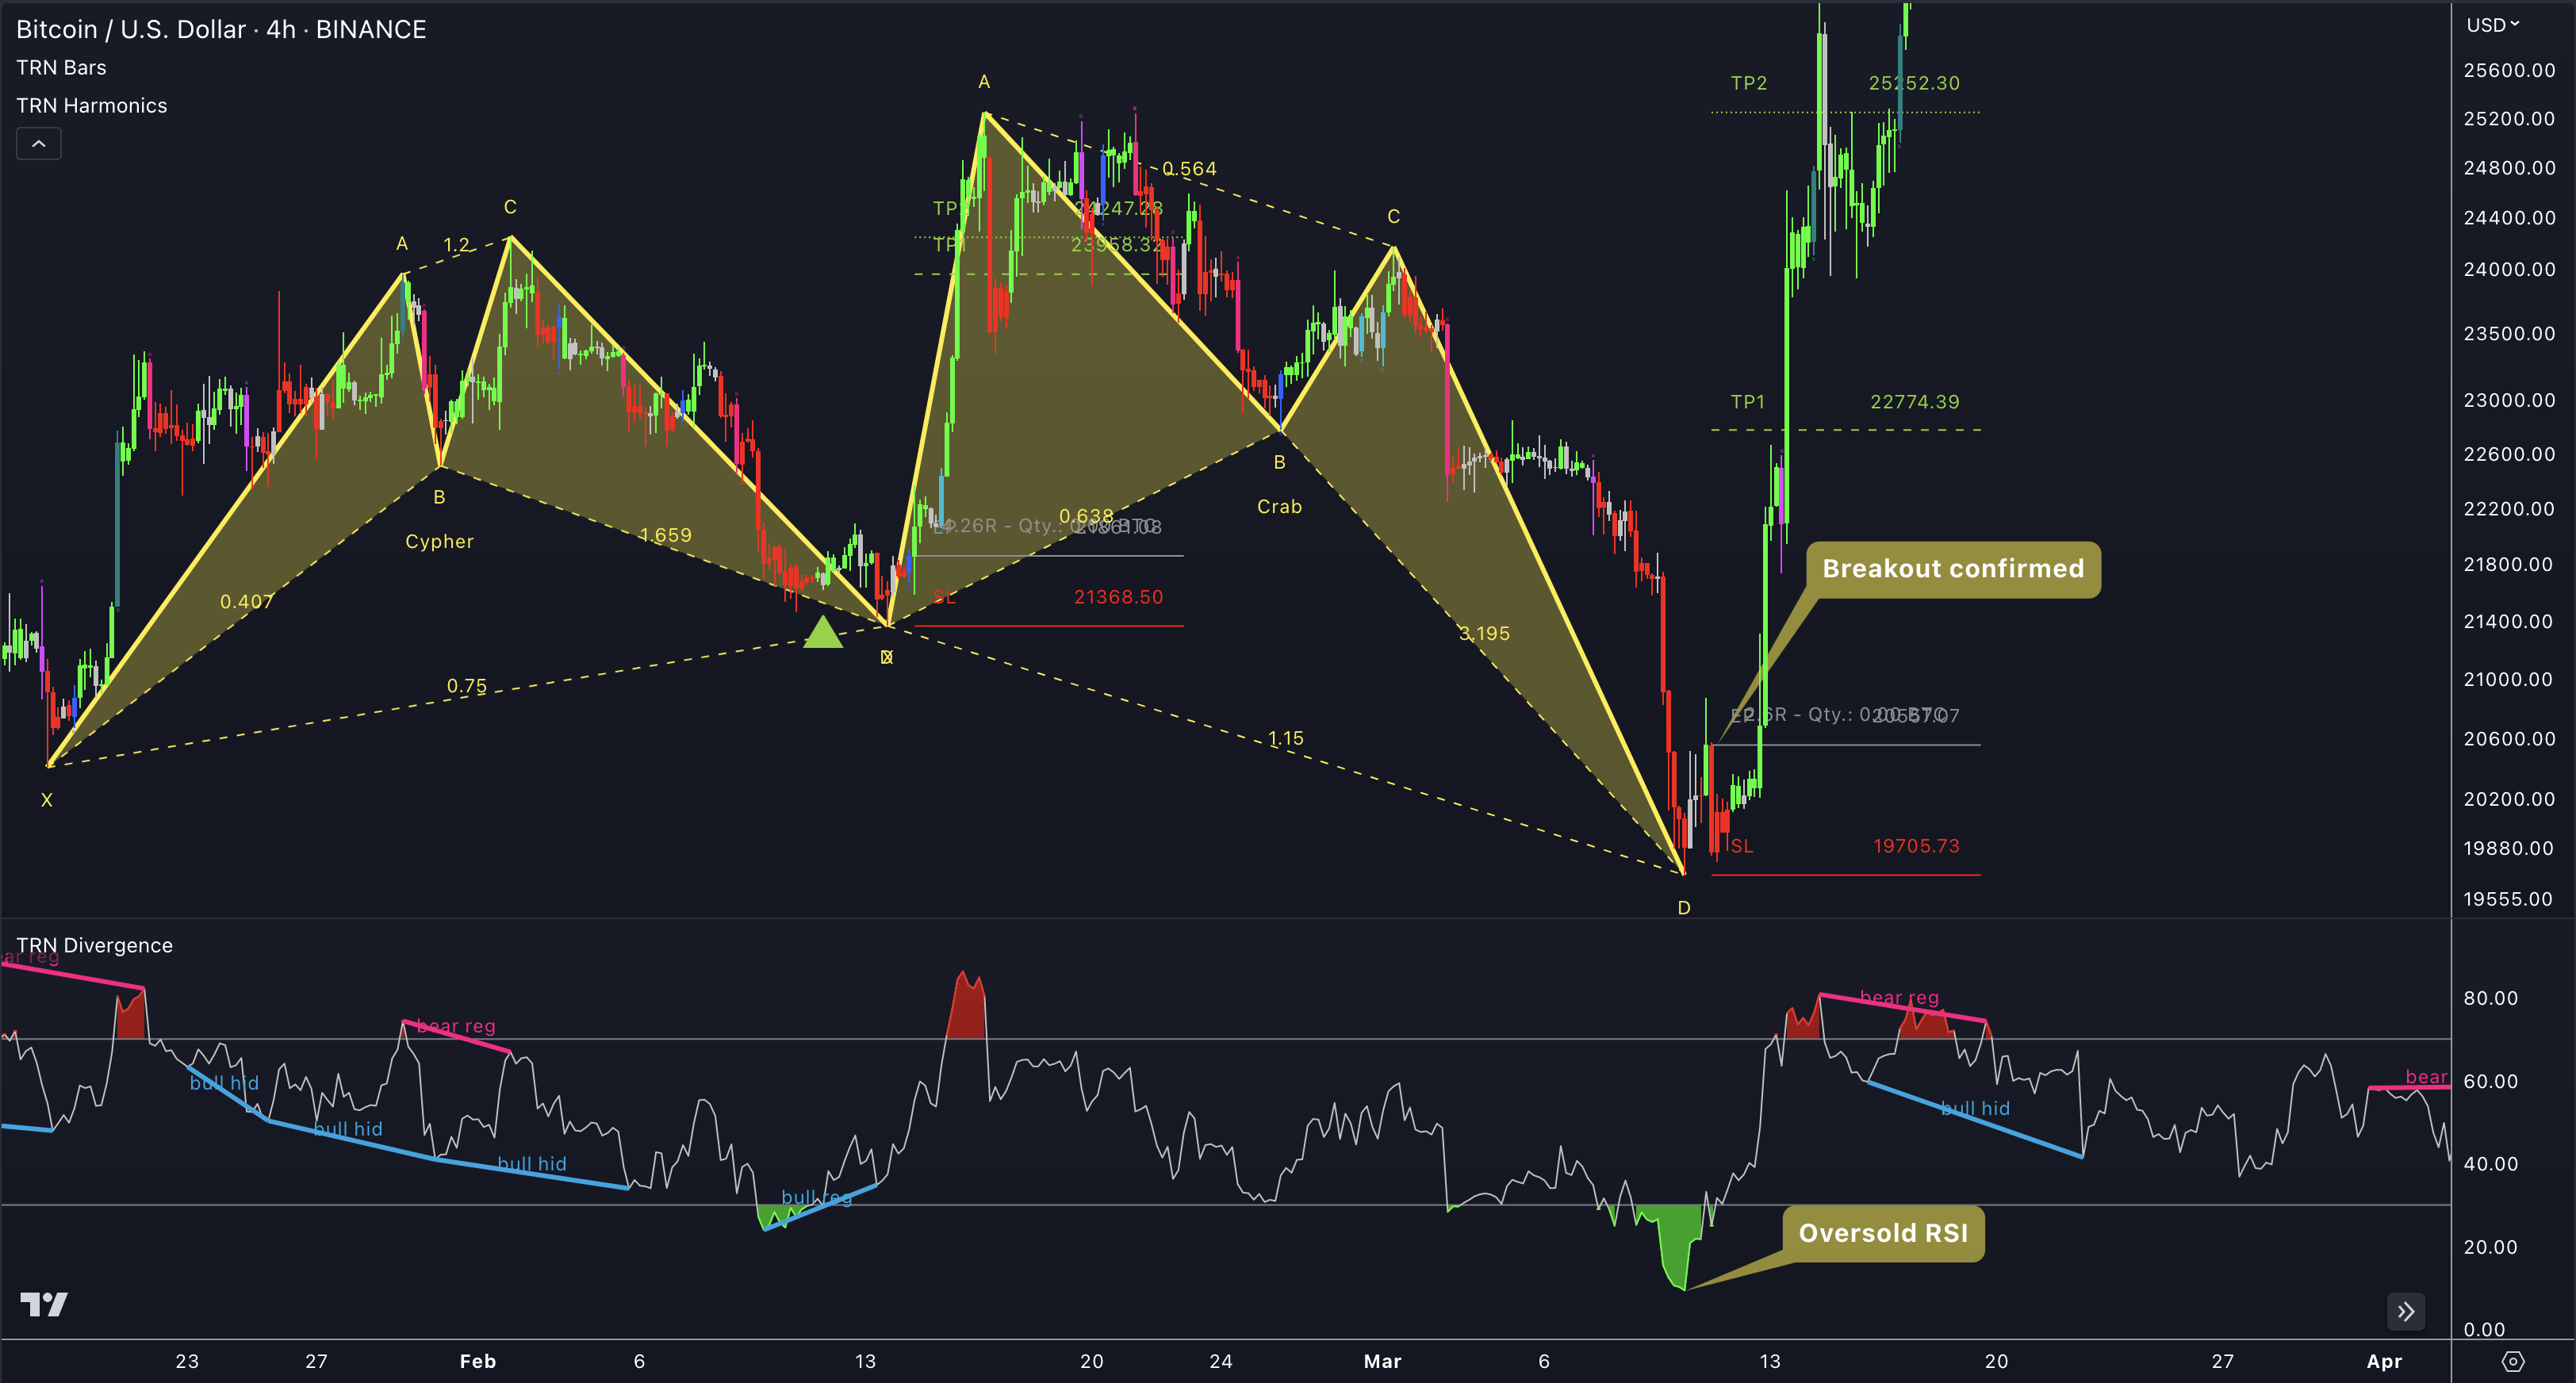
When a breakout emerges from a reversal pattern like the TRN Harmonics, it gains credibility if it happens within the overbought or oversold region of any of the Momentum Oscillators. This occurrence acts as a confirmation of the signal's strength and validity.
In the accompanying figure, you will find an example of a crab pattern identified by our TRN Harmonics Tool. This bullish reversal pattern was further validated when the Relative Strength Index (RSI) departed from the oversold zone, leading to two successful price targets being achieved swiftly, accompanied by significant bullish market movement.
On the other hand, a bearish reversal signal gains potency when the RSI exits the overbought territory, adding further weight to the confirmation of a breakout from a bearish reversal pattern.
Continuation Patterns
When a continuation pattern is confirmed, such as TRN SHS or TRN Rectangle, you can use the Momentum Oscillator or one of the trend following oscillators, such as MACD, CMF or the Awesome Oscillator, to confirm the signal.
If a bullish continuation pattern was confirmed while the respective oscillator was above the zero line (displayed in green), this should be considered as an additional validation of the signal. The same applies if the respective oscillator was below the zero line (displayed in red) while a bearish continuation pattern was confirmed.
Example:
While the signals generated by TRN Chart Patterns and TRN Divergence can be valuable, it is essential to acknowledge that they are not infallible. Numerous external factors can influence the price of stocks or other markets, rendering the signals less reliable in certain situations. Moreover, it is crucial to take into account your personal risk tolerance and investment objectives before executing any trades. A holistic approach that incorporates these considerations will contribute to more informed and well-rounded trading decisions.